@jupyterlab/debugger
Archived
This project is archived. Development is now happening in https://github.com/jupyterlab/jupyterlab.
If you use JupyterLab 3.x:
The debugger extension is shipped by default with JupyterLab 3.x and doesn't need to be installed manually.
Be sure to install a kernel that supports debugging, such as xeus-python:
conda install -c conda-forge xeus-pythonRefer to the documentation for more details: https://jupyterlab.readthedocs.io/en/latest/user/debugger.html
Please open new issues and pull requests on the JupyterLab repo: https://github.com/jupyterlab/jupyterlab
If you use JupyterLab 2.x:
Follow the instructions below.
![]()
A JupyterLab debugger UI extension. This extension is under active development.

Prerequisites
- JupyterLab 2.0+
- xeus-python 0.8.0+
- notebook 6+
Installation
A kernel with support for debugging is required to be able to use the debugger.
It is generally recommended to create a new conda environment to install the dependencies:
conda create -n jupyterlab-debugger -c conda-forge xeus-python=0.8.6 notebook=6 jupyterlab=2 ptvsd nodejs
conda activate jupyterlab-debugger
Then, run the following command to install the extension:
jupyter labextension install @jupyterlab/debuggerUsage
For now xeus-python is the only Jupyter kernel that supports debugging. xeus-python can be selected from the JupyterLab launcher:
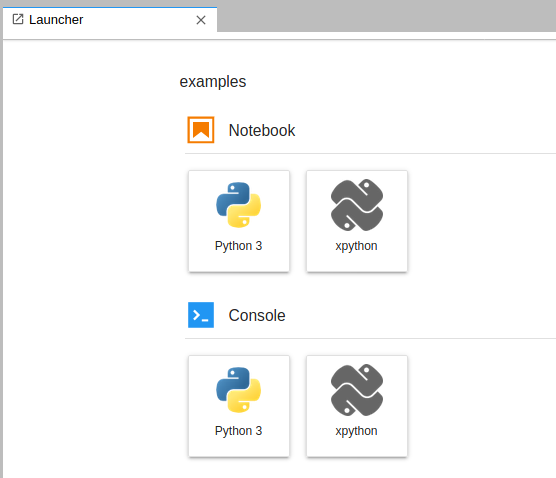
Alternatively, it is also possible to switch to the xpython kernel using the kernel selection dialog:
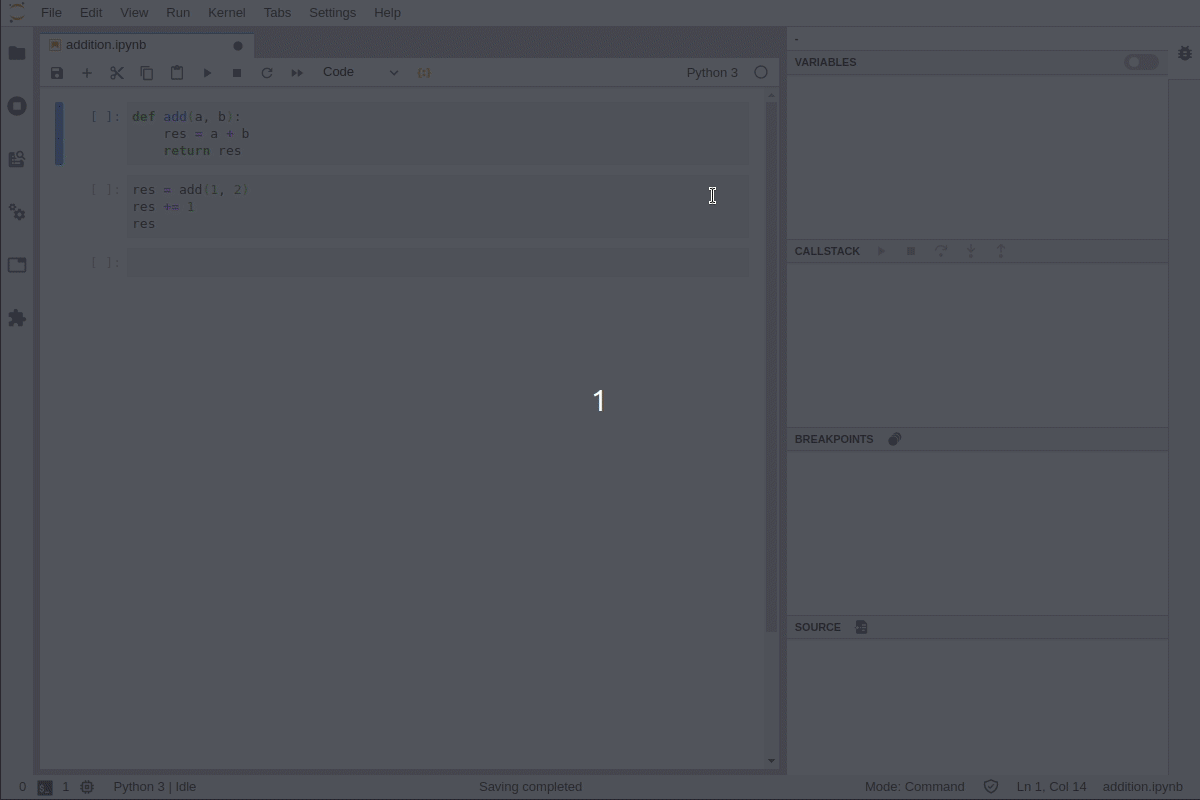
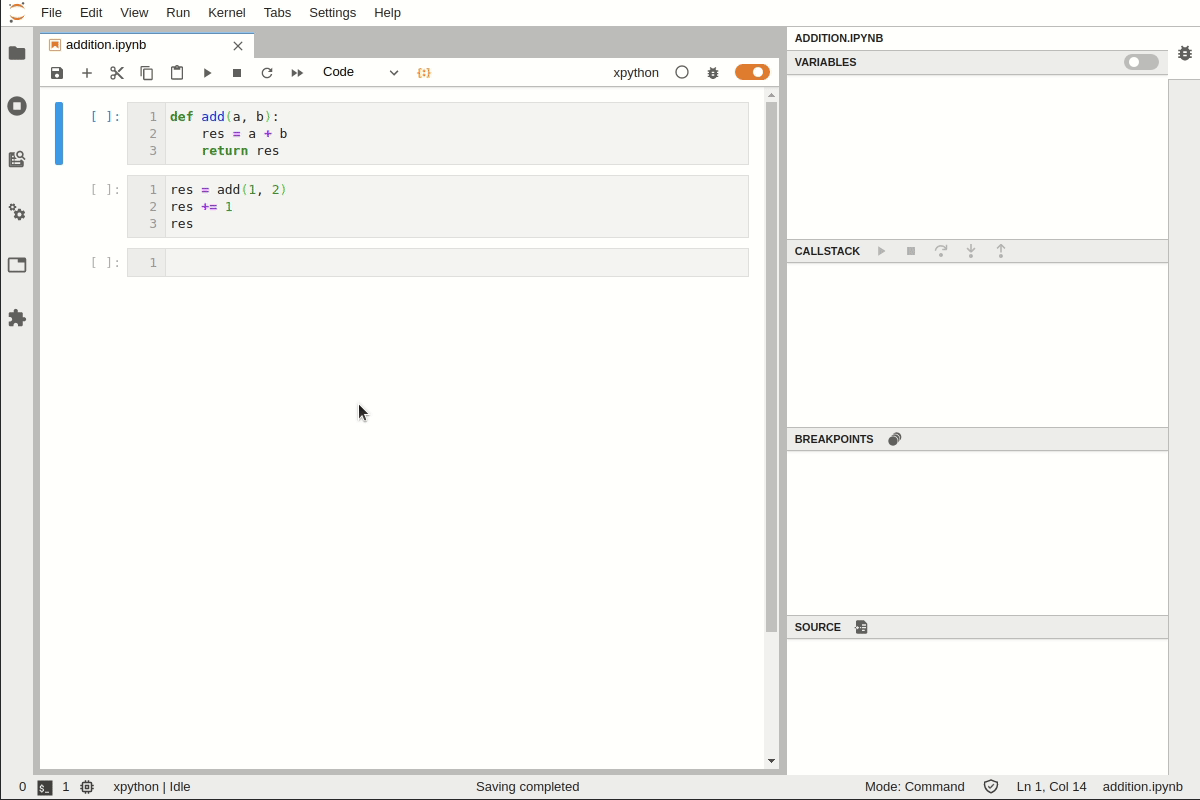
Enable the debugger, set breakpoints and step into the code:
Development
# Create a new conda environment
conda create -n jupyterlab-debugger -c conda-forge nodejs xeus-python=0.8.6 ptvsd jupyterlab=2

# Activate the conda environment
conda activate jupyterlab-debugger

# Install dependencies
jlpm

# Build TypeScript source
jlpm build

# Link your development version of the extension with JupyterLab
jupyter labextension link .

# Rebuild TypeScript source after making changes
jlpm build

# Rebuild JupyterLab after making any changes
jupyter lab build

# Start JupyterLab with the kernel logs enabled and watch mode enabled
XEUS_LOG=1 jupyter lab --no-browser --watch
Tests
To run the tests:
# [Optional] to enable the logs for xeus-python
export XEUS_LOG=1

jlpm run test
To run tests for a specific test suite name:
jlpm run test --testNamePattern=<regex>To run tests for a specific test module name:
jlpm run test --testPathPattern=<regex>Inspecting debug messages
The kernelspy extension for JupyterLab can be used to inspect the debug messages sent between the debugger UI and the kernel.
To install it:
jupyter labextension install jupyterlab-kernelspyDebug Protocol Overview
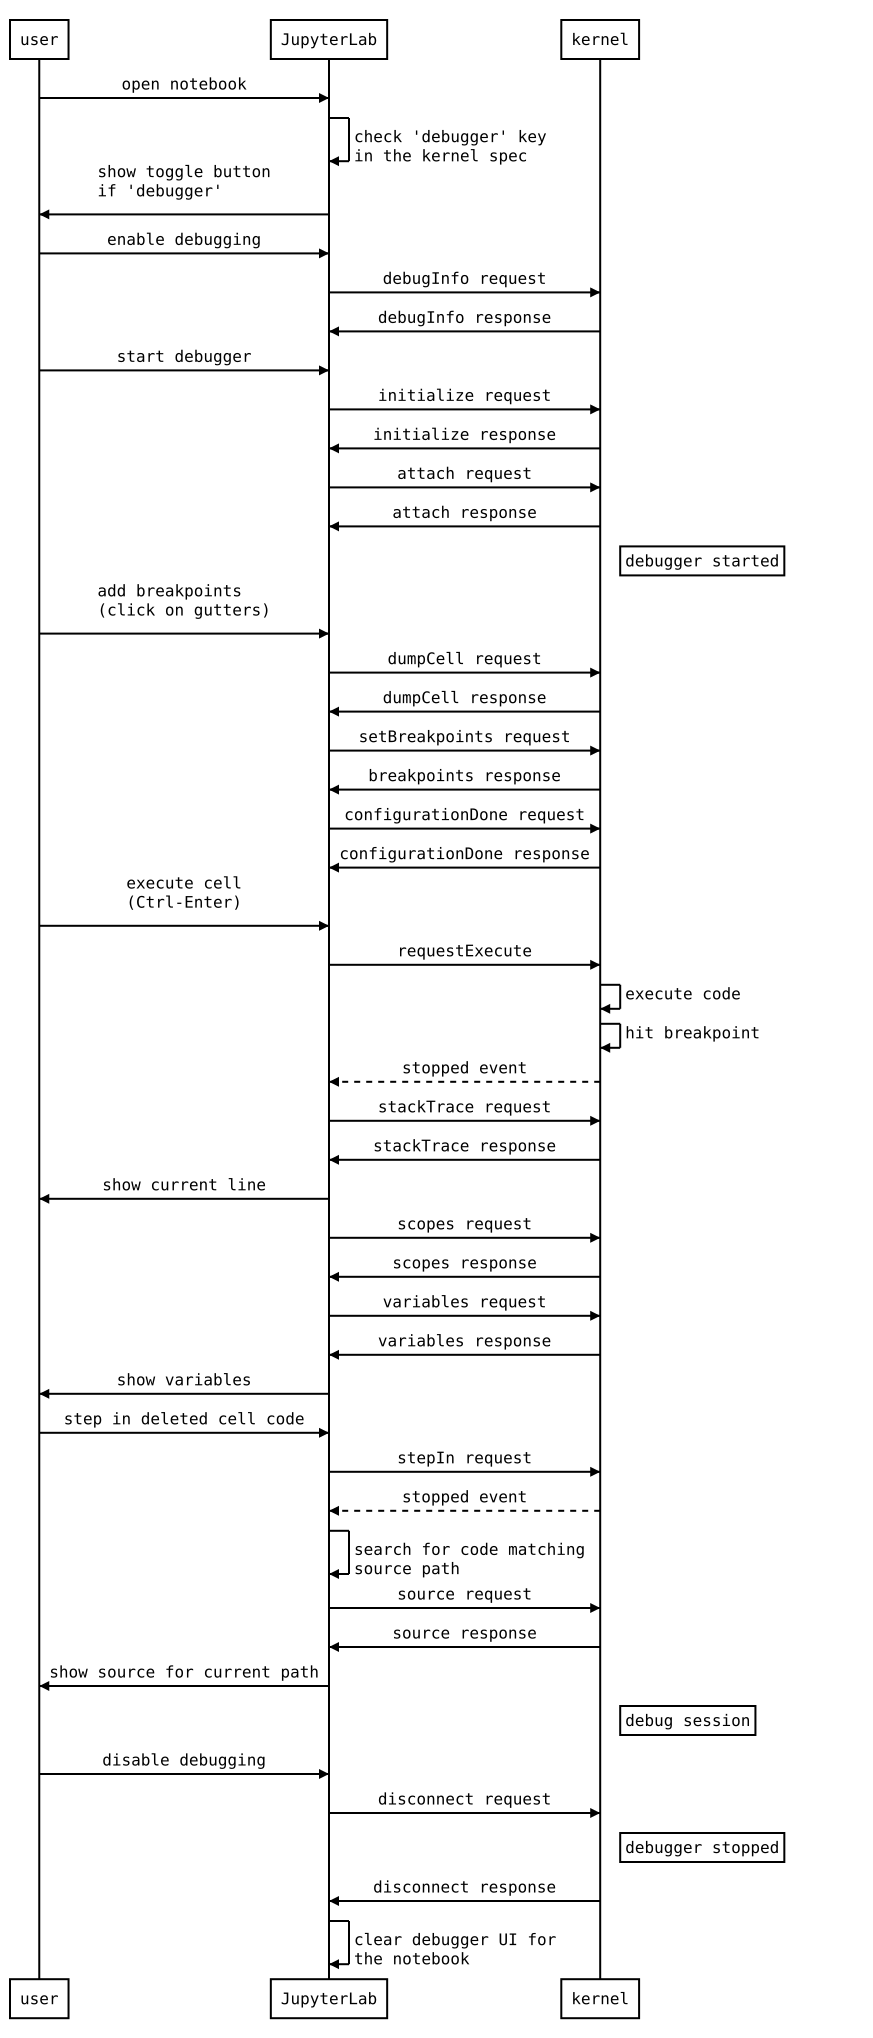
The following diagram illustrates the types of messages sent between the JupyterLab extension and the kernel.
Diagram
References
- Dump cell and state restoration: jupyterlab#52
- Protocol Overview: https://microsoft.github.io/debug-adapter-protocol/overview
- Specification: https://microsoft.github.io/debug-adapter-protocol/specification
Source
Generated using: https://bramp.github.io/js-sequence-diagrams/
Diagram source
user->JupyterLab: open notebookJupyterLab->JupyterLab: check 'debugger' key\nin the kernel spec
JupyterLab->user: show toggle button\nif 'debugger'
user->JupyterLab: enable debugging
JupyterLab->kernel: debugInfo request
kernel->JupyterLab: debugInfo response
user->JupyterLab: start debugger
JupyterLab->kernel: initialize request
kernel->JupyterLab: initialize response
JupyterLab->kernel: attach request
kernel->JupyterLab: attach response
Note right of kernel: debugger started
user->JupyterLab: add breakpoints\n(click on gutters)
JupyterLab->kernel: dumpCell request
kernel->JupyterLab: dumpCell response
JupyterLab->kernel: setBreakpoints request
kernel->JupyterLab: breakpoints response
JupyterLab->kernel: configurationDone request
kernel->JupyterLab: configurationDone response
user->JupyterLab: execute cell\n(Ctrl-Enter)
JupyterLab->kernel: requestExecute
kernel->kernel: execute code
kernel->kernel: hit breakpoint
kernel-->JupyterLab: stopped event
JupyterLab->kernel: stackTrace request
kernel->JupyterLab: stackTrace response
JupyterLab->user: show current line
JupyterLab->kernel: scopes request
kernel->JupyterLab: scopes response
JupyterLab->kernel: variables request
kernel->JupyterLab: variables response
JupyterLab->user: show variables
user->JupyterLab: step in deleted cell code
JupyterLab->kernel: stepIn request
kernel-->JupyterLab: stopped event
JupyterLab->JupyterLab: search for code matching\nsource path
JupyterLab->kernel: source request
kernel->JupyterLab: source response
JupyterLab->user: show source for current path
Note right of kernel: debug session
user->JupyterLab: disable debugging
JupyterLab->kernel: disconnect request
Note right of kernel: debugger stopped
kernel->JupyterLab: disconnect response
JupyterLab->JupyterLab: clear debugger UI for\nthe notebook
Inspecting Debug Messages in VS Code
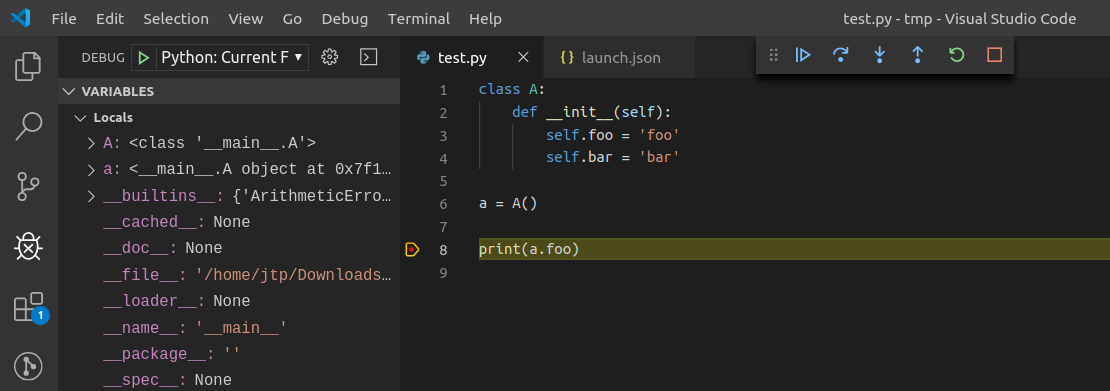
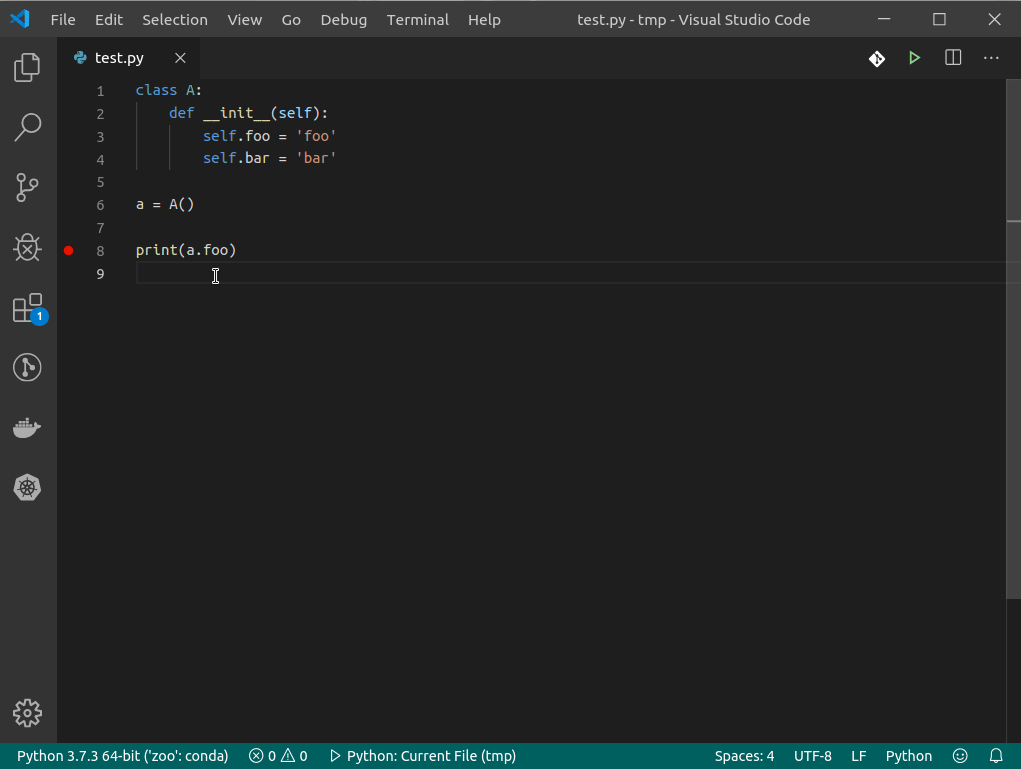
Inspecting the debug messages in VS Code can be useful to understand when debug requests are made (for example triggered by a UI action), and to compare the behavior of the JupyterLab debugger with the Python debugger in VS Code.
Create launch.json
The first step is to create a test file and a debug configuration:

{
  "version": "0.2.0",
  "configurations": [
    {
      "name": "Python: Current File",
      "type": "python",
      "request": "launch",
      "program": "${file}",
      "console": "integratedTerminal",
      "env": { "DEBUGPY_LOG_DIR": "/path/to/logs/folder" }
    }
  ]
}
Start the debugger
Open the logs
The content of the log file look like this:
...

D00000.032: IDE --> {
                "command": "initialize",
                "arguments": {
                    "clientID": "vscode",
                    "clientName": "Visual Studio Code",
                    "adapterID": "python",
                    "pathFormat": "path",
                    "linesStartAt1": true,
                    "columnsStartAt1": true,
                    "supportsVariableType": true,
                    "supportsVariablePaging": true,
                    "supportsRunInTerminalRequest": true,
                    "locale": "en-us"
                },
                "type": "request",
                "seq": 1
            }

...
With:
IDE= VS CodePYD= pydev debugger- Messages follow the DAP: https://microsoft.github.io/debug-adapter-protocol/specification
Overview


![dependabot[bot] avatar](https://avatars.githubusercontent.com/in/29110?v=4 "dependabot[bot]")


