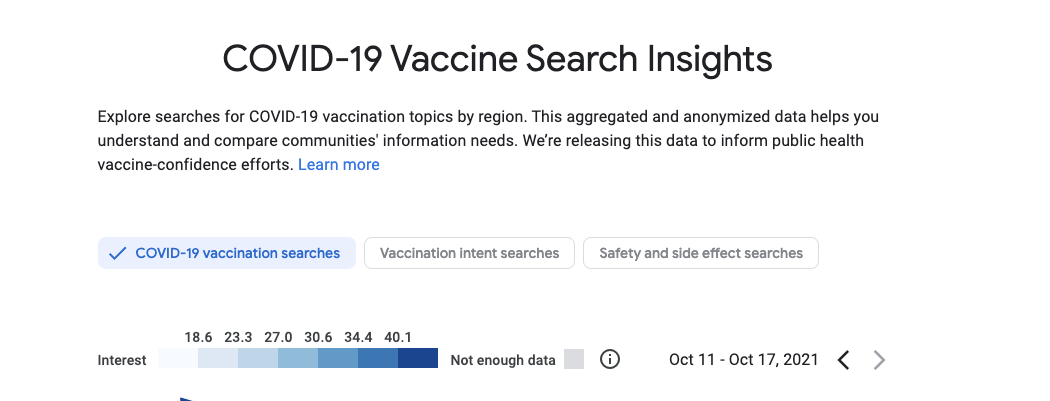
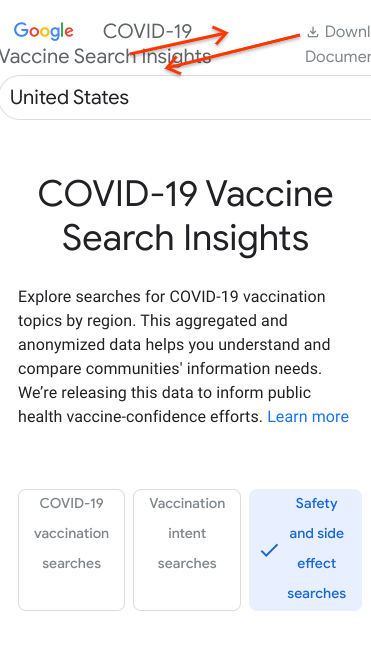
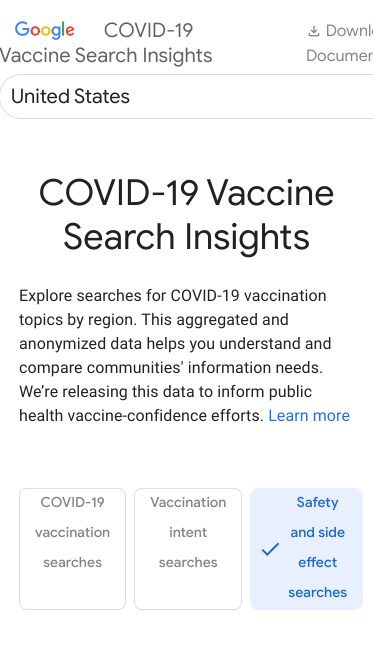
Vaccination Search Insights
This project provides an reference visualization for the Google Vaccination Search Insights data set.
This is not an official Google product.
Keep reading or download the data directly.
About this data
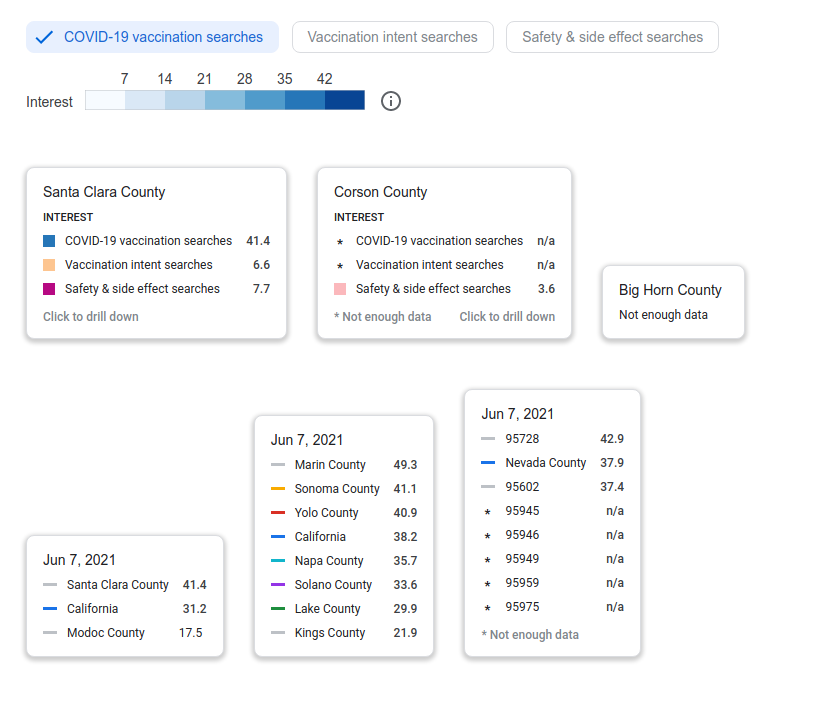
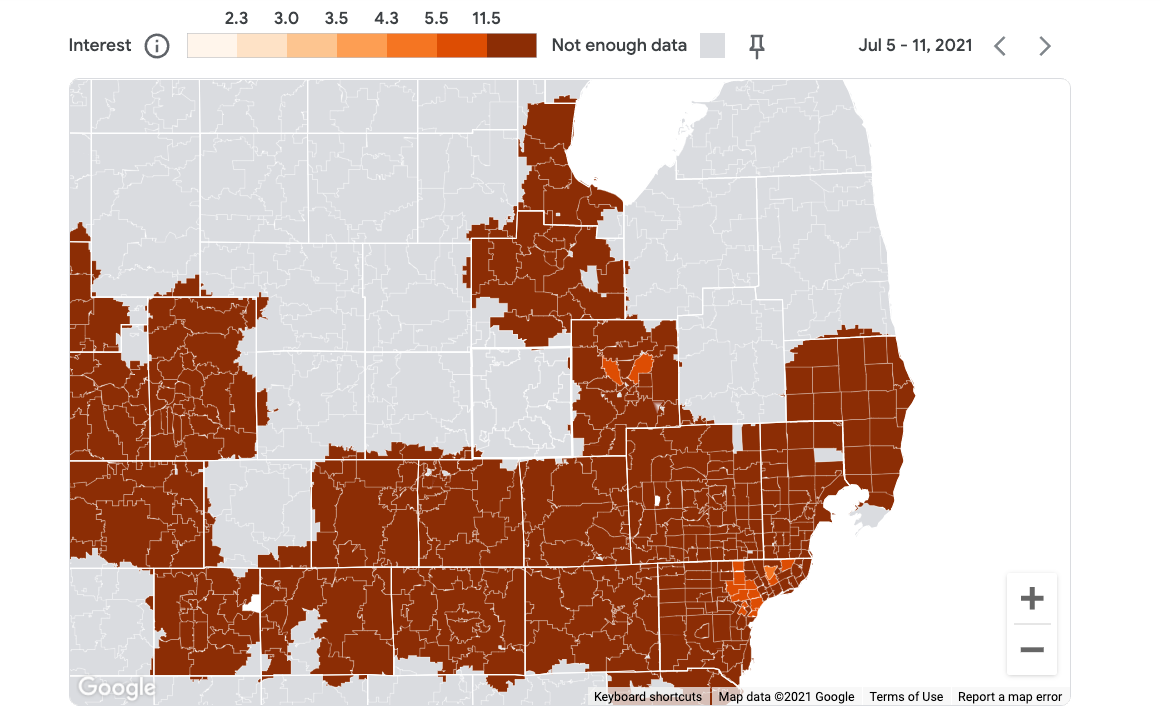
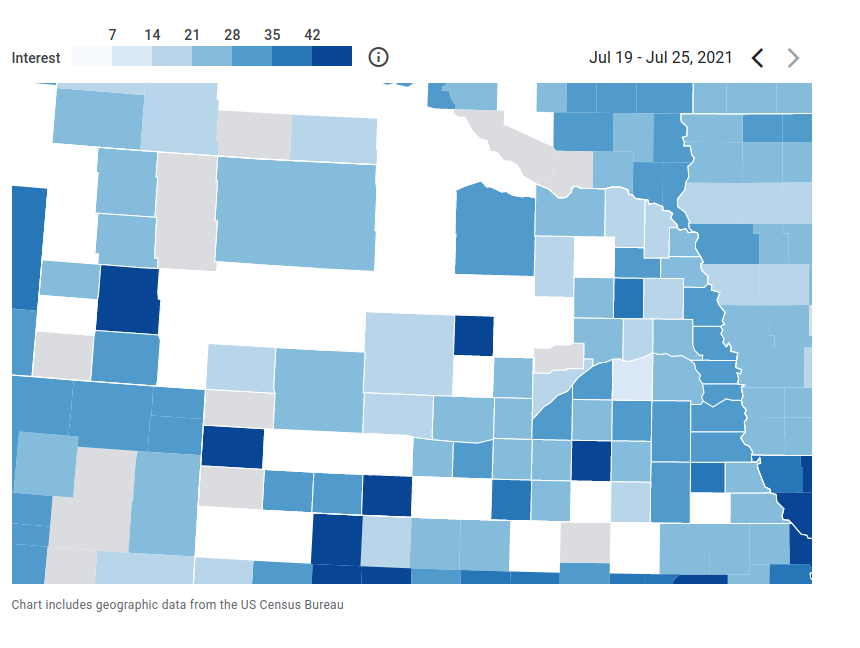
You can use this data to compare search interest between topics related to COVID-19 vaccination. The value for search interest isn’t an absolute number of searches—it’s a value representing relative interest which we scale to make it easier to compare regions with one another, or the same region over time. If you’d like to know more about our calculation and process, see our technical docs.
How to best use this data
We used the same normalization and scaling everywhere so that you can make these comparisons:
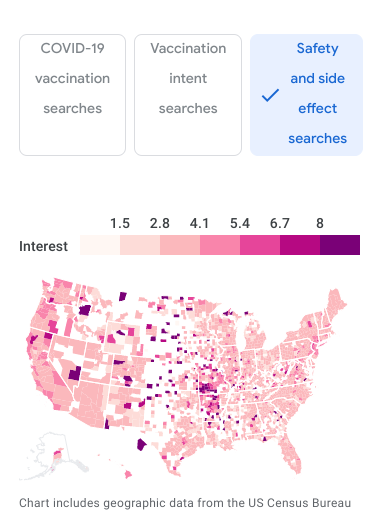
- Compare a region with others to see where you might focus effort.
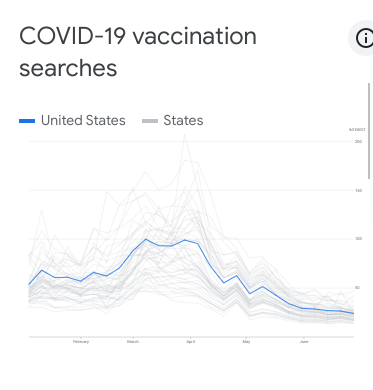
- Compare a region over time to see how your community’s information needs have changed or see the impact of your communication efforts and news events.
Remember, the data shows people’s interest—not opinions or actual events. You can’t conclude that a community is suffering from many side effects because there’s increased interest in the safety and side effects category.
Protecting privacy We developed the Vaccine Search Insights to be helpful while adhering to our stringent privacy protocols for search data. No individual search queries or other personally identifiable information are made available at any point. For this data, we use differential privacy, which adds artificial noise to our data while enabling high quality results without identifying any individual person.
Availability and updates
To download or use the data or insights, you must agree to the Google Terms of Service.
We’ll update the data each week. You can check the dates in the charts to see the most recent day in the data. If you download the CSV, remember to get an updated version each week.
We'll continue to update this product while public health experts find it useful in their COVID-19 vaccination efforts. Our published data will remain publicly available to support long-term research and evaluation.
Query the dataset
Get real-time insights using Google Cloud’s BigQuery. Analyse with SQL or call APIs from your code.
Analyze with covariates
Analyze the data alongside other covariates in the COVID-19 Open Data Repository.
Tell us about your project
We’d love to hear more about how you’re using Vaccination Search Insights. If you’ve solved problems, we’d like to help you share your solutions.
Dashboard development
Getting started
This project should build in most posix-like enviroments. Besides npm, it has small dependencies on make and wget.
Install the dependencies...
npm install...then start Rollup:
npm run devNavigate to localhost:5000. You should see your app running. Edit a component file in src, save it, and reload the page to see your changes.
Development process and releasing
All changes require a PR. Normal feature PRs are merged into dev. When it's time for a release:
Install https://github.com/release-it/release-it
$ npm install -g release-itThen create the release branch from dev and push it as a new PR. Say you want to release version 1.2.3
$ git checkout dev
$ git pull --all
$ git checkout -b release-v1.2.3 origin/dev
$ git push -u origin release-v1.2.3
$ release-it 1.2.3
Then create the PR and make sure that the PR will merge into main. If there are any issues found during release testing, they can be made directly on the release branch or cherry-picked from dev.
Afterwards there should be a sync PR from main back into dev (like #93).
Deployment
.github/gh-pages.yml defines a process publishes build output to a special branch called gh-pages, whenever there is a new push (e.g. PR merging) on the main branch. This workflow can also be manually triggered, which may be handy to include a new version of the data set.

![dependabot[bot] avatar](https://avatars.githubusercontent.com/in/29110?v=4 "dependabot[bot]")