快速开始
特点
qcharts-vue 是一个基于 spritejs , QCharts 封装的 Vue 图表库,可以让用户以组件的形式组合出各种图表。 → 详细文档
如何使用
1.通过 npm 获取 CatChartsVue,我们提供了 CatChartsVue npm 包,通过下面的命令即可完成安装,Demo:Quickstart
npm install qcharts-vue --save// 通过模块引入的方式使用CatCharts
import * as QchartsVue from 'qcharts-vue'
Vue.use(QchartsVue)2.通过 cdn 获取 QchartsVue,通过下面的标签引入 QchartsVue,因为 QchartsVue 依赖 Vue 与 spritejs,所以需要先引入这两个,Demo:Quickstart
<script src="https://cdn.jsdelivr.net/npm/vue/dist/vue.js"></script>
<script src="https://unpkg.com/spritejs@3/dist/spritejs.min.js"></script>
<script src="https://unpkg.com/@qcharts/core@1/dist/index.js"></script>
<script src="https://unpkg.com/qcharts-vue/lib/index.js"></script>
// 通过cdn的方式使用CatCharts
Vue.use(QchartsVue)开始绘制图表
完成一个 QchartsVue 的组件或者页面
<template>
<div class="chart">
<s-chart :data="lineData" :data-fields="dataFields" :size="[700,600]">
<s-line :attrs="attrs" />
<s-axis :attrs="{orient:'left'}" />
<s-axis :attrs="{orient:'bottom'}" />
<s-tooltip :attrs="tooltipAttrs" />
</s-chart>
</div>
</template>
<script>
export default {
data: function() {
return {
attrs: {
pos: ['10%', '10%'],
size: ['80%', '80%']
},
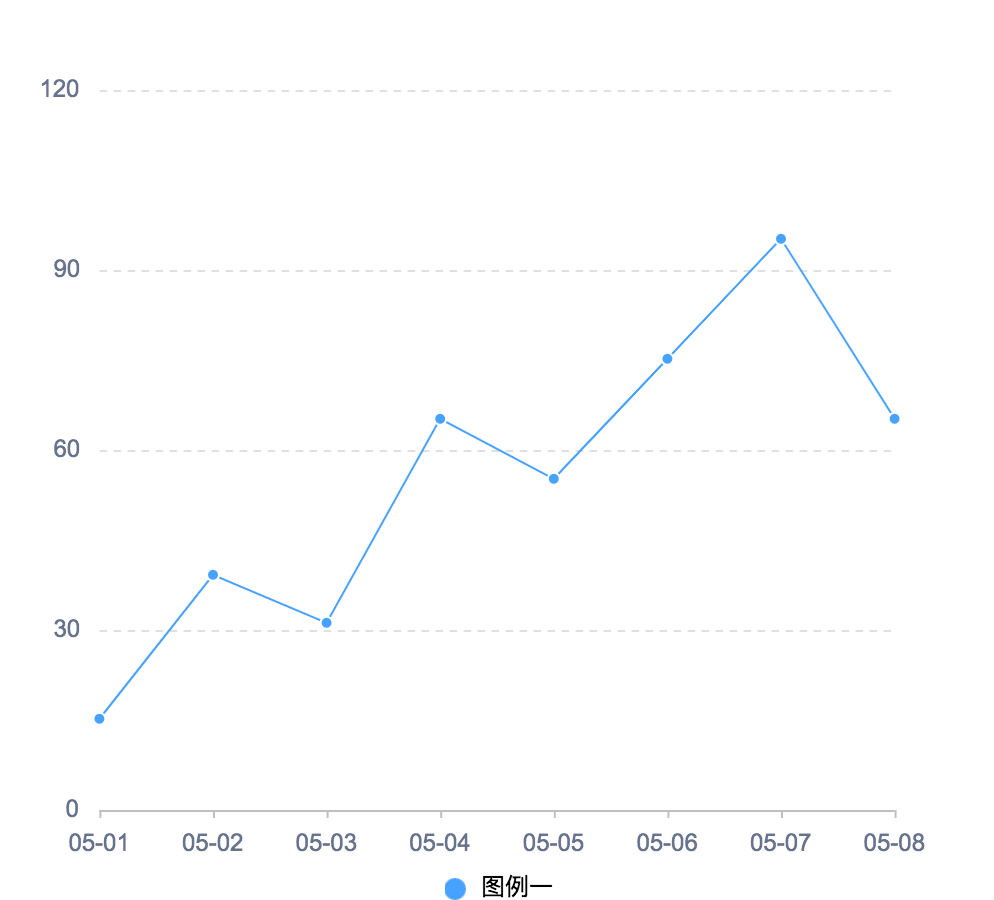
lineData: [
{ date: '05-01', catgory: '图例一', sales: 15.2 },
{ date: '05-02', catgory: '图例一', sales: 39.2 },
{ date: '05-03', catgory: '图例一', sales: 31.2 },
{ date: '05-04', catgory: '图例一', sales: 65.2 },
{ date: '05-05', catgory: '图例一', sales: 55.2 },
{ date: '05-06', catgory: '图例一', sales: 75.2 },
{ date: '05-07', catgory: '图例一', sales: 95.2 },
{ date: '05-08', catgory: '图例一', sales: 65.2 }
],
tooltipAttrs: {
formatter: data => `${data.date}-${data.catgory}-${data.sales}`
},
dataFields: {
row: 'catgory',
value: 'sales',
text: 'date'
}
}
}
}
</script>
<style>
.chart {
height: 600px;
}
</style>一张折线图就绘制成功