GithubHelp home page GithubHelp logo

iamleson98 / graph-maker-front-end Goto Github PK

View Code? Open in Web Editor NEW
13.0 1.0 1.0 4 MB

users can create charts they want with a sophisticated user interface and save them for later use.

Home Page: https://5fdc3bf2cfb436000848be50--vibrant-meninsky-70af9a.netlify.app/chart

HTML 0.04% CSS 91.27% TypeScript 8.63% JavaScript 0.05% Shell 0.01%
reactjs graphql apollographql material-ui charts chart-data chartjs graphs tailwindcss

graph-maker-front-end's Introduction

Build Status

chart demo

Features

  1. Multi languges support (English, Vietnamese, Chinese)
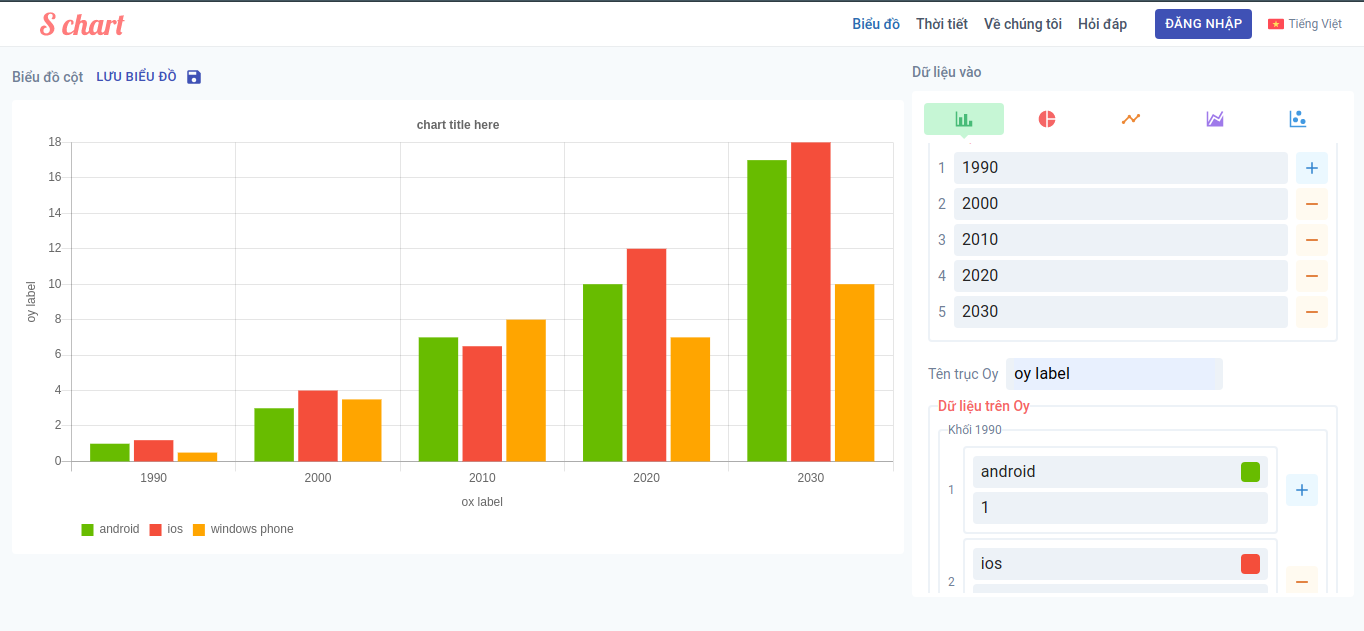
  2. Draw charts quickly as user fill in the chart data form
  3. Save chart data in database or as png files so users can view them later
  4. 5 chart popular chart types supported
    1. area
    2. scatter
    3. line
    4. bar
    5. pie (doughnut)

Design file

Figma link

npm start

Runs the app in the development mode.
Open http://localhost:3000 to view it in the browser.

The page will reload if you make edits.
You will also see any lint errors in the console.

npm run build

Builds the app for production to the build folder.
It correctly bundles React in production mode and optimizes the build for the best performance.

The build is minified and the filenames include the hashes.
Your app is ready to be deployed!

See the section about deployment for more information.

contribution guide

Please create a pull request and i will review it as soon as possible Thank you!

graph-maker-front-end's People

Contributors

iamleson98 avatar

Stargazers

 avatar  avatar  avatar  avatar  avatar  avatar  avatar  avatar  avatar  avatar  avatar  avatar  avatar

Watchers

 avatar

Forkers

phuczk

graph-maker-front-end's Issues

[Feature request] Support more import methods & HTML export

List of requesting features

Feature Description
CSV, Google Sheet import Can import data by CSV file or Google Sheet
HTML Exporter Export chart with nice format & animation in HTML

Problems

Working with chart = working with data, A-LOT-OF-DATA.
So the first problem is UX friendly. Is the UI with lots of input-fields friendly with user in this case? Absolutely not.
Then the most pressing global issue today is....

1. Support CSV, Google Sheet Import

  • Life will be easier
  • UI will be simplier
  • User will be happier
  • More way to import = more user traffic

2. HTML Exporter

  • One of website chart rendering advantages compare with boring-traditional chart maker (Excel, Docs...) is animation or better UI.
  • ChartJS already help you with the better UI, right?
  • Then you should take advantage in animated chart in presentation

Solution

1. CSV, Google Sheet import

  • For CSV there are many library to convert CSV file => array object or something similar
  • Google has published Drive API for centuries. You should look into their documentation

2. HTML Exporter

  • Setting up a backend API to push your user input chart data, user chart config
  • That API will retrieve those information & parse in pre-defined HTML chart template at backend.
  • Package or zip needed resources into 1 HTML or zip file. Then we will send it back to user.

Recommend Projects

  • React photo React

    A declarative, efficient, and flexible JavaScript library for building user interfaces.

  • Vue.js photo Vue.js

    ๐Ÿ–– Vue.js is a progressive, incrementally-adoptable JavaScript framework for building UI on the web.

  • Typescript photo Typescript

    TypeScript is a superset of JavaScript that compiles to clean JavaScript output.

  • TensorFlow photo TensorFlow

    An Open Source Machine Learning Framework for Everyone

  • Django photo Django

    The Web framework for perfectionists with deadlines.

  • D3 photo D3

    Bring data to life with SVG, Canvas and HTML. ๐Ÿ“Š๐Ÿ“ˆ๐ŸŽ‰

Recommend Topics

  • javascript

    JavaScript (JS) is a lightweight interpreted programming language with first-class functions.

  • web

    Some thing interesting about web. New door for the world.

  • server

    A server is a program made to process requests and deliver data to clients.

  • Machine learning

    Machine learning is a way of modeling and interpreting data that allows a piece of software to respond intelligently.

  • Game

    Some thing interesting about game, make everyone happy.

Recommend Org

  • Facebook photo Facebook

    We are working to build community through open source technology. NB: members must have two-factor auth.

  • Microsoft photo Microsoft

    Open source projects and samples from Microsoft.

  • Google photo Google

    Google โค๏ธ Open Source for everyone.

  • D3 photo D3

    Data-Driven Documents codes.