D3 Cesium Demo Application
Immersive and interactive analytical environments are paramount for communicating dynamic and complex data to various stakeholders. This application showcases the synergy between powerful open source visualization frameworks of D3 and Cesium, by recreating Hans Rosling’s compelling visualization of the “Health and Wealth of Nations”. This demo is largely the result of @abwood and @emackey ’s entry for a one day hackathon hosted at Analytical Graphics, Inc in April of 2013. The goal of this hackathon attempt was to demostrate the simplicity of supplementing 3D geospatial visualizations with rich and interactive dynamic data plots.
The app repurposed Mike Bostock’s D3 recreation of Hans Roslings’ “Health and Wealth of Nations” as an interactive overlay for a Cesium geospatial view. We were able to add new context to the data by geolocating each data point with its country of origin.
Health and Wealth Dataset
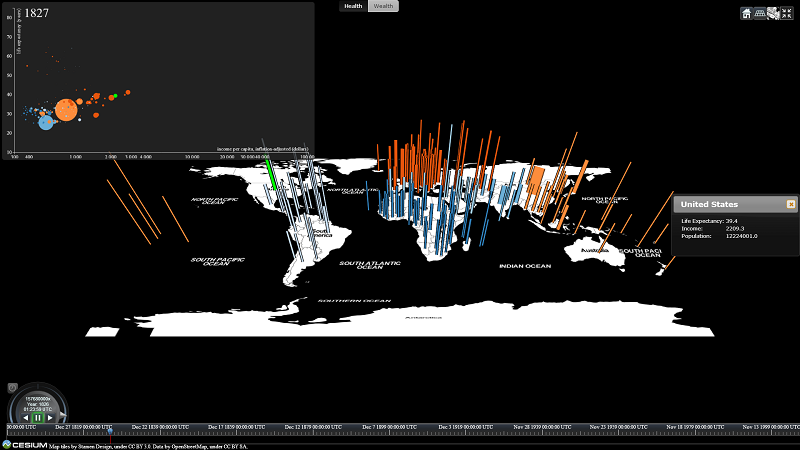
Hans Rosling first introduced the 2d visualization shown in this dataset on income, population, and life expectancy for nations over the span of 200 years. Along the x axis, we have income per capita, inflation adjusted (dollars), while on the y axis we have life expectancy in years. The further a nation is to the right on the graph, the wealthier the people; the higher up a nation is plotted on the graph, the healthier the nation. The radius of each circle is tied to the population of the nation.
In Cesium, both income and life expectancy metrics are geolocated to the nation of origin and drawn on the map in Columbus view, using Polylines. The width of the polyline is proportional to the population of the nation at the given year.
Implementation Overview
In Cesium, both income and life expectancy metrics are geolocated to the nation of origin and drawn on the map in 2.5D Columbus view, using Polylines. The width of the polyline is proportional to the population of the nation at the given year. We found that the presentation of this data was most effective in Cesium’s Columbus View, although users may change to other projections, such as the more traditional 3D globe view, via the SceneModePicker widget.
For a cohesive visualization, both D3 and Cesium visualizations must interoperate. In our example application, we show simple
but effective ways to tie these two visualizations together. Mouseover interactions with a nation, in either display, will
highlight the nation’s Polyline in Cesium and the SVG circle in the D3 chart. Likewise, clicking on a nation will construct
a CameraFlightPath to fly the 3D camera
in Cesium in for a closer look. The key to loose coupling of these two visualizations was to use
d3.dispatch for signaling events between each other.
In theory, additional overlays can easily be added to this application to supplement the handling of these dispatch events.
Installing from the git console
This sample application is setup to stay current with the Cesium repository, by use of git submodules. To setup this application on a local machine, follow the instructions below.
> git clone https://github.com/abwood/d3cesium.git
> git submodule update --init
> cd 3rdParty/cesium
> Tools/apache-ant-1.8.2/bin/ant
Running the sample application locally
For convenience, a sample python file is included in this repository to simplify the setup of a webserver on a local machine. With Python 2.X installed, simply run the runServer.py script to start the webserver on port 8080.


