GithubHelp home page GithubHelp logo

inasafe / inasafe Goto Github PK

View Code? Open in Web Editor NEW
254.0 54.0 136.0 243.24 MB

InaSAFE - QGIS plugin for estimating impact from natural disasters

Home Page: www.inasafe.org

License: GNU General Public License v3.0

Python 85.35% QML 9.46% HTML 1.48% Makefile 0.33% CSS 0.17% JavaScript 0.01% Shell 0.70% C 2.19% XSLT 0.16% Batchfile 0.01% NSIS 0.15% Dockerfile 0.01%
qgis-plugin python qgis inasafe risk disasterresponse

inasafe's Introduction

InaSAFE

InaSAFE Screenshot

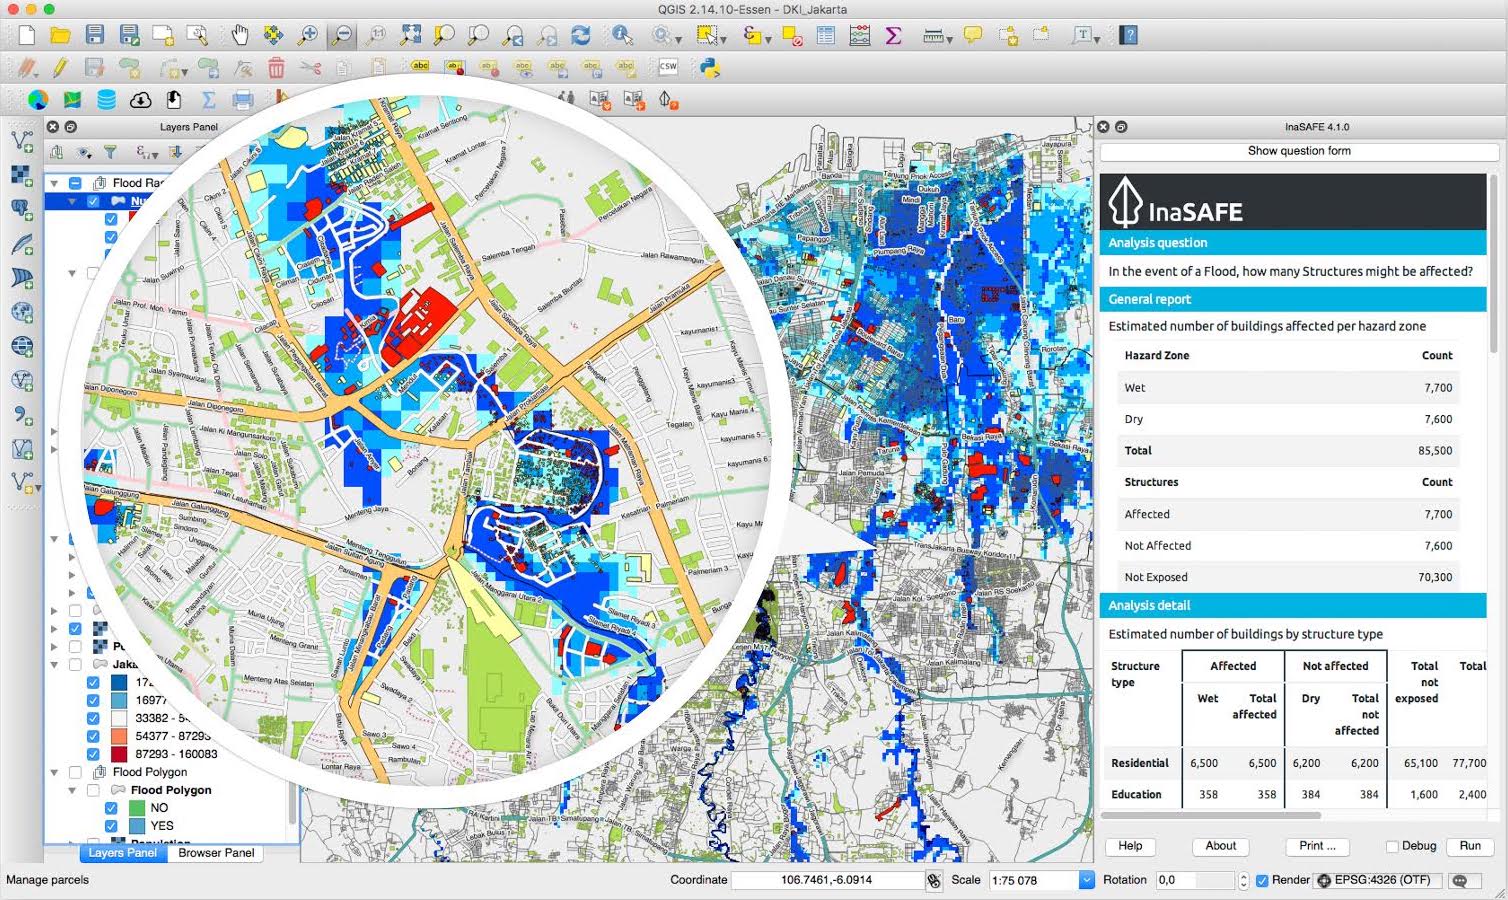
InaSAFE is free software that allows disaster managers to study realistic natural hazard impact scenarios for better planning, preparedness and response activities. InaSAFE is a plugin for QGIS.

For more information about InaSAFE and its documentation please visit inasafe.org.

The latest source code is available at https://github.com/inasafe/inasafe, which contains modules for risk calculations, GIS functionality and functions for impact modelling.

  • Current Travis test status master: Travis Build Status
  • Current Landscape code health master: Landscape Code Health
  • Current Travis test status develop: Travis Build Status
  • Current Landscape code health develop: Code Health
  • PyPi Downloads for InaSAFE: PyPI version
  • PyPi Downloads for the old 'safe' library (currently unmaintained): PyPI version
  • Github download: Github All Releases

Quick Installation Guide

You first need to have QGIS installed. Grab your free copy from the QGIS download page.

To install the InaSAFE plugin, use the plugin manager in QGIS:

Plugins โ†’ Manage and Install Plugins

Then search for "InaSAFE", select it and click the install button. The plugin will now be added to your plugins menu.

Note: You may need to restart QGIS if upgrading from a prior version.

Participation

We work under the philosophy that stakeholders should have access to the development and source code, and be able to participate in every level of the project - we invite comments, suggestions and contributions. See our milestones list and our open issues list for known bugs and outstanding tasks. You can also chat live with our developers and community members using the link below.

Join the chat at https://gitter.im/AIFDR/inasafe

System Requirements

  • A standard PC with at least 4GB of RAM running Windows, Linux or Mac OS X
  • The QGIS Open Source Geographic Information System (http://www.qgis.org). Although InaSAFE will probably run on any version of QGIS version above 2.0 or newer, our supported version is the latest Long Term Release version of QGIS.

Running tests

  • InaSAFE is using the Unittest Python framework.
  • Different ways that you can run tests:
    • On Travis using a Pull Request
    • In QGIS Desktop if you enable developer mode in Plugins -> InaSAFE -> Options -> Advanced, restart QGIS and then click the run tests button.
    • Using docker make docker-test
    • Using PyCharm if you set up the dev environment with the qgis_prefix_path

History

  • In March 2011, Risk In A Box (the predecessor to InaSAFE) was built as a web application running as a GeoNode Plugin.
  • InaSAFE development as a QGIS plugin started in January 2012.
  • In October 2012, version 1.0 of InaSAFE was launched at the 5th Asian ministerial conference on disaster risk reduction (AMCDRR) where it was demonstrated to the then president of Indonesia, Susilo Bambang Yudhoyono who praised the project.
  • On 30 Jan 2013, InaSAFE was awarded the prestigious Black Duck Open Source Rookie of the Year Award.
  • Version 2.0 of InaSAFE was released in January, 2014.
  • Version 3.0 was released in March 2015 which added support for using the QGIS API within impact functions.
  • Version 4.0 was released in March 2017.
  • Version 5.0 was released in November 2018 which add support for QGIS 3.x

Disclaimer

InaSAFE has been jointly developed by the Indonesian Government-BNPB, the Australian Government, the World Bank-GFDRR and independent contributors. These agencies and the individual software developers of InaSAFE take no responsibility for the correctness of outputs from InaSAFE or decisions derived as a consequence.

License

InaSAFE is free software: you can redistribute it and/or modify it under the terms of the GNU General Public License version 3 (GPLv3) as published by the Free Software Foundation.

The full GNU General Public License is available in LICENSE.txt or http://www.gnu.org/licenses/gpl.html

Disclaimer of Warranty (GPLv3)

There is no warranty for the program, to the extent permitted by applicable law. Except when otherwise stated in writing the copyright holders and/or other parties provide the program "as is" without warranty of any kind, either expressed or implied, including, but not limited to, the implied warranties of merchantability and fitness for a particular purpose. The entire risk as to the quality and performance of the program is with you. Should the program prove defective, you assume the cost of all necessary servicing, repair or correction.

Limitation of Liability (GPLv3)

In no event unless required by applicable law or agreed to in writing will any copyright holder, or any other party who modifies and/or conveys the program as permitted above, be liable to you for damages, including any general, special, incidental or consequential damages arising out of the use or inability to use the program (including but not limited to loss of data or data being rendered inaccurate or losses sustained by you or third parties or a failure of the program to operate with any other programs), even if such holder or other party has been advised of the possibility of such damages.

inasafe's People

Stargazers

 avatar  avatar  avatar  avatar  avatar  avatar  avatar  avatar  avatar  avatar  avatar  avatar  avatar  avatar  avatar  avatar  avatar  avatar  avatar  avatar  avatar  avatar  avatar  avatar  avatar  avatar  avatar  avatar  avatar  avatar  avatar  avatar  avatar  avatar  avatar  avatar  avatar  avatar  avatar  avatar  avatar  avatar  avatar  avatar  avatar  avatar  avatar  avatar  avatar  avatar  avatar  avatar  avatar  avatar  avatar  avatar  avatar  avatar  avatar  avatar  avatar  avatar  avatar  avatar  avatar  avatar  avatar  avatar  avatar  avatar  avatar  avatar  avatar  avatar  avatar  avatar  avatar  avatar  avatar  avatar  avatar  avatar  avatar  avatar  avatar  avatar  avatar  avatar  avatar  avatar  avatar  avatar  avatar  avatar  avatar  avatar  avatar  avatar  avatar  avatar

Watchers

 avatar  avatar  avatar  avatar  avatar  avatar  avatar  avatar  avatar  avatar  avatar  avatar  avatar  avatar  avatar  avatar  avatar  avatar  avatar  avatar  avatar  avatar  avatar  avatar  avatar  avatar  avatar  avatar  avatar  avatar  avatar  avatar  avatar  avatar  avatar  avatar  avatar  avatar  avatar  avatar  avatar  avatar  avatar  avatar  avatar  avatar  avatar  avatar  avatar  avatar  avatar  avatar  avatar  avatar

inasafe's Issues

Problem when hazard & exposure data are in different proj to viewport

When trying to do a calculation using the Jakarta Flood Hazard layer and Jakarta Schools (both of which are in Lat/Long - WGS84 +no_defs) but with the rendering in Google Mercator (i.e. Eastings and Northings) the run produces the following error:

"An exception occurred when creating the optimalclipped layer copies: Bounding boxes of hazard data [106.686,-6.373,106.975,-6.080], exposure data [106.691,-6.364,106.971,-6.095] and viewport [11873121.887,-708762.652,11910653.138,-678829.284] did not overlap, so no computation was done. Please make sure you pan to where the data is and that hazard and exposure data overlaps."

On the screen, everything is rendered perfectly.

Could this be related to Issue #44?

Need to add logo(s) and "supported by" text

Ideally want to add a BNPB logo to this plugin.
Would also like to have a text section down the bottom that says "Supported by AusAID and the World Bank"
In a future version it would be great if there was an easy way to customise the logo(s) that are displayed.

gdal_array.so: undefined symbol: _

Can't run on my home computer
The system is Ubuntu 11.04 - 64 and the packages are as installed by our script:

ro@homedesk:$ dpkg -l | grep gdal
ii gdal-bin 1.8.0-2
natty4 Geospatial Data Abstraction Library - Utility programs
ii libgdal1-1.8.0 1.8.0-2natty4 Geospatial Data Abstraction Library
ii python-gdal 1.8.0-2
natty4 Python bindings to the Geospatial Data Abstraction Library
ro@homedesk:$ dpkg -l | grep qgis
ii libqgis1.7.3 1.7.3-1
natty1 Quantum GIS - shared libraries
ii python-qgis 1.7.3-1natty1 Python bindings to Quantum GIS
ii python-qgis-common 1.7.3-1
natty1 Python bindings to Quantum GIS - architecture-independent files
ii qgis 1.7.3-1natty1 Geographic Information System (GIS)
ii qgis-common 1.7.3-1
natty1 Quantum GIS - architecture-independent data
ii qgis-plugin-grass 1.7.3-1natty1 GRASS plugin for Quantum GIS
ii qgis-plugin-grass-common 1.7.3-1
natty1 GRASS plugin for Quantum GIS - architecture-independent data
ii qgis-providers 1.7.3-1natty1 collection of data providers to Quantum GIS
ii qgis-providers-common 1.7.3-1
natty1 collection of data providers to Quantum GIS - architecture-independent files

The engine and storage tests pass individually, but running the entire suite gives errors like this:

ERROR: Test that we can get keyword data from a riab layer with

Traceback (most recent call last):
File "/home/ro/sandpit/risk_in_a_box/gui/test_impactcalculator.py", line 144, in test_getKeywordFromLayer
myImpactLayer, 'caption')
File "/home/ro/sandpit/risk_in_a_box/gui/impactcalculator.py", line 196, in getKeywordFromLayer
raise InvalidParameterException()
InvalidParameterException:
-------------------- >> begin captured stdout << ---------------------
Calculation error encountered:

Problem: /usr/lib/python2.7/dist-packages/osgeo/_gdal_array.so: undefined symbol: _ZNK15GDALMajorObject14GetDescriptionEv
Traceback:
  File "/home/ro/sandpit/risk_in_a_box/gui/impactcalculator.py", line 455, in run
    impact_fcn=self._function)
  File "/home/ro/sandpit/risk_in_a_box/engine/core.py", line 52, in calculate_impact
    check_data_integrity(layers)
  File "/home/ro/sandpit/risk_in_a_box/engine/core.py", line 198, in check_data_integrity
    data = layer.get_data()
  File "/home/ro/sandpit/risk_in_a_box/storage/raster.py", line 340, in get_data
    A = self.band.ReadAsArray()
  File "/usr/lib/python2.7/dist-packages/osgeo/gdal.py", line 1027, in ReadAsArray
    import gdalnumeric
  File "/usr/lib/python2.7/dist-packages/osgeo/gdalnumeric.py", line 1, in 
    from gdal_array import *
  File "/usr/lib/python2.7/dist-packages/osgeo/gdal_array.py", line 25, in 
    _gdal_array = swig_import_helper()
  File "/usr/lib/python2.7/dist-packages/osgeo/gdal_array.py", line 21, in swig_import_helper
    _mod = imp.load_module('_gdal_array', fp, pathname, description)

--------------------- >> end captured stdout << ----------------------

Enable Padang unit test

Disabled test after reimplementing CDF.
However, I am unconvinced it was correct to start with and have asked the experts how the fragility curve should be calculated.

Sort out the PATH issues

Requirements

  • The tool needs to deploy as a QGIS plugin without any system tinkering
  • The development environment needs to work, but OK to e.g. set PYTHONPATH to use absolute load paths in imports
  • Ole does not like the current system of files with pathnames in them :-)

Ignore division by zero in engine

From Python 2.7, numpy is producing annoying warnings ilke

Warning: divide by zero encountered in log
Warning: invalid value encountered in multiply
..............Warning: invalid value encountered in divide
Warning: invalid value encountered in divide

As these result in NaN values as planned I suggest we suppress them using numpy.seterr:
np.seterr(divide='ignore') # Or possibly np.seterr(invalid='ignore')

See e.g.http://stackoverflow.com/questions/5556919/fixing-the-singularity-of-a-function

We need developer documentation

We need enough documentation that new developers can understand:

  • how to install the software
  • how to set up a development environment for the software
  • how to run unit tests
  • how to update and generate translations
  • coding practices and standards
  • general description of code layout
  • procedures for adding new functions and functionality

Do we really need scipy?

I did some reading up on scipy and it seems it will cause some issues for us because to install it you need to compile various python - c modules and it isnt shipped with QGIS by default. Can we investigate how much it is used and if possibly port the functions over to our native lib?

Regards

Tim

Import existing RIAB code and make it available in sys.path

The riab calculator, io, etc. code needs to be imported into the new QGIS plugin repo.

The code should be arranged in the following modules:

  • io
  • impact_functions
  • engine

Tim so also move gui code into a gui module (reassign the ticket to me when you are ready for that).

Automatically produce report quality 1-page summaries of results

We need to be able to automatically produce 1-page summaries of outputs. I'm envisaging that when we do a run we would automatically produce a page that has a:

  • map of the results;
  • paragraph of text that outlines what has been done; and
  • a table of key results.

Ideally, if we do a batch run (issue #21), these outputs should be produced for each of the runs automatically and combined into a single document that represents a scenario report.

Need to have the plugin open as a docked panel with minimal QGIS toolbars visible

We need to create a default view of QGIS such that when we open it the RIAB panel is docked and prominent. We would then want to see most of the QGIS toolbars turned off so that they are not visible.
The idea here is to make he tool look as clean, obvious and simple as the online version. This means that the user should immediately see the tool and should be obvious what they need to do to do an analysis.

Identify input data owner/source at bottom of output text

When a calculation is finished, it would be good if we were able to inconspicuously list the input datasets (don't worry about the impact function) and their owners in the output text field. Conscious this means adding that information to the metadata of the input datasets in a form that allows the information to be accessed from within the calculator - no idea how to actually do this.

The functionality I am trying to get to is to make it easy to identify the owners of the inputs that have been used to derive the output data. It would be excellent to carry this information over into the metadata of the output dataset and to make it visible so that if someone sees the results and wants to know about the source of the input layers (a common question whenever we demonstrate this functionality) it is easy to answer.

Maybe something that can be handled through the keyword system?

We need to be able to produce csv's of output data

Once a run has completed, we need to be able to automatically produce csv files of output tables. These tables may include calculated parameters. For example, once we have estimated the number of people who will be seriously impacted we will need to apply calculations from BNPB's PERKA 7/2008. This allows us to calculate the:

  • amount of rice in kg's
  • amount of drinking water
  • number of family kits
  • number of toilets
  • amount of cleaning water

THese results need to be automatically created and stored in a table that is easily accessed.

Move to the "If ... How Many ... Will Be ..." framework

The most recent RIAB framework has replaced the use of Hazard, Exposure, Impact with a model where we essentially build a question. The layers are the same, however the labels are:
if ..
how many ...
will be ...

This has the appearance of a question and is a far more intuitive way of explaining what we are doing to non-experts. An example from the Jakarta Flood Contingency Planning work is:
If "there is a flood like 2007"
how many "schools"
will be "temporarily closed"

I think this will be along-term framework and worth getting it implemented as soon as possible.

Test broken

Running the test today creates a segfault error on my system (Ubuntu 11.04, 64 bit)

nielso@shakti:~/.qgis/python/plugins/risk_in_a_box$ python riabdialogtest.py 
.Failed to load 
F
======================================================================
FAIL: test_loadLayers (__main__.RiabDialogTest)
Load some layers in the canvas, call load layers
----------------------------------------------------------------------
Traceback (most recent call last):
  File "riabdialogtest.py", line 86, in test_loadLayers
    assert myVectorLayer.isValid()
AssertionError

----------------------------------------------------------------------
Ran 2 tests in 0.217s

FAILED (failures=1)
Segmentation fault

Add details on QGIS version and platform compatibility to readme

I cloned the repository to my OS Lion Mac - absolute breeze, however I get a "incompatible" tag against the plugin from my plugin manager.

I am not suggesting that we need to make the plugin work against my build (although I have got the details of by QGIS below). Nor am I suggesting we should have this work for Macs (yet :) ).

However, it would be good if we could articulate what build and, if relevant, platforms we do currently work against in the documentation (or ideally the readme).

I want to emphasise though, the current installation for the development is soooo easy - it was great.

My versions according to the QGIS "about QGIS"
QGIS version 1.7.2-Wroclaw built against code revision
GDAL/OGR Version 1.8.1
PostgreSQL Client Version 9.1.1
SpatialLite Version 2.4.0
QWT Version 5.2.1
Compiled against Qt 4.7.4 and is currently running against Qt 4.7.4

Ability to work with remote data

We need to be able to easily use remote data by fetching it dynamically as needed.

  • open streetmap (through e.g. PostGIS mirror)
  • WFS
  • WCS

Add a meaningful progress bar for calculations

It would be good if when a calculation is running there was progress bar that accurately reflected how far through the process we were. This would allow the user to:

  • know something was still happening when a long calculation is happening; and
  • provide a sense of how far through the process we are.

The idea would be a simple animated progress bar that somehow knew how far through the process we actually were. It may be worth having one for each discrete section of the analysis (i.e. loading data, analysis, saving data) although I'm inclined to have something that is for the entire process.

UI internationalisation

The plugin should be internationalised so that it can be displayed in different languages.

Need to add the details of the calculation into output data's metadata

Having a quick look at the output from our current analysis I can't immediately see any information attached to the file that tells me how it was created.
Would be excellent if this could be stored in the output data's metadata automatically so that there is a history of creation attached to the file.

Add simple clip line (eg. roads) by hazard threshold impact function

We need to have the ability to intersect (clip) roads by a thresholded value from our hazard layer. For example:
"identify all roads that are in greater than X m of water".

A more advanced functionally might tag line segments with the hazard layer that they are in, however this is probably a separate ticket. For now, all we need to be able to do is set a threshold (say 30 cm) of water that will make a road impassable - hence ditutup sementara.

Recommend Projects

  • React photo React

    A declarative, efficient, and flexible JavaScript library for building user interfaces.

  • Vue.js photo Vue.js

    ๐Ÿ–– Vue.js is a progressive, incrementally-adoptable JavaScript framework for building UI on the web.

  • Typescript photo Typescript

    TypeScript is a superset of JavaScript that compiles to clean JavaScript output.

  • TensorFlow photo TensorFlow

    An Open Source Machine Learning Framework for Everyone

  • Django photo Django

    The Web framework for perfectionists with deadlines.

  • D3 photo D3

    Bring data to life with SVG, Canvas and HTML. ๐Ÿ“Š๐Ÿ“ˆ๐ŸŽ‰

Recommend Topics

  • javascript

    JavaScript (JS) is a lightweight interpreted programming language with first-class functions.

  • web

    Some thing interesting about web. New door for the world.

  • server

    A server is a program made to process requests and deliver data to clients.

  • Machine learning

    Machine learning is a way of modeling and interpreting data that allows a piece of software to respond intelligently.

  • Game

    Some thing interesting about game, make everyone happy.

Recommend Org

  • Facebook photo Facebook

    We are working to build community through open source technology. NB: members must have two-factor auth.

  • Microsoft photo Microsoft

    Open source projects and samples from Microsoft.

  • Google photo Google

    Google โค๏ธ Open Source for everyone.

  • D3 photo D3

    Data-Driven Documents codes.