This data visualization is the result of a data sprint held at Dagbladet Information on November 27th, 2013. This code can be used to create your own zoomable sunburst diagrams based on available budget figures. An updated version of the visualization is available on Databloggen.
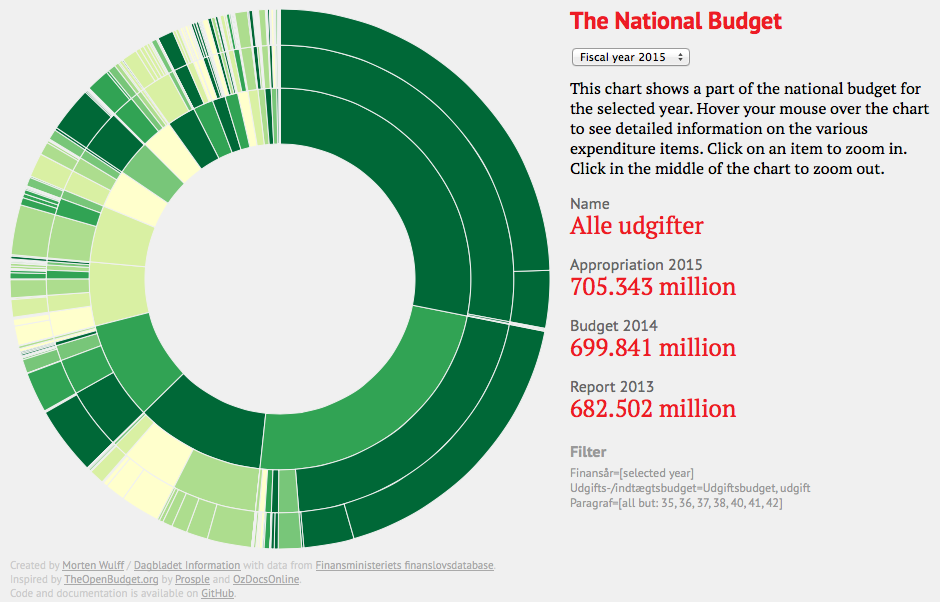
This interactive graph lets you explore the national budget from 2003 to 2015 using a zoomable sunburst diagram.
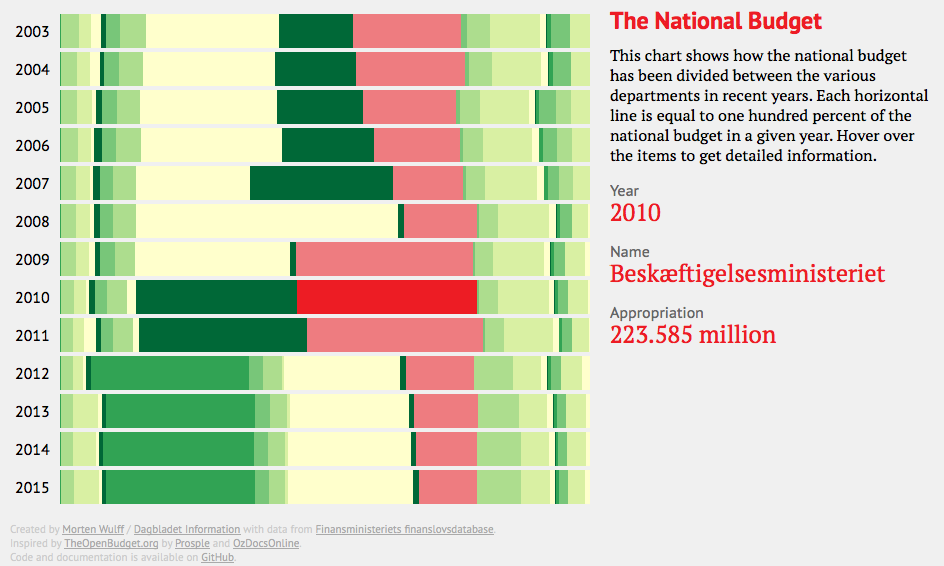
This interactive graph lets you explore the national budget from 2003 to 2015 using a stacked bar chart.
All data is available from Finansministeriets Finanslovsdatabase.
To get data at a reasonable detail level, you will have to modify the report structure and add a couple of filters. First, let's modify the report structure:
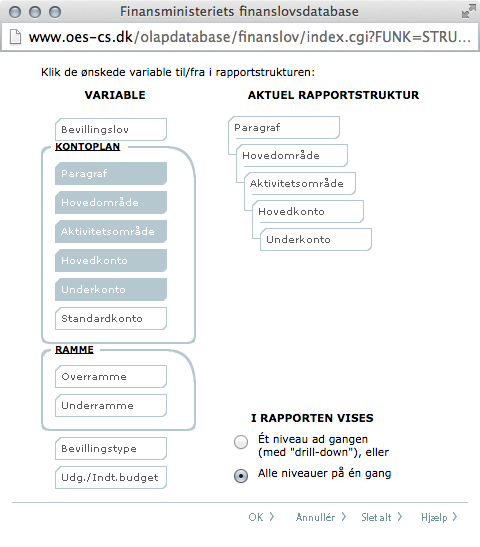
- Click Vælg struktur to open the structure popup
- Under Kontoplan click Standardkonto to remove it from the report
- Under I rapporten vises select Alle niveauer på én gang to disable the drill-down mechanism
- Click OK to apply the new structure
Then, add a couple of filters:
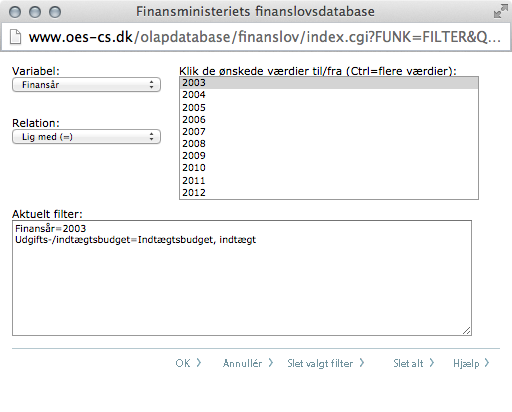
- Click Vælg filter to open the filter popup
- Under Variabel select Finansår and then select the year(s) you're interested in from the select list on the right
- Under Variabel select Udgifts-/indtægtsbudget and select Indtægtsbudget, indtægt if you're interested in revenue or Udgiftsbudget, udgift if you're interested in expense
- Click OK to apply the filters
When you're happy with the structure and filtering of the data you can click the Download button to get a copy of the report in CSV format.
The files in the revenues folder have been created using the following filters:
Finansår=20xx
Udgifts-/indtægtsbudget=Indtægtsbudget, indtægt
The files in the expenses folder have been created using the following filters:
Finansår=20xx
Paragraf=[01-29]
Udgifts-/indtægtsbudget=Udgiftsbudget, udgift
The expense data files named *-all.csv omit the Paragraf filter.
For more information on the account numbers, please consult the chart of accounts (help index).
To test locally, you can use the following command to run a static HTTP server on your local machine:
python -m SimpleHTTPServer 8000
Based on the Zoomable Sunburst and Normalized Stacked Bar Chart diagrams by Mike Bostock.