With the OpenSearch Grafana data source plugin, you can run many types of simple or complex OpenSearch queries to visualize logs or metrics stored in OpenSearch. You can also annotate your graphs with log events stored in OpenSearch. The OpenSearch Grafana data source plugin uses Piped Processing Language (PPL) and also supports AWS Sigv4 authentication for Amazon OpenSearch Service.
- Install the data source by following the instructions in the Installation tab of this plugin's listing page.
- Open the side menu by clicking the Grafana icon in the top header.
- In the side menu under the
Dashboardslink you should find a link namedData Sources. - Click the
+ Add data sourcebutton in the top header. - Select OpenSearch from the Type dropdown.
Note: If you're not seeing the
Data Sourceslink in your side menu it means that you do not have theAdminrole for the current organization.
| Name | Description |
|---|---|
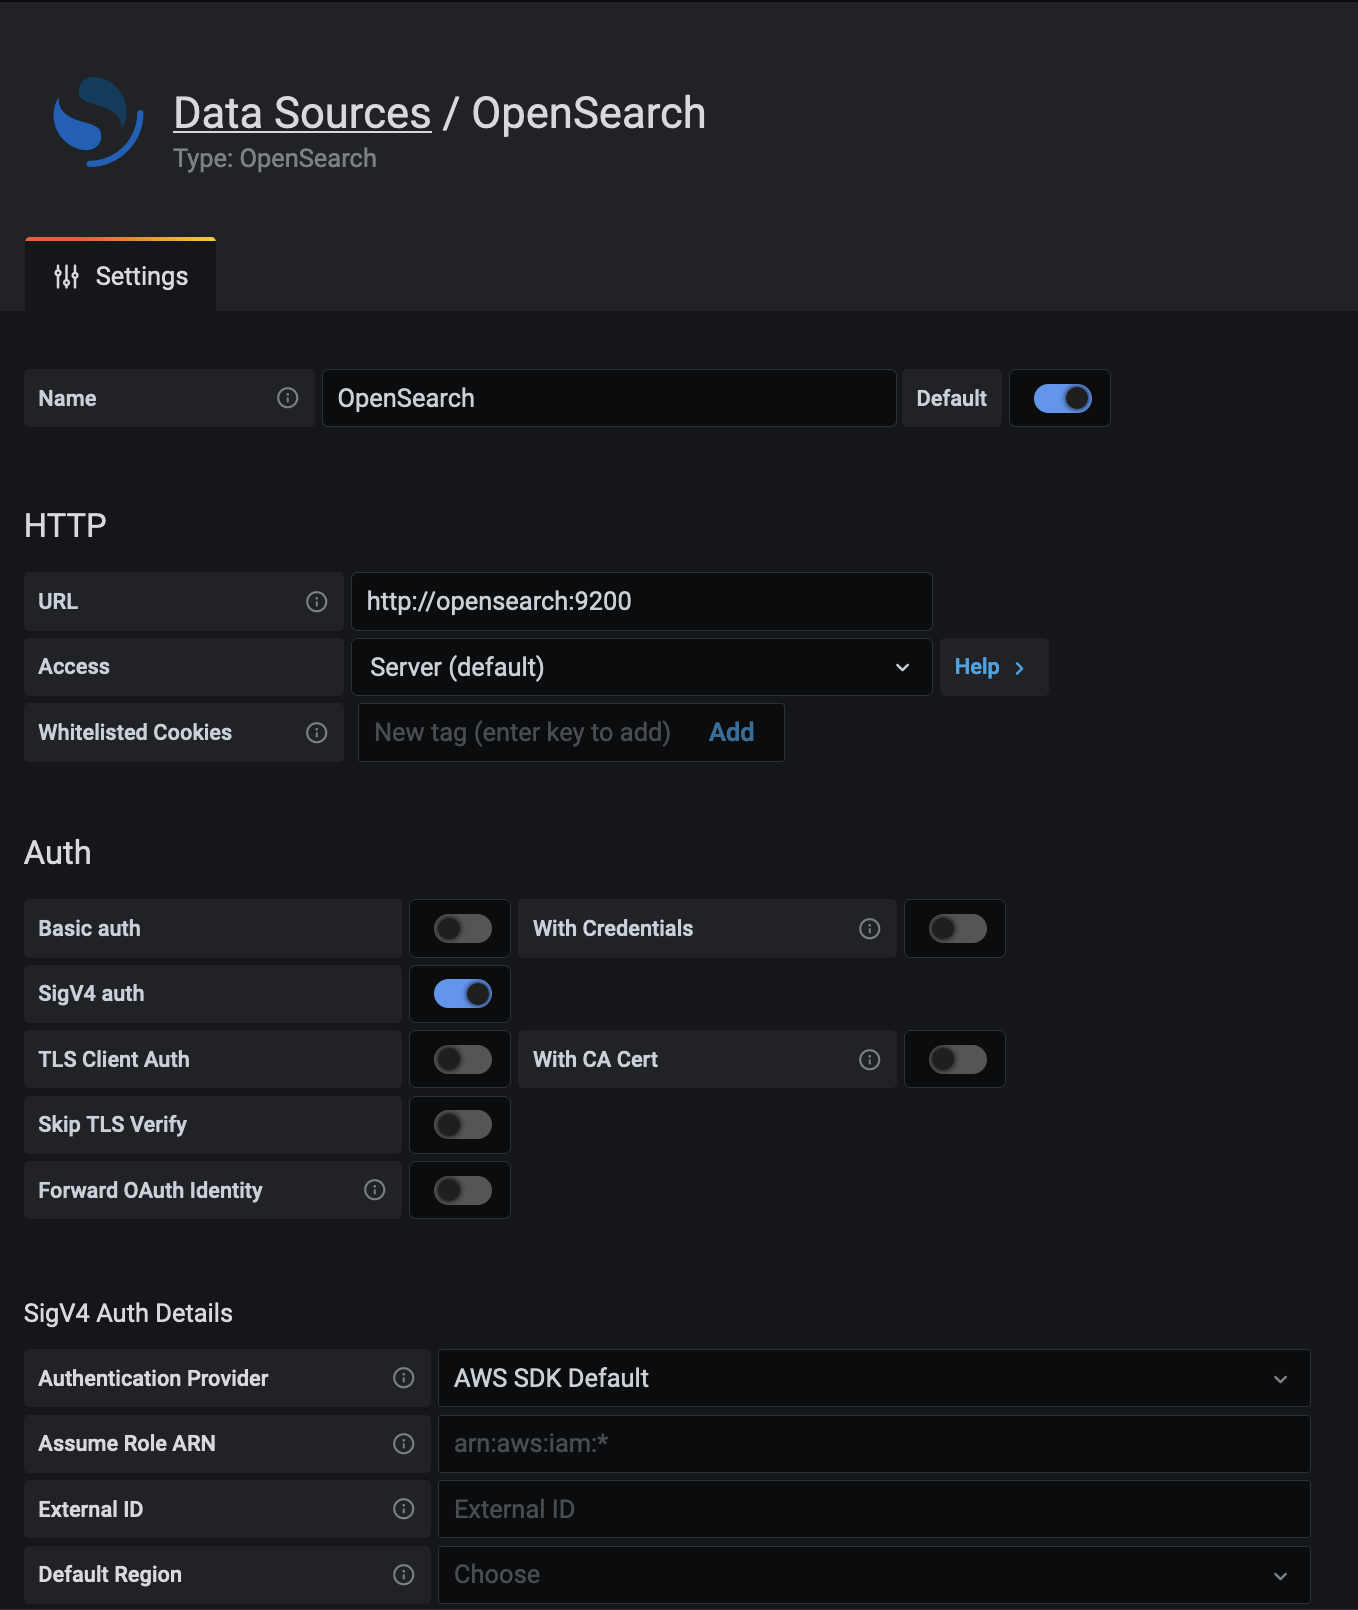
Name |
The data source name. This is how you refer to the data source in panels and queries. |
Default |
Default data source means that it will be pre-selected for new panels. |
Url |
The HTTP protocol, IP, and port of your OpenSearch server. |
Access |
Server (default) = URL needs to be accessible from the Grafana backend/server, Browser = URL needs to be accessible from the browser. |
Access mode controls how requests to the data source will be handled. Server should be the preferred way if nothing else stated.
All requests will be made from the browser to Grafana backend/server which in turn will forward the requests to the data source and by that circumvent possible Cross-Origin Resource Sharing (CORS) requirements. The URL needs to be accessible from the grafana backend/server if you select this access mode.
Warning: Browser (Direct) access is deprecated and will be removed in a future release.
All requests will be made from the browser directly to the data source and may be subject to Cross-Origin Resource Sharing (CORS) requirements. The URL needs to be accessible from the browser if you select this access mode.
If you select Browser access you must update your OpenSearch configuration to allow other domains to access OpenSearch from the browser. You do this by specifying these two options in your opensearch.yml config file.
http.cors.enabled: true
http.cors.allow-origin: "*"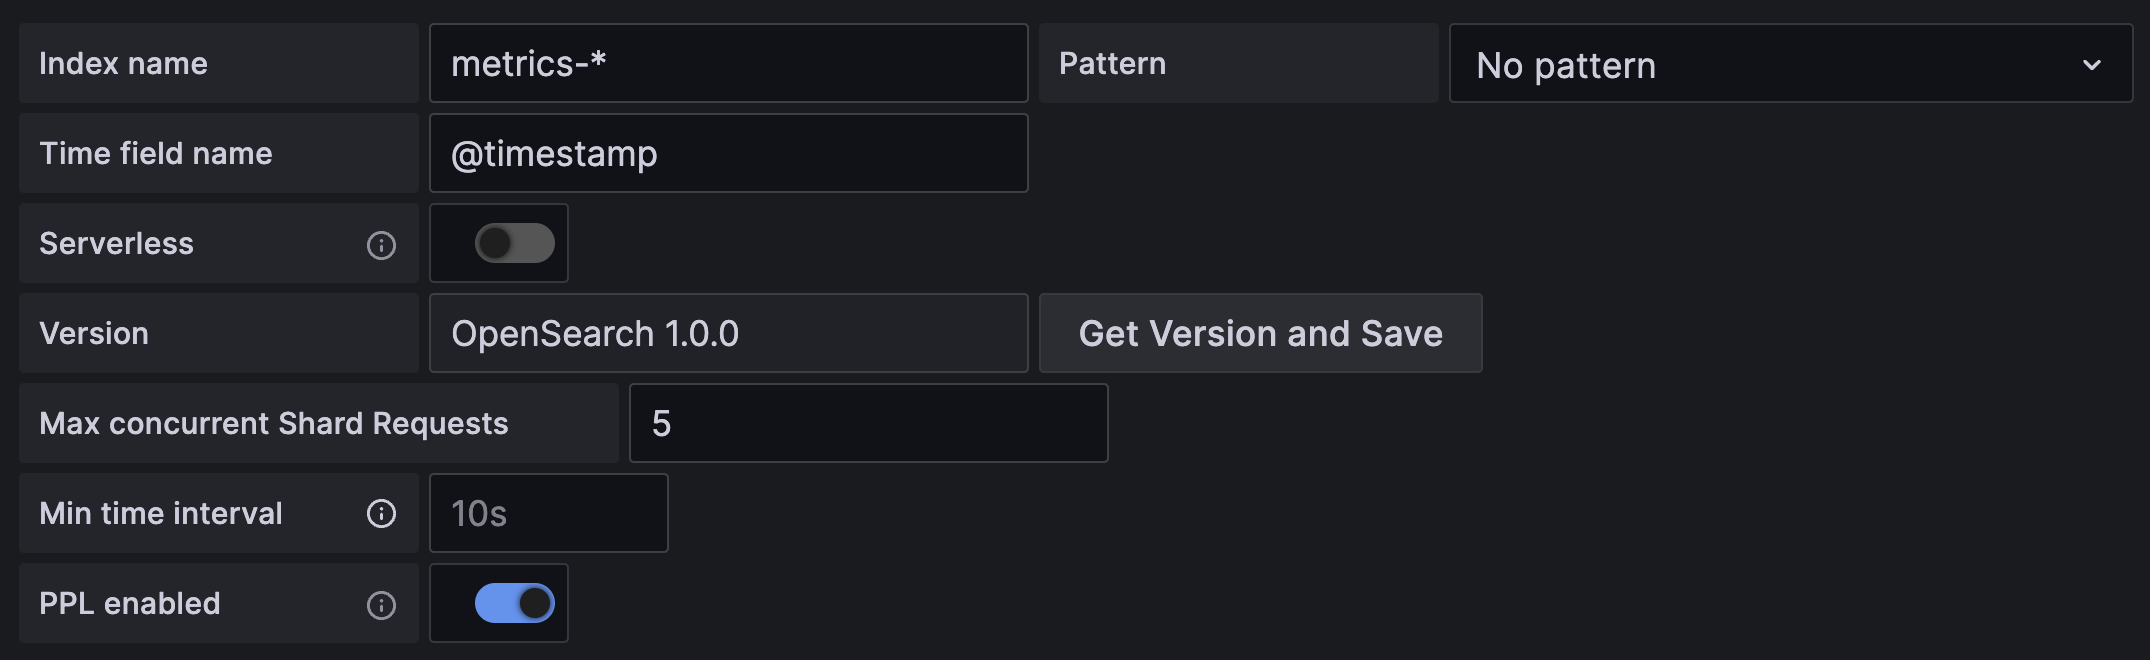
Here you can specify a default for the time field and specify the name of your OpenSearch index. You can use
a time pattern for the index name or a wildcard.
Be sure to specify your OpenSearch version in the version selection dropdown. This is very important as there are differences on how queries are composed.
A lower limit for the auto group by time interval. Recommended to be set to write frequency, for example 1m if your data is written every minute.
This option can also be overridden/configured in a dashboard panel under data source options. It's important to note that this value needs to be formatted as a
number followed by a valid time identifier, e.g. 1m (1 minute) or 30s (30 seconds). The following time identifiers are supported:
| Identifier | Description |
|---|---|
y |
year |
M |
month |
w |
week |
d |
day |
h |
hour |
m |
minute |
s |
second |
ms |
millisecond |
Only available in Grafana v6.3+.
There are two parameters, Message field name and Level field name, that can optionally be configured from the data source settings page that determine
which fields will be used for log messages and log levels when visualizing logs in Explore.
For example, if you're using a default setup of Filebeat for shipping logs to OpenSearch the following configuration should work:
- Message field name: message
- Level field name: fields.level
Data links create a link from a specified field that can be accessed in logs view in Explore.
Each data link configuration consists of:
- Field - Name of the field used by the data link.
- URL/query - If the link is external, then enter the full link URL. If the link is internal link, then this input serves as query for the target data source. In both cases, you can interpolate the value from the field with
${__value.raw }macro. - Internal link - Select if the link is internal or external. In case of internal link, a data source selector allows you to select the target data source. Only tracing data sources are supported.
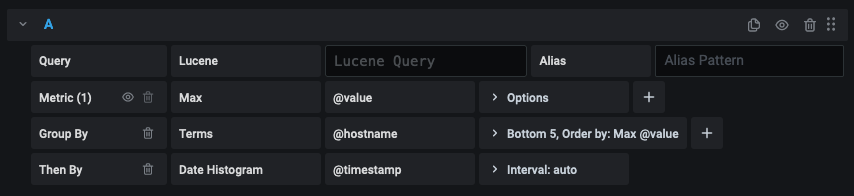
The OpenSearch query editor allows you to select multiple metrics and group by multiple terms or filters. Use the plus and minus icons to the right to add/remove metrics or group by clauses. Some metrics and group by clauses haves options, click the option text to expand the row to view and edit metric or group by options.
You can control the name for time series via the Alias input field.
| Pattern | Description |
|---|---|
{{term fieldname}} |
replaced with value of a term group by |
{{metric}} |
replaced with metric name (ex. Average, Min, Max) |
{{field}} |
replaced with the metric field name |
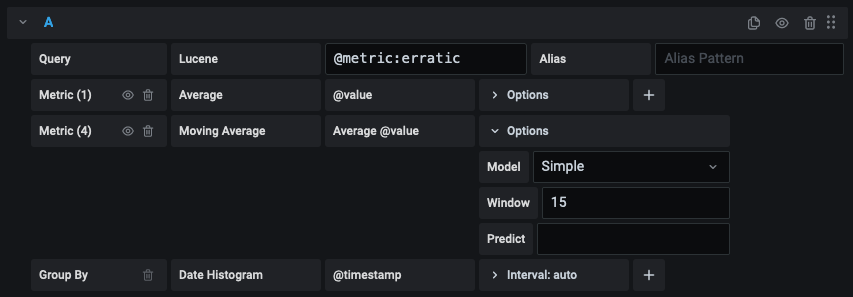
Some metric aggregations are called Pipeline aggregations, for example, Moving Average and Derivative. OpenSearch pipeline metrics require another metric to be based on. Use the eye icon next to the metric to hide metrics from appearing in the graph. This is useful for metrics you only have in the query for use in a pipeline metric.
Instead of hard-coding things like server, application and sensor name in your metric queries you can use variables in their place. Variables are shown as dropdown select boxes at the top of the dashboard. These dropdowns make it easy to change the data being displayed in your dashboard.
Check out the Templating documentation for an introduction to the templating feature and the different types of template variables.
The OpenSearch data source supports two types of queries you can use in the Query field of Query variables. The query is written using a custom JSON string.
| Query | Description |
|---|---|
{"find": "fields", "type": "keyword"} |
Returns a list of field names with the index type keyword. |
{"find": "terms", "field": "@hostname", "size": 1000} |
Returns a list of values for a field using term aggregation. Query will use current dashboard time range as time range for query. |
{"find": "terms", "field": "@hostname", "query": '<lucene query>'} |
Returns a list of values for a field using term aggregation and a specified lucene query filter. Query will use current dashboard time range as time range for query. |
There is a default size limit of 500 on terms queries. Set the size property in your query to set a custom limit.
You can use other variables inside the query. Example query definition for a variable named $host.
{"find": "terms", "field": "@hostname", "query": "@source:$source"}
In the above example, we use another variable named $source inside the query definition. Whenever you change, via the dropdown, the current value of the $source variable, it will trigger an update of the $host variable so it now only contains hostnames filtered by in this case the
@source document property.
These queries by default return results in term order (which can then be sorted alphabetically or numerically as for any variable).
To produce a list of terms sorted by doc count (a top-N values list), add an orderBy property of "doc_count".
This automatically selects a descending sort; using "asc" with doc_count (a bottom-N list) can be done by setting order: "asc" but is discouraged as it "increases the error on document counts".
To keep terms in the doc count order, set the variable's Sort dropdown to Disabled; you might alternatively still want to use e.g. Alphabetical to re-sort them.
{"find": "terms", "field": "@hostname", "orderBy": "doc_count"}
There are two syntaxes:
$<varname>Example: @hostname:$hostname[[varname]]Example: @hostname:[[hostname]]
Why two ways? The first syntax is easier to read and write but does not allow you to use a variable in the middle of a word. When the Multi-value or Include all value options are enabled, Grafana converts the labels from plain text to a lucene compatible condition.
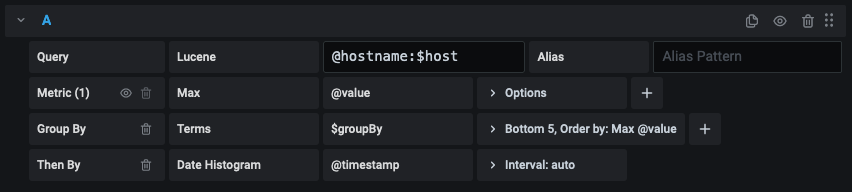
In the above example, we have a lucene query that filters documents based on the @hostname property using a variable named $hostname. It is also using
a variable in the Terms group by field input box. This allows you to use a variable to quickly change how the data is grouped.
Annotations allow you to overlay rich event information on top of graphs. You add annotation queries via the Dashboard menu / Annotations view. Grafana can query any OpenSearch index for annotation events.
| Name | Description |
|---|---|
Query |
You can leave the search query blank or specify a lucene query. |
Time |
The name of the time field, needs to be date field. |
Time End |
Optional name of the time end field needs to be date field. If set, then annotations will be marked as a region between time and time-end. |
Text |
Event description field. |
Tags |
Optional field name to use for event tags (can be an array or a CSV string). |
Querying and displaying log data from OpenSearch is available in Explore, and in the logs panel in dashboards. Select the OpenSearch data source, and then optionally enter a lucene query to display your logs.
The OpenSearch plugin allows you to run queries using PPL. For more information on PPL syntax, refer to the OpenSearch documentation.
Once the result is returned, the log panel shows a list of log rows and a bar chart where the x-axis shows the time and the y-axis shows the frequency/count.
Note that the fields used for log message and level is based on an optional data source configuration.
Optionally enter a lucene query into the query field to filter the log messages. For example, using a default Filebeat setup you should be able to use fields.level:error to only show error log messages.
It's now possible to configure data sources using config files with Grafana's provisioning system. You can read more about how it works and all the settings you can set for data sources on the provisioning docs page
Here are some provisioning examples for this data source.
apiVersion: 1

datasources:
  - name: OpenSearch
    type: grafana-opensearch-datasource
    access: proxy
    database: '[metrics-]YYYY.MM.DD'
    url: http://localhost:9200
    jsonData:
      interval: Daily
      timeField: '@timestamp'
      version: '1.0.0'
      flavor: 'opensearch'
or, for logs:
apiVersion: 1

datasources:
  - name: elasticsearch-v7-filebeat
    type: grafana-opensearch-datasource
    access: proxy
    database: '[filebeat-]YYYY.MM.DD'
    url: http://localhost:9200
    jsonData:
      interval: Daily
      timeField: '@timestamp'
      version: '7.0.0'
      flavor: 'elasticsearch'
      logMessageField: message
      logLevelField: fields.level
PPL support can be disabled using:
jsonData:
pplEnabled: falseAWS users using Amazon's Elasticsearch Service can use this data source to visualize Elasticsearch data. If you are using an AWS Identity and Access Management (IAM) policy to control access to your Amazon Elasticsearch Service domain, then you must use AWS Signature Version 4 (AWS SigV4) to sign all requests to that domain. For more details on AWS SigV4, refer to the AWS documentation.
Note: Only available in Grafana v7.3+.
In order to sign requests to your Amazon Elasticsearch Service domain, SigV4 can be enabled in the Grafana configuration.
Once AWS SigV4 is enabled, it can be configured on the Elasticsearch data source configuration page. Refer to Cloudwatch authentication for more information about authentication options.