PyDWDApi is a simple HTTP REST server which allows interpolated access to weather data made available by the German Weather Service (Deutscher Wetterdienst, DWD). Only yields sane results for locations within Germany.
This program requires Python 3, including the Python packages numpy, scipy
and optionally matplotlib. You will also need a free GDS-FTP account which you
can request here (note that account activation may take up to an hour).
The HTTP server can be started using the following command line:
./serve.py <DWD FTP USER> <DWD FTP PASSWORD> <HTTP PORT>Where the <DWD FTP USER> and <DWD FTP PASSWORD> are your GDS-FTP account
data. Note that the HTTP server will only listen on localhost. If you intend to
publish the service on the internet, you should consider using a reverse proxy
such as nginx.
You can now query the weather data from HTTP using the following URL:
http://localhost:<PORT>/api/1.0/weather?lat=<LATITUDE>&lon=<LONGITUDE>&alt=<ALTITUDE>
The parameters have the following meaning:
lat: Latitude in degreeslon: Longitude in degreesalt: Altitude in meters above sea level -- if not given, the altitude will be read from the local altitude map.
An example result might be the following (some keys may not be available at all times):
{
  "coord": {
    "alt": 89.0, // Altitude in meters above sea level
    "lat": 50.0, // Latitude
    "lon": 8.27 // Longitude
  },
  "dt": 1469663046.0, // Timestamp of the latest data incorporated in the result
  "main": {
    "humidity": 80.14, // Humidity in percent
    "precipitation": 0.0, // Precipitation in mm/m^2 in one hour
    "pressure": 1017.67, // Pressure in hPa
    "temp": 18.05 // Current temperature in degrees Celsius
  },
  "wind": {
    "deg": 63.23, // Wind direction
    "max": 2.0, // Maximum wind speed in m/s (in 10 min)
    "speed": 1.51 // Speed in m/s (avg. over 10 min)
  }
}An instance of the server is publicly available at
https://somweyr.de/pydwdapi/api/1.0/weather?lat=<LATITUDE>&lon=<LONGITUDE>&alt=<ALTITUDE>
Please use this URL for testing purposes only.
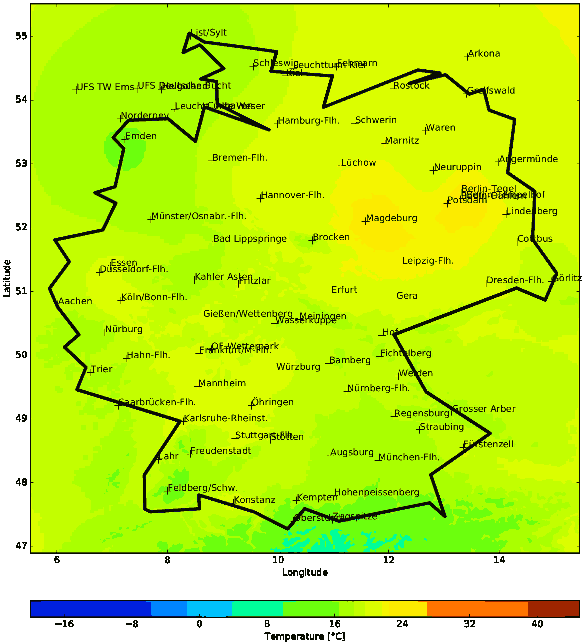
Plotting maps requires an installation of matplotlib for Python 3. You can
invoke the map plotter with the following command:
./render.py <DWD FTP USER> <DWD FTP PASSWORD> <MODALITY>As above, <DWD FTP USER> and <DWD FTP PASSWORD> are your GDS-FTP account
data. The <MODALITY> argument can be one of the following:
temperatureprecipitationpressurehumiditywind_speedwind_direction
The rendered map will be stored as <MODALITY>.pdf in the current working
directory. The necessary computations will take some time -- if you're in
a hurry, you can reduce the map resolution by passing a smaller value for
the resolution parameter to the api.render_map call (try 128 or 64 instead
of the default of 256).
The program is extremely simple. When a request is received, it downloads the
newest station data for Germany and Europe from the DWD GDS FTP server. The
individual observations are stored in a local database. The accumulated, most
recent data for each station is used. New data is only queried from the server
after some time has passed (30 minutes for the German dataset, 3 hours for the
European dataset, see data/sources.xml).
The stations are then associated with their coordinates using a hand-crafted
table (see data/stations.xml). The resulting compound data is stored in a
NumPy structured array.
The individual modalities are interpolated for the given coordinate triple using the SciPy radial basis function interpolator. A non-euclidean norm is used to make sure that a geodesic distance is used for the station-to-station distance.
Furthermore a higher weight is used for altitudinal differences, as these have a potentially higher impact on weather data. E.g. temperature data from the Zugspitze from 2900 meter above sealevel (where it is quite cold most of the time) would influence the data in the entirety of south Germany if the altitude dimension would not be scaled correctly in the underlying metric.
This project is not yet fully finished. The following features are planned:
- Interpolation of the general weather status code (clear, cloudy, rain, ...)
- Prettier map generation
- Make sure response JSON is compatible with
openweathermap - Perform some cross-validation experiments
This project was a little Sunday afternoon fun project. Do not use the resulting data for any serious application. Interpolation between sparse weather station data may go terribly wrong. This program is in no way affiliated with or endorsed by the DWD.
The included altitude data for Germany was downloaded from the National Oceanic
and Atmospheric Administration (NOAA) of the National Centers for Environmental
Information. You can download your own data from
here. Make sure to select the
ETIOI1 (ice) layer and ArcGIS ASCII Grid as output format.
Simple REST HTTP Weather Server using DWD weather data for Germany
Copyright (C) 2016 Andreas Stöckel

This program is free software: you can redistribute it and/or modify
it under the terms of the GNU Affero General Public License as published by
the Free Software Foundation, either version 3 of the License, or
(at your option) any later version.

This program is distributed in the hope that it will be useful,
but WITHOUT ANY WARRANTY; without even the implied warranty of
MERCHANTABILITY or FITNESS FOR A PARTICULAR PURPOSE.  See the
GNU Affero General Public License for more details.

You should have received a copy of the GNU Affero General Public License
along with this program.  If not, see <http://www.gnu.org/licenses/>.


