jenkinsci / dashboard-view-plugin Goto Github PK
View Code? Open in Web Editor NEWJenkins dashboard-view plugin
Home Page: https://plugins.jenkins.io/dashboard-view/
License: MIT License
Jenkins dashboard-view plugin
Home Page: https://plugins.jenkins.io/dashboard-view/
License: MIT License


![dependabot[bot] avatar](https://avatars.githubusercontent.com/in/29110?v=4 "dependabot[bot]")


Currently the build statistics aggregate the numbers from the last ten builds of each job. But I would like to see only the "current" stats - it doesn't matter to be if a build had a different state before. If the max number of builds could be configured to e.g. "1" that would enable this use case.
The TestStatisticsGrid could support categorization by regex the same way or by incorporating/reusing the Categorized Job View plugin. In the attached screenshots there are just a few sample projects created with the typical post-fix classification. But when project lists are long, grouping is helpful.
I envision that categorization of the TestStatisticsGrid might be by:
I'd like to do some external reporting of our jobs.
Therefore, i would fetch the current results of a Hudson page on a weekly basis, to get my values.
Whilst HTML parsing would probably work, i kindly ask if it could be simplier by adding some "xml export" of the values of the portlets (eg warnings per project, ...)
Currently the test trend chart will interpolate results, using the most recent result it can find, smeared out up until the current day.
We run tests every night, and it would be good if the test trend chart correctly shows when the run did not work. Currently, if our test suite doesn't run, the the test trend chart makes it look like everything is identical to yesterday, when in fact, it isn't.
Perhaps there could be some setting somewhere to allow you to choose between the two behaviours:
1) The test trend chart will display the most recent result for each day until there is a new result. (current behaviour)
2) the test trend chart will show the actual result of each day. If there is no result for a given day, then the test trend chart will read zero for that day.
I know there is a drop down plugin. that is not what I am looking for, as it, in my opinion, it decreases visibility
What I think would be better is to have either one of
A. jenkins configuration, # of dashboard rows, views are split either alphabetically, and based on string length of names across available rows [crude but simple?]
B. per view configuration, indicate what row # the view should be on [possibly more complex, but more elegant?]
CONOPS. large code base, multiple branches, multiple developers, multiple features
with ~30 views in the dashboard in one row its unwieldy. 10 views per row over 3 row (maybe an extra row for default 'all' view might work much better in this scenario....
e.g.
have one row with all feature filtered jobs
have one row with all branch filtered jobs
have one row with all developer filtered jobs
this way feature lead can oversee changes regardless of branch/developer who touched
this way branch/release lead can oversee all changes regardless of developer/feature impacted
this way developer can oversee all changes regardless of thread/feature
I'm using the Dashboard View plugin and using the "latest builds" view. The system that Jenkins runs on has its clock set to UTC, but I have the Jenkins timezone set to PST. On all the native Jenkins pages, such as job build history, I see timestamps in PST. In the "latest builds" view the times are all UTC.
I set the timezone for Jenkins by running it like this on the command line: java -Dorg.apache.commons.jelly.tags.fmt.timeZone=America/Los_Angeles -jar jenkins.war
Is it possible to decorate (background color?) the name of the dashboard view based on the status of the jobs within?
CONOPS is for quicker visualization to indicate where there is an area in trouble.
e.g. initial approach might be
blue - all jobs success
yellow - no failures, but some unstable
red - some failures
grey - no jobs, no none of the jobs have been run
Currently, the trend charts can only provide daily updated view, so it is difficult to see on long-time trend from these charts.
These charts should be configurable so that it would be possible to select another grain (such as weekly, or monthly or every N days), in order to reduce the detail level in favor of a long term trend.
Use div instead of tables for the layout of the dashboard portlets.
Tables should only be used for displaying data (where applicable).
Found an issue (reproducible) with "Build status" and the Dashboard.
In the post-build actions ... I issue build.setResult(Result.UNSTABLE);
This is where it gets strange...
If I restart Jenkins by either rebooting during a new plugin upload OR a jenkins restart using /etc/init.d/jenkins restart, when the server comes back the status as UNSTABLE as expected.
Please feel free to reclassify or cancel if this was reproduced as a defect in error.
In a situation with many jobs (where the list of unstable jobs is particularly handy) there are often a few disabled jobs as well.
The current 'Unstable jobs' widget handles disabled jobs like any other. Disabled jobs are thus included in the list if their last build failed or was unstable.
At this moment, the user can already choose to include or exclude the (non-failed) unstable jobs, using a simple checkbox.
A similar checkbox should be added to let the user include or exclude (failed/unstable) disabled jobs.
The dasboard view is an excellent plug-in to improve the look and feel of your Hudson instance. It would be cool, if the same feature/concept would be used for the job page. Currently the trend reports on the job page are shown one after each other. Using a dashboard wouldbe a valuable feature: you can show/hide or reorder the trend reports.
For those users who came from other views expect that it is suffice to select several jobs to start using the dashboard view plugin.
But if no portlet is configured, the view just shows an empty page. This is not very user friendly.
Either the new view should contain some initial portlets to get the user going, or otherwise show the welcome message to encourage users to add portlet when none is defined.
(Based on the actual user feedback at a training.)
It would be very useful to have an option to show the status of the children of a matrix configuration build on the dashboard itself - just as you get if you go to the status page of a matrix configuration build.
Steps to reproduce:
1. Create a job that generates and displays any sort of valid junit output
2. Create a dashboard view with the test statistics portlet and associate the new job
3. Run the job so that test results are populated in the grid
4. Edit the job config's build commands to force a build execution failure. (This is to simulate the event that the job doesn't run successfully.)
Expected:
Test Statistics Grid/Chart should display no test results for the most recent build that failed (ei, 0 success, 0 fail, 0 skipped, 0 total)
Actual:
Test Statistics Grid/Chart displays the test results of the last successful build even through the job state itself is "Failed"
The dashboard-view plugin is really nice.
One thing which would be helpful for our team is have a portlet very similar to the 'unstable jobs' portlet, which shows only failing jobs (red ball jobs). This is high priority information, and it's useful to show it in the dashboard.
We have some Matrix jobs created which do primarly testing of some combinations. The jobs itself do show test trends in the main matrix job and in the sub configuration jobs.
Now i wanted to have a Dashboard view for them and added the test trend chart, but it remains empty.
see attached picture
I'm currently developing some new portlets and I think the list selection in the edit dashboard view dialogs will become very unhandy if the number of available portlets is > 10. Wouldn't it be better, if the portlet selection would be done in the style of the Jira Gadget Explorer? I.e., you can categorize the portlets, see a preview, etc...
Currently there is only minimal (slow blinking) decoration of the weather bubble if a job is actually executing.
Would it be possible to add some overlay (maybe a small clock (which sometimes appears in the build queue list itself), or even the letter "Q", or whatever to indicate that job is in the build queue.
CONOPS. you have a lot of jobs and a lot of dashboards. you have a deep build queue, you want to fire off a bunch of jobs from the web UI and don't want to have to keep scrolling up/down to avoid duplicates.
Under a new Multi-Branch-Matrix project branch sources,
if I include more than 24 branches to create 24 branch jobs,
(refer to "Selection_003.png")
then I'll see Jenkins page crash for "Jnekins Manage" page and "Dashboard-view" page.
(refer to "Manage Jenkins [Jenkins] - Mozilla Firefox_004.png")
Within Jenkins log (refer to "jenkins.log"),
right after I save the configuration to include more than 24 branches,
I'll see many repeated WARNING:
hudson.ExpressionFactory2$JexlExpression evaluate
WARNING: Caught exception evaluating: it.queueItems in /ajaxBuildQueue. Reason: java.lang.reflect.InvocationTargetException
java.lang.reflect.InvocationTargetException
When I go to "Manage Jenkins" (/manage) page or a "Dashboard-view" page,
I'll see Jenkins Oops! crash page.
Refer to "Manage Jenkins [Jenkins].html" (the snapshot page of Manage Jenkins)
I also use Firebug to extract the "Get Manage - 500 Server Error" response.
Refer to "GET_Manage_response.html"
Stack tracejavax
.servlet.ServletException: org.apache.commons.jelly.JellyTagException: jar:file:/var/cache/jenkins/war
/WEB-INF/lib/jenkins-core-2.7.2.jar!/hudson/model/View/sidepanel.jelly:75:50: st:include Comparison
method violates its general contract!
at org.kohsuke.stapler.jelly.JellyFacet$1.dispatch(JellyFacet.java:103)
at org.kohsuke.stapler.Stapler.tryInvoke(Stapler.java:746)
at org.kohsuke.stapler.Stapler.invoke(Stapler.java:876)
at org.kohsuke.stapler.Stapler.invoke(Stapler.java:649)
at org.kohsuke.stapler.Stapler.service(Stapler.java:238)
at javax.servlet.http.HttpServlet.service(HttpServlet.java:790)
at org.eclipse.jetty.servlet.ServletHolder.handle(ServletHolder.java:812)
at org.eclipse.jetty.servlet.ServletHandler$CachedChain.doFilter(ServletHandler.java:1669)
at hudson.util.PluginServletFilter$1.doFilter(PluginServletFilter.java:135)
at com.smartcodeltd.jenkinsci.plugin.assetbundler.filters.LessCSS.doFilter(LessCSS.java:47)
at hudson.util.PluginServletFilter$1.doFilter(PluginServletFilter.java:132)
at hudson.plugins.greenballs.GreenBallFilter.doFilter(GreenBallFilter.java:59)
at hudson.util.PluginServletFilter$1.doFilter(PluginServletFilter.java:132)
at hudson.plugins.audit_trail.AuditTrailFilter.doFilter(AuditTrailFilter.java:95)
at hudson.util.PluginServletFilter$1.doFilter(PluginServletFilter.java:132)
at net.bull.javamelody.MonitoringFilter.doFilter(MonitoringFilter.java:201)
at net.bull.javamelody.MonitoringFilter.doFilter(MonitoringFilter.java:178)
at net.bull.javamelody.PluginMonitoringFilter.doFilter(PluginMonitoringFilter.java:85)
at org.jvnet.hudson.plugins.monitoring.HudsonMonitoringFilter.doFilter(HudsonMonitoringFilter.java:104
)
at hudson.util.PluginServletFilter$1.doFilter(PluginServletFilter.java:132)
at hudson.util.PluginServletFilter.doFilter(PluginServletFilter.java:126)
at org.eclipse.jetty.servlet.ServletHandler$CachedChain.doFilter(ServletHandler.java:1652)
at hudson.security.csrf.CrumbFilter.doFilter(CrumbFilter.java:49)
at org.eclipse.jetty.servlet.ServletHandler$CachedChain.doFilter(ServletHandler.java:1652)
at hudson.security.ChainedServletFilter$1.doFilter(ChainedServletFilter.java:84)
at hudson.security.UnwrapSecurityExceptionFilter.doFilter(UnwrapSecurityExceptionFilter.java:51)
at hudson.security.ChainedServletFilter$1.doFilter(ChainedServletFilter.java:87)
at jenkins.security.ExceptionTranslationFilter.doFilter(ExceptionTranslationFilter.java:117)
at hudson.security.ChainedServletFilter$1.doFilter(ChainedServletFilter.java:87)
at org.acegisecurity.providers.anonymous.AnonymousProcessingFilter.doFilter(AnonymousProcessingFilter
.java:125)
at hudson.security.ChainedServletFilter$1.doFilter(ChainedServletFilter.java:87)
at org.acegisecurity.ui.rememberme.RememberMeProcessingFilter.doFilter(RememberMeProcessingFilter.java
:142)
at hudson.security.ChainedServletFilter$1.doFilter(ChainedServletFilter.java:87)
at org.acegisecurity.ui.AbstractProcessingFilter.doFilter(AbstractProcessingFilter.java:271)
at hudson.security.ChainedServletFilter$1.doFilter(ChainedServletFilter.java:87)
at jenkins.security.BasicHeaderProcessor.doFilter(BasicHeaderProcessor.java:93)
at hudson.security.ChainedServletFilter$1.doFilter(ChainedServletFilter.java:87)
at org.acegisecurity.context.HttpSessionContextIntegrationFilter.doFilter(HttpSessionContextIntegrationFilter
.java:249)
at hudson.security.HttpSessionContextIntegrationFilter2.doFilter(HttpSessionContextIntegrationFilter2
.java:67)
at hudson.security.ChainedServletFilter$1.doFilter(ChainedServletFilter.java:87)
at hudson.security.ChainedServletFilter.doFilter(ChainedServletFilter.java:76)
at hudson.security.HudsonFilter.doFilter(HudsonFilter.java:171)
at org.eclipse.jetty.servlet.ServletHandler$CachedChain.doFilter(ServletHandler.java:1652)
at org.kohsuke.stapler.compression.CompressionFilter.doFilter(CompressionFilter.java:49)
at org.eclipse.jetty.servlet.ServletHandler$CachedChain.doFilter(ServletHandler.java:1652)
at hudson.util.CharacterEncodingFilter.doFilter(CharacterEncodingFilter.java:82)
at org.eclipse.jetty.servlet.ServletHandler$CachedChain.doFilter(ServletHandler.java:1652)
at org.kohsuke.stapler.DiagnosticThreadNameFilter.doFilter(DiagnosticThreadNameFilter.java:30)
at org.eclipse.jetty.servlet.ServletHandler$CachedChain.doFilter(ServletHandler.java:1652)
at org.eclipse.jetty.servlet.ServletHandler.doHandle(ServletHandler.java:585)
at org.eclipse.jetty.server.handler.ScopedHandler.handle(ScopedHandler.java:143)
at org.eclipse.jetty.security.SecurityHandler.handle(SecurityHandler.java:553)
at org.eclipse.jetty.server.session.SessionHandler.doHandle(SessionHandler.java:223)
at org.eclipse.jetty.server.handler.ContextHandler.doHandle(ContextHandler.java:1127)
at org.eclipse.jetty.servlet.ServletHandler.doScope(ServletHandler.java:515)
at org.eclipse.jetty.server.session.SessionHandler.doScope(SessionHandler.java:185)
at org.eclipse.jetty.server.handler.ContextHandler.doScope(ContextHandler.java:1061)
at org.eclipse.jetty.server.handler.ScopedHandler.handle(ScopedHandler.java:141)
at org.eclipse.jetty.server.handler.HandlerWrapper.handle(HandlerWrapper.java:97)
at org.eclipse.jetty.server.handler.RequestLogHandler.handle(RequestLogHandler.java:95)
at org.eclipse.jetty.server.handler.HandlerWrapper.handle(HandlerWrapper.java:97)
at org.eclipse.jetty.server.Server.handle(Server.java:499)
at org.eclipse.jetty.server.HttpChannel.handle(HttpChannel.java:311)
at org.eclipse.jetty.server.HttpConnection.onFillable(HttpConnection.java:257)
at org.eclipse.jetty.io.AbstractConnection$2.run(AbstractConnection.java:544)
at winstone.BoundedExecutorService$1.run(BoundedExecutorService.java:77)
at java.util.concurrent.ThreadPoolExecutor.runWorker(ThreadPoolExecutor.java:1145)
at java.util.concurrent.ThreadPoolExecutor$Worker.run(ThreadPoolExecutor.java:615)
at java.lang.Thread.run(Thread.java:745)
Caused by: org.apache.commons.jelly.JellyTagException: jar:file:/var/cache/jenkins/war/WEB-INF/lib/jenkins-core-2
.7.2.jar!/hudson/model/View/sidepanel.jelly:75:50: st:include Comparison method violates its general
contract!
at org.apache.commons.jelly.impl.TagScript.handleException(TagScript.java:726)
at org.apache.commons.jelly.impl.TagScript.run(TagScript.java:281)
at org.apache.commons.jelly.impl.ScriptBlock.run(ScriptBlock.java:95)
at org.apache.commons.jelly.TagSupport.invokeBody(TagSupport.java:161)
at org.apache.commons.jelly.tags.core.ForEachTag.doTag(ForEachTag.java:150)
at org.apache.commons.jelly.impl.TagScript.run(TagScript.java:269)
at org.apache.commons.jelly.impl.ScriptBlock.run(ScriptBlock.java:95)
at org.kohsuke.stapler.jelly.CallTagLibScript$1.run(CallTagLibScript.java:99)
at org.apache.commons.jelly.tags.define.InvokeBodyTag.doTag(InvokeBodyTag.java:91)
at org.apache.commons.jelly.impl.TagScript.run(TagScript.java:269)
at org.apache.commons.jelly.tags.core.CoreTagLibrary$1.run(CoreTagLibrary.java:98)
at org.apache.commons.jelly.impl.ScriptBlock.run(ScriptBlock.java:95)
at org.apache.commons.jelly.tags.core.CoreTagLibrary$2.run(CoreTagLibrary.java:105)
at org.kohsuke.stapler.jelly.CallTagLibScript.run(CallTagLibScript.java:120)
at org.apache.commons.jelly.impl.ScriptBlock.run(ScriptBlock.java:95)
at org.apache.commons.jelly.tags.core.CoreTagLibrary$2.run(CoreTagLibrary.java:105)
at org.kohsuke.stapler.jelly.JellyViewScript.run(JellyViewScript.java:95)
at org.kohsuke.stapler.jelly.IncludeTag.doTag(IncludeTag.java:147)
at org.apache.commons.jelly.impl.TagScript.run(TagScript.java:269)
at org.kohsuke.stapler.jelly.JellyViewScript.run(JellyViewScript.java:95)
at org.kohsuke.stapler.jelly.IncludeTag.doTag(IncludeTag.java:147)
at org.apache.commons.jelly.impl.TagScript.run(TagScript.java:269)
at org.apache.commons.jelly.tags.core.CoreTagLibrary$1.run(CoreTagLibrary.java:98)
at org.apache.commons.jelly.impl.ScriptBlock.run(ScriptBlock.java:95)
at org.kohsuke.stapler.jelly.CallTagLibScript$1.run(CallTagLibScript.java:99)
at org.apache.commons.jelly.tags.define.InvokeBodyTag.doTag(InvokeBodyTag.java:91)
at org.apache.commons.jelly.impl.TagScript.run(TagScript.java:269)
at org.apache.commons.jelly.impl.ScriptBlock.run(ScriptBlock.java:95)
at org.kohsuke.stapler.jelly.ReallyStaticTagLibrary$1.run(ReallyStaticTagLibrary.java:99)
at org.apache.commons.jelly.tags.core.CoreTagLibrary$1.run(CoreTagLibrary.java:98)
at org.apache.commons.jelly.impl.ScriptBlock.run(ScriptBlock.java:95)
at org.kohsuke.stapler.jelly.ReallyStaticTagLibrary$1.run(ReallyStaticTagLibrary.java:99)
at org.apache.commons.jelly.impl.ScriptBlock.run(ScriptBlock.java:95)
at org.kohsuke.stapler.jelly.ReallyStaticTagLibrary$1.run(ReallyStaticTagLibrary.java:99)
at org.apache.commons.jelly.impl.ScriptBlock.run(ScriptBlock.java:95)
at org.kohsuke.stapler.jelly.ReallyStaticTagLibrary$1.run(ReallyStaticTagLibrary.java:99)
at org.apache.commons.jelly.impl.ScriptBlock.run(ScriptBlock.java:95)
at org.apache.commons.jelly.tags.core.CoreTagLibrary$2.run(CoreTagLibrary.java:105)
at org.kohsuke.stapler.jelly.CallTagLibScript.run(CallTagLibScript.java:120)
at org.apache.commons.jelly.tags.core.CoreTagLibrary$2.run(CoreTagLibrary.java:105)
at org.kohsuke.stapler.jelly.JellyViewScript.run(JellyViewScript.java:95)
at org.kohsuke.stapler.jelly.DefaultScriptInvoker.invokeScript(DefaultScriptInvoker.java:63)
at org.kohsuke.stapler.jelly.DefaultScriptInvoker.invokeScript(DefaultScriptInvoker.java:53)
at org.kohsuke.stapler.jelly.JellyFacet$1.dispatch(JellyFacet.java:95)
... 68 more
Caused by: java.lang.IllegalArgumentException: Comparison method violates its general contract!
at java.util.TimSort.mergeHi(TimSort.java:868)
at java.util.TimSort.mergeAt(TimSort.java:485)
at java.util.TimSort.mergeCollapse(TimSort.java:410)
at java.util.TimSort.sort(TimSort.java:214)
at java.util.TimSort.sort(TimSort.java:173)
at java.util.Arrays.sort(Arrays.java:659)
at java.util.Collections.sort(Collections.java:217)
at hudson.views.MostRecentJobsFilter.filter(MostRecentJobsFilter.java:35)
at hudson.model.ListView.getItems(ListView.java:205)
at hudson.model.ListView.getItems(ListView.java:69)
at hudson.model.View.filterQueue(View.java:471)
at hudson.model.View.getQueueItems(View.java:488)
at sun.reflect.GeneratedMethodAccessor350.invoke(Unknown Source)
at sun.reflect.DelegatingMethodAccessorImpl.invoke(DelegatingMethodAccessorImpl.java:43)
at java.lang.reflect.Method.invoke(Method.java:606)
at org.codehaus.groovy.reflection.CachedMethod.invoke(CachedMethod.java:93)
at groovy.lang.MetaMethod.doMethodInvoke(MetaMethod.java:325)
at org.codehaus.groovy.runtime.metaclass.MethodMetaProperty$GetBeanMethodMetaProperty.getProperty(MethodMetaProperty
.java:76)
at org.codehaus.groovy.runtime.callsite.GetEffectivePojoPropertySite.getProperty(GetEffectivePojoPropertySite
.java:64)
at org.codehaus.groovy.runtime.callsite.AbstractCallSite.callGetProperty(AbstractCallSite.java:296)at jenkins.widgets.BuildQueueWidget.index.run(index.groovy:5) at org.kohsuke.stapler.jelly.groovy.GroovierJellyScript.run(GroovierJellyScript.java:74) at org.kohsuke.stapler.jelly.groovy.GroovierJellyScript.run(GroovierJellyScript.java:62) at org.kohsuke.stapler.jelly.IncludeTag.doTag(IncludeTag.java:147) at org.apache.commons.jelly.impl.TagScript.run(TagScript.java:269) ... 110 more
I include a list of the plugins that I'm currently using in "Plugin Update Center [Jenkins].html"
Right now,
I can 100% reproduce the same problem if I include more than 24 branches.
If I remove 1 branch to be 23 branches,
then all the pages display correctly.
For Dashboard-View issue,
I'm also able to reproduce it on a branch-new Jenkins2 server (fresh installation)
with only "Dashboard-view" plugin and "View Job Filters" plugin.
Within Dashboard-view configuration,
I select:
Filter build queue
Filter build executors
Status Filter selects "All selected jobs" with "Recurse in subfolders
and 3 Job filters:
All Jobs
Job Type Filter
Most Recent Jobs Filter
We have more than 1 instance of Hudson running - it would be very convenient to be able to have a new Dashboard view that loads views from a remote Hudson server
On an dashboard view the "Test Statistics Grid" produces exception stack only.
We got the following stack trace.
Stack trace
javax.servlet.ServletException: org.apache.commons.jelly.JellyTagException: jar:file:/d:/hudson/plugins/dashboard-view/WEB-INF/lib/classes.jar!/hudson/plugins/view/dashboard/test/TestStatisticsPortlet/portlet.jelly:29:44: hudson/maven/reporters/SurefireAggregatedReport
at org.kohsuke.stapler.jelly.JellyClassTearOff.serveIndexJelly(JellyClassTearOff.java:117)
at org.kohsuke.stapler.jelly.JellyFacet.handleIndexRequest(JellyFacet.java:127)
at org.kohsuke.stapler.Stapler.tryInvoke(Stapler.java:717)
at org.kohsuke.stapler.Stapler.invoke(Stapler.java:858)
at org.kohsuke.stapler.MetaClass$6.doDispatch(MetaClass.java:248)
at org.kohsuke.stapler.NameBasedDispatcher.dispatch(NameBasedDispatcher.java:53)
at org.kohsuke.stapler.Stapler.tryInvoke(Stapler.java:728)
at org.kohsuke.stapler.Stapler.invoke(Stapler.java:858)
at org.kohsuke.stapler.Stapler.invoke(Stapler.java:631)
at org.kohsuke.stapler.Stapler.service(Stapler.java:225)
at javax.servlet.http.HttpServlet.service(HttpServlet.java:848)
at org.eclipse.jetty.servlet.ServletHolder.handle(ServletHolder.java:686)
at org.eclipse.jetty.servlet.ServletHandler$CachedChain.doFilter(ServletHandler.java:1494)
at hudson.util.PluginServletFilter$1.doFilter(PluginServletFilter.java:96)
at hudson.plugins.greenballs.GreenBallFilter.doFilter(GreenBallFilter.java:58)
at hudson.util.PluginServletFilter$1.doFilter(PluginServletFilter.java:99)
at hudson.util.PluginServletFilter.doFilter(PluginServletFilter.java:88)
at org.eclipse.jetty.servlet.ServletHandler$CachedChain.doFilter(ServletHandler.java:1482)
at hudson.security.csrf.CrumbFilter.doFilter(CrumbFilter.java:48)
at org.eclipse.jetty.servlet.ServletHandler$CachedChain.doFilter(ServletHandler.java:1482)
at hudson.security.ChainedServletFilter$1.doFilter(ChainedServletFilter.java:84)
at hudson.security.ChainedServletFilter.doFilter(ChainedServletFilter.java:76)
at hudson.security.HudsonFilter.doFilter(HudsonFilter.java:164)
at org.eclipse.jetty.servlet.ServletHandler$CachedChain.doFilter(ServletHandler.java:1482)
at org.kohsuke.stapler.compression.CompressionFilter.doFilter(CompressionFilter.java:46)
at org.eclipse.jetty.servlet.ServletHandler$CachedChain.doFilter(ServletHandler.java:1482)
at hudson.util.CharacterEncodingFilter.doFilter(CharacterEncodingFilter.java:81)
at org.eclipse.jetty.servlet.ServletHandler$CachedChain.doFilter(ServletHandler.java:1474)
at org.eclipse.jetty.servlet.ServletHandler.doHandle(ServletHandler.java:499)
at org.eclipse.jetty.server.handler.ScopedHandler.handle(ScopedHandler.java:137)
at org.eclipse.jetty.security.SecurityHandler.handle(SecurityHandler.java:533)
at org.eclipse.jetty.server.session.SessionHandler.doHandle(SessionHandler.java:231)
at org.eclipse.jetty.server.handler.ContextHandler.doHandle(ContextHandler.java:1086)
at org.eclipse.jetty.servlet.ServletHandler.doScope(ServletHandler.java:428)
at org.eclipse.jetty.server.session.SessionHandler.doScope(SessionHandler.java:193)
at org.eclipse.jetty.server.handler.ContextHandler.doScope(ContextHandler.java:1020)
at org.eclipse.jetty.server.handler.ScopedHandler.handle(ScopedHandler.java:135)
at org.eclipse.jetty.server.handler.HandlerWrapper.handle(HandlerWrapper.java:116)
at org.eclipse.jetty.server.Server.handle(Server.java:370)
at org.eclipse.jetty.server.AbstractHttpConnection.handleRequest(AbstractHttpConnection.java:489)
at org.eclipse.jetty.server.AbstractHttpConnection.headerComplete(AbstractHttpConnection.java:949)
at org.eclipse.jetty.server.AbstractHttpConnection$RequestHandler.headerComplete(AbstractHttpConnection.java:1011)
at org.eclipse.jetty.http.HttpParser.parseNext(HttpParser.java:644)
at org.eclipse.jetty.http.HttpParser.parseAvailable(HttpParser.java:235)
at org.eclipse.jetty.server.AsyncHttpConnection.handle(AsyncHttpConnection.java:82)
at org.eclipse.jetty.io.nio.SelectChannelEndPoint.handle(SelectChannelEndPoint.java:668)
at org.eclipse.jetty.io.nio.SelectChannelEndPoint$1.run(SelectChannelEndPoint.java:52)
at winstone.BoundedExecutorService$1.run(BoundedExecutorService.java:77)
at java.util.concurrent.ThreadPoolExecutor.runWorker(Unknown Source)
at java.util.concurrent.ThreadPoolExecutor$Worker.run(Unknown Source)
at java.lang.Thread.run(Unknown Source)
Caused by: org.apache.commons.jelly.JellyTagException: jar:file:/d:/hudson/plugins/dashboard-view/WEB-INF/lib/classes.jar!/hudson/plugins/view/dashboard/test/TestStatisticsPortlet/portlet.jelly:29:44: hudson/maven/reporters/SurefireAggregatedReport
at org.apache.commons.jelly.impl.TagScript.handleException(TagScript.java:745)
at org.apache.commons.jelly.impl.TagScript.run(TagScript.java:289)
at org.kohsuke.stapler.jelly.ReallyStaticTagLibrary$1.run(ReallyStaticTagLibrary.java:99)
at org.kohsuke.stapler.jelly.ReallyStaticTagLibrary$1.run(ReallyStaticTagLibrary.java:99)
at org.kohsuke.stapler.jelly.ReallyStaticTagLibrary$1.run(ReallyStaticTagLibrary.java:99)
at org.kohsuke.stapler.jelly.CallTagLibScript$1.run(CallTagLibScript.java:99)
at org.apache.commons.jelly.tags.define.InvokeBodyTag.doTag(InvokeBodyTag.java:91)
at org.apache.commons.jelly.impl.TagScript.run(TagScript.java:269)
at org.kohsuke.stapler.jelly.ReallyStaticTagLibrary$1.run(ReallyStaticTagLibrary.java:99)
at org.apache.commons.jelly.impl.ScriptBlock.run(ScriptBlock.java:95)
at org.kohsuke.stapler.jelly.ReallyStaticTagLibrary$1.run(ReallyStaticTagLibrary.java:99)
at org.apache.commons.jelly.impl.ScriptBlock.run(ScriptBlock.java:95)
at org.apache.commons.jelly.tags.core.CoreTagLibrary$2.run(CoreTagLibrary.java:105)
at org.kohsuke.stapler.jelly.CallTagLibScript.run(CallTagLibScript.java:120)
at org.apache.commons.jelly.tags.core.CoreTagLibrary$2.run(CoreTagLibrary.java:105)
at org.kohsuke.stapler.jelly.JellyViewScript.run(JellyViewScript.java:81)
at org.kohsuke.stapler.jelly.IncludeTag.doTag(IncludeTag.java:147)
at org.apache.commons.jelly.impl.TagScript.run(TagScript.java:269)
at org.apache.commons.jelly.impl.ScriptBlock.run(ScriptBlock.java:95)
at org.apache.commons.jelly.TagSupport.invokeBody(TagSupport.java:161)
at org.apache.commons.jelly.tags.core.ForEachTag.doTag(ForEachTag.java:150)
at org.apache.commons.jelly.impl.TagScript.run(TagScript.java:269)
at org.kohsuke.stapler.jelly.ReallyStaticTagLibrary$1.run(ReallyStaticTagLibrary.java:99)
at org.apache.commons.jelly.tags.core.CoreTagLibrary$1.run(CoreTagLibrary.java:98)
at org.kohsuke.stapler.jelly.ReallyStaticTagLibrary$1.run(ReallyStaticTagLibrary.java:99)
at org.kohsuke.stapler.jelly.ReallyStaticTagLibrary$1.run(ReallyStaticTagLibrary.java:99)
at org.kohsuke.stapler.jelly.ReallyStaticTagLibrary$1.run(ReallyStaticTagLibrary.java:99)
at org.apache.commons.jelly.impl.ScriptBlock.run(ScriptBlock.java:95)
at org.apache.commons.jelly.TagSupport.invokeBody(TagSupport.java:161)
at org.apache.commons.jelly.tags.core.OtherwiseTag.doTag(OtherwiseTag.java:41)
at org.apache.commons.jelly.impl.TagScript.run(TagScript.java:269)
at org.apache.commons.jelly.impl.ScriptBlock.run(ScriptBlock.java:95)
at org.apache.commons.jelly.TagSupport.invokeBody(TagSupport.java:161)
at org.apache.commons.jelly.tags.core.ChooseTag.doTag(ChooseTag.java:38)
at org.apache.commons.jelly.impl.TagScript.run(TagScript.java:269)
at org.apache.commons.jelly.impl.ScriptBlock.run(ScriptBlock.java:95)
at org.apache.commons.jelly.tags.core.CoreTagLibrary$2.run(CoreTagLibrary.java:105)
at org.kohsuke.stapler.jelly.JellyViewScript.run(JellyViewScript.java:81)
at org.kohsuke.stapler.jelly.IncludeTag.doTag(IncludeTag.java:147)
at org.apache.commons.jelly.impl.TagScript.run(TagScript.java:269)
at org.apache.commons.jelly.impl.ScriptBlock.run(ScriptBlock.java:95)
at org.kohsuke.stapler.jelly.CallTagLibScript$1.run(CallTagLibScript.java:99)
at org.apache.commons.jelly.tags.define.InvokeBodyTag.doTag(InvokeBodyTag.java:91)
at org.apache.commons.jelly.impl.TagScript.run(TagScript.java:269)
at org.apache.commons.jelly.impl.ScriptBlock.run(ScriptBlock.java:95)
at org.apache.commons.jelly.tags.core.CoreTagLibrary$1.run(CoreTagLibrary.java:98)
at org.apache.commons.jelly.impl.ScriptBlock.run(ScriptBlock.java:95)
at org.apache.commons.jelly.tags.core.CoreTagLibrary$2.run(CoreTagLibrary.java:105)
at org.kohsuke.stapler.jelly.CallTagLibScript.run(CallTagLibScript.java:120)
at org.apache.commons.jelly.impl.ScriptBlock.run(ScriptBlock.java:95)
at org.kohsuke.stapler.jelly.CallTagLibScript$1.run(CallTagLibScript.java:99)
at org.apache.commons.jelly.tags.define.InvokeBodyTag.doTag(InvokeBodyTag.java:91)
at org.apache.commons.jelly.impl.TagScript.run(TagScript.java:269)
at org.apache.commons.jelly.impl.ScriptBlock.run(ScriptBlock.java:95)
at org.kohsuke.stapler.jelly.ReallyStaticTagLibrary$1.run(ReallyStaticTagLibrary.java:99)
at org.apache.commons.jelly.impl.ScriptBlock.run(ScriptBlock.java:95)
at org.kohsuke.stapler.jelly.ReallyStaticTagLibrary$1.run(ReallyStaticTagLibrary.java:99)
at org.kohsuke.stapler.jelly.ReallyStaticTagLibrary$1.run(ReallyStaticTagLibrary.java:99)
at org.apache.commons.jelly.impl.ScriptBlock.run(ScriptBlock.java:95)
at org.kohsuke.stapler.jelly.ReallyStaticTagLibrary$1.run(ReallyStaticTagLibrary.java:99)
at org.apache.commons.jelly.impl.ScriptBlock.run(ScriptBlock.java:95)
at org.kohsuke.stapler.jelly.ReallyStaticTagLibrary$1.run(ReallyStaticTagLibrary.java:99)
at org.apache.commons.jelly.impl.ScriptBlock.run(ScriptBlock.java:95)
at org.apache.commons.jelly.tags.core.CoreTagLibrary$2.run(CoreTagLibrary.java:105)
at org.kohsuke.stapler.jelly.CallTagLibScript.run(CallTagLibScript.java:120)
at org.kohsuke.stapler.jelly.CompressTag.doTag(CompressTag.java:44)
at org.apache.commons.jelly.impl.TagScript.run(TagScript.java:269)
at org.kohsuke.stapler.jelly.JellyViewScript.run(JellyViewScript.java:81)
at org.kohsuke.stapler.jelly.DefaultScriptInvoker.invokeScript(DefaultScriptInvoker.java:63)
at org.kohsuke.stapler.jelly.DefaultScriptInvoker.invokeScript(DefaultScriptInvoker.java:53)
at org.kohsuke.stapler.jelly.JellyClassTearOff.serveIndexJelly(JellyClassTearOff.java:112)
... 50 more
Caused by: java.lang.NoClassDefFoundError: hudson/maven/reporters/SurefireAggregatedReport
at hudson.plugins.view.dashboard.test.TestStatisticsPortlet.getTestResultSummary(TestStatisticsPortlet.java:38)
at sun.reflect.NativeMethodAccessorImpl.invoke0(Native Method)
at sun.reflect.NativeMethodAccessorImpl.invoke(Unknown Source)
at sun.reflect.DelegatingMethodAccessorImpl.invoke(Unknown Source)
at java.lang.reflect.Method.invoke(Unknown Source)
at org.apache.commons.jexl.util.introspection.UberspectImpl$VelMethodImpl.invoke(UberspectImpl.java:258)
at org.apache.commons.jexl.parser.ASTMethod.execute(ASTMethod.java:104)
at org.apache.commons.jexl.parser.ASTReference.execute(ASTReference.java:83)
at org.apache.commons.jexl.parser.ASTReference.value(ASTReference.java:57)
at org.apache.commons.jexl.parser.ASTReferenceExpression.value(ASTReferenceExpression.java:51)
at org.apache.commons.jexl.ExpressionImpl.evaluate(ExpressionImpl.java:80)
at hudson.ExpressionFactory2$JexlExpression.evaluate(ExpressionFactory2.java:74)
at org.apache.commons.jelly.tags.core.CoreTagLibrary$3.run(CoreTagLibrary.java:134)
at org.apache.commons.jelly.impl.ScriptBlock.run(ScriptBlock.java:95)
at org.apache.commons.jelly.tags.core.CoreTagLibrary$2.run(CoreTagLibrary.java:105)
at org.kohsuke.stapler.jelly.JellyViewScript.run(JellyViewScript.java:81)
at org.kohsuke.stapler.jelly.IncludeTag.doTag(IncludeTag.java:147)
at org.apache.commons.jelly.impl.TagScript.run(TagScript.java:269)
... 119 more
Caused by: java.lang.ClassNotFoundException: hudson.maven.reporters.SurefireAggregatedReport
at org.apache.tools.ant.AntClassLoader.findClassInComponents(AntClassLoader.java:1365)
at org.apache.tools.ant.AntClassLoader.findClass(AntClassLoader.java:1315)
at org.apache.tools.ant.AntClassLoader.loadClass(AntClassLoader.java:1068)
at java.lang.ClassLoader.loadClass(Unknown Source)
... 137 more
When I surf to [ourbaseURL]:8080 when I haven't logged in I get a failure to load the webpage. I can navigate to other sub-pages if I type them in manually the root dashboard page will not load until I login then everything works as expected. Below is the error I see in the logs when I try and load the website at the root URL unlogged in.
Apr 17, 2012 10:47:51 AM winstone.Logger logInternal
WARNING: Untrapped Error in Servlet
javax.servlet.ServletException: org.apache.commons.jelly.JellyTagException: jar:file:/C:/Dev/Jenkins/war/WEB-INF/lib/jenkins-core-1.460.jar!/hudson/model/View/index.jelly:44:43: org.apache.commons.jelly.JellyTagException: jar:file:/C:/Dev/Jenkins/war/WEB-INF/lib/jenkins-core-1.460.jar!/lib/hudson/projectView.jelly:60:22: java.lang.NullPointerException
at org.kohsuke.stapler.jelly.JellyClassTearOff.serveIndexJelly(JellyClassTearOff.java:112)
at org.kohsuke.stapler.jelly.JellyFacet.handleIndexRequest(JellyFacet.java:127)
at org.kohsuke.stapler.Stapler.tryInvoke(Stapler.java:563)
at org.kohsuke.stapler.Stapler.invoke(Stapler.java:659)
at org.kohsuke.stapler.Stapler.tryInvoke(Stapler.java:625)
at org.kohsuke.stapler.Stapler.invoke(Stapler.java:659)
at org.kohsuke.stapler.Stapler.invoke(Stapler.java:488)
at org.kohsuke.stapler.Stapler.service(Stapler.java:162)
at javax.servlet.http.HttpServlet.service(HttpServlet.java:45)
at winstone.ServletConfiguration.execute(ServletConfiguration.java:248)
at winstone.RequestDispatcher.forward(RequestDispatcher.java:333)
at winstone.RequestDispatcher.doFilter(RequestDispatcher.java:376)
at hudson.util.PluginServletFilter$1.doFilter(PluginServletFilter.java:95)
at hudson.plugins.greenballs.GreenBallFilter.doFilter(GreenBallFilter.java:74)
at hudson.util.PluginServletFilter$1.doFilter(PluginServletFilter.java:98)
at hudson.util.PluginServletFilter.doFilter(PluginServletFilter.java:87)
at winstone.FilterConfiguration.execute(FilterConfiguration.java:194)
at winstone.RequestDispatcher.doFilter(RequestDispatcher.java:366)
at hudson.security.csrf.CrumbFilter.doFilter(CrumbFilter.java:47)
at winstone.FilterConfiguration.execute(FilterConfiguration.java:194)
at winstone.RequestDispatcher.doFilter(RequestDispatcher.java:366)
at hudson.security.ChainedServletFilter$1.doFilter(ChainedServletFilter.java:84)
at hudson.security.UnwrapSecurityExceptionFilter.doFilter(UnwrapSecurityExceptionFilter.java:51)
at hudson.security.ChainedServletFilter$1.doFilter(ChainedServletFilter.java:87)
at org.acegisecurity.ui.ExceptionTranslationFilter.doFilter(ExceptionTranslationFilter.java:166)
at hudson.security.ChainedServletFilter$1.doFilter(ChainedServletFilter.java:87)
at org.acegisecurity.providers.anonymous.AnonymousProcessingFilter.doFilter(AnonymousProcessingFilter.java:125)
at hudson.security.ChainedServletFilter$1.doFilter(ChainedServletFilter.java:87)
at org.acegisecurity.ui.rememberme.RememberMeProcessingFilter.doFilter(RememberMeProcessingFilter.java:142)
at hudson.security.ChainedServletFilter$1.doFilter(ChainedServletFilter.java:87)
at org.acegisecurity.ui.AbstractProcessingFilter.doFilter(AbstractProcessingFilter.java:271)
at hudson.security.ChainedServletFilter$1.doFilter(ChainedServletFilter.java:87)
at org.acegisecurity.ui.basicauth.BasicProcessingFilter.doFilter(BasicProcessingFilter.java:173)
at hudson.security.ChainedServletFilter$1.doFilter(ChainedServletFilter.java:87)
at jenkins.security.ApiTokenFilter.doFilter(ApiTokenFilter.java:61)
at hudson.security.ChainedServletFilter$1.doFilter(ChainedServletFilter.java:87)
at org.acegisecurity.context.HttpSessionContextIntegrationFilter.doFilter(HttpSessionContextIntegrationFilter.java:249)
at hudson.security.HttpSessionContextIntegrationFilter2.doFilter(HttpSessionContextIntegrationFilter2.java:66)
at hudson.security.ChainedServletFilter$1.doFilter(ChainedServletFilter.java:87)
at hudson.security.ChainedServletFilter.doFilter(ChainedServletFilter.java:76)
at hudson.security.HudsonFilter.doFilter(HudsonFilter.java:164)
at winstone.FilterConfiguration.execute(FilterConfiguration.java:194)
at winstone.RequestDispatcher.doFilter(RequestDispatcher.java:366)
at hudson.util.CharacterEncodingFilter.doFilter(CharacterEncodingFilter.java:81)
at winstone.FilterConfiguration.execute(FilterConfiguration.java:194)
at winstone.RequestDispatcher.doFilter(RequestDispatcher.java:366)
at winstone.RequestDispatcher.forward(RequestDispatcher.java:331)
at winstone.RequestHandlerThread.processRequest(RequestHandlerThread.java:215)
at winstone.RequestHandlerThread.run(RequestHandlerThread.java:138)
at java.util.concurrent.Executors$RunnableAdapter.call(Unknown Source)
at java.util.concurrent.FutureTask$Sync.innerRun(Unknown Source)
at java.util.concurrent.FutureTask.run(Unknown Source)
at winstone.BoundedExecutorService$1.run(BoundedExecutorService.java:77)
at java.util.concurrent.ThreadPoolExecutor$Worker.runTask(Unknown Source)
at java.util.concurrent.ThreadPoolExecutor$Worker.run(Unknown Source)
at java.lang.Thread.run(Unknown Source)
Caused by: org.apache.commons.jelly.JellyTagException: jar:file:/C:/Dev/Jenkins/war/WEB-INF/lib/jenkins-core-1.460.jar!/hudson/model/View/index.jelly:44:43: org.apache.commons.jelly.JellyTagException: jar:file:/C:/Dev/Jenkins/war/WEB-INF/lib/jenkins-core-1.460.jar!/lib/hudson/projectView.jelly:60:22: java.lang.NullPointerException
at org.apache.commons.jelly.impl.TagScript.handleException(TagScript.java:716)
at org.apache.commons.jelly.impl.TagScript.run(TagScript.java:282)
at org.apache.commons.jelly.impl.ScriptBlock.run(ScriptBlock.java:95)
at org.kohsuke.stapler.jelly.CallTagLibScript$1.run(CallTagLibScript.java:98)
at org.apache.commons.jelly.tags.define.InvokeBodyTag.doTag(InvokeBodyTag.java:91)
at org.apache.commons.jelly.impl.TagScript.run(TagScript.java:270)
at org.apache.commons.jelly.impl.ScriptBlock.run(ScriptBlock.java:95)
at org.apache.commons.jelly.tags.core.CoreTagLibrary$1.run(CoreTagLibrary.java:98)
at org.apache.commons.jelly.impl.ScriptBlock.run(ScriptBlock.java:95)
at org.apache.commons.jelly.tags.core.CoreTagLibrary$2.run(CoreTagLibrary.java:105)
at org.kohsuke.stapler.jelly.CallTagLibScript.run(CallTagLibScript.java:119)
at org.apache.commons.jelly.impl.ScriptBlock.run(ScriptBlock.java:95)
at org.kohsuke.stapler.jelly.CallTagLibScript$1.run(CallTagLibScript.java:98)
at org.apache.commons.jelly.tags.define.InvokeBodyTag.doTag(InvokeBodyTag.java:91)
at org.apache.commons.jelly.impl.TagScript.run(TagScript.java:270)
at org.apache.commons.jelly.impl.ScriptBlock.run(ScriptBlock.java:95)
at org.kohsuke.stapler.jelly.ReallyStaticTagLibrary$1.run(ReallyStaticTagLibrary.java:99)
at org.apache.commons.jelly.impl.ScriptBlock.run(ScriptBlock.java:95)
at org.kohsuke.stapler.jelly.ReallyStaticTagLibrary$1.run(ReallyStaticTagLibrary.java:99)
at org.kohsuke.stapler.jelly.ReallyStaticTagLibrary$1.run(ReallyStaticTagLibrary.java:99)
at org.apache.commons.jelly.impl.ScriptBlock.run(ScriptBlock.java:95)
at org.kohsuke.stapler.jelly.ReallyStaticTagLibrary$1.run(ReallyStaticTagLibrary.java:99)
at org.apache.commons.jelly.impl.ScriptBlock.run(ScriptBlock.java:95)
at org.kohsuke.stapler.jelly.ReallyStaticTagLibrary$1.run(ReallyStaticTagLibrary.java:99)
at org.apache.commons.jelly.impl.ScriptBlock.run(ScriptBlock.java:95)
at org.apache.commons.jelly.tags.core.CoreTagLibrary$2.run(CoreTagLibrary.java:105)
at org.kohsuke.stapler.jelly.CallTagLibScript.run(CallTagLibScript.java:119)
at org.kohsuke.stapler.jelly.CompressTag.doTag(CompressTag.java:44)
at org.apache.commons.jelly.impl.TagScript.run(TagScript.java:270)
at org.kohsuke.stapler.jelly.JellyViewScript.run(JellyViewScript.java:81)
at org.kohsuke.stapler.jelly.DefaultScriptInvoker.invokeScript(DefaultScriptInvoker.java:63)
at org.kohsuke.stapler.jelly.DefaultScriptInvoker.invokeScript(DefaultScriptInvoker.java:53)
at org.kohsuke.stapler.jelly.JellyClassTearOff.serveIndexJelly(JellyClassTearOff.java:107)
... 55 more
Caused by: java.lang.RuntimeException: org.apache.commons.jelly.JellyTagException: jar:file:/C:/Dev/Jenkins/war/WEB-INF/lib/jenkins-core-1.460.jar!/lib/hudson/projectView.jelly:60:22: java.lang.NullPointerException
at org.kohsuke.stapler.jelly.groovy.JellyBuilder.doInvokeMethod(JellyBuilder.java:287)
at org.kohsuke.stapler.jelly.groovy.Namespace$ProxyImpl.invoke(Namespace.java:92)
at $Proxy30.projectView(Unknown Source)
at lib.JenkinsTagLib$projectView.call(Unknown Source)
at org.codehaus.groovy.runtime.callsite.CallSiteArray.defaultCall(CallSiteArray.java:42)
at org.codehaus.groovy.runtime.callsite.AbstractCallSite.call(AbstractCallSite.java:108)
at org.codehaus.groovy.runtime.callsite.AbstractCallSite.call(AbstractCallSite.java:120)
at hudson.model.View.main.run(main.groovy:14)
at org.kohsuke.stapler.jelly.groovy.GroovierJellyScript.run(GroovierJellyScript.java:66)
at org.kohsuke.stapler.jelly.groovy.GroovierJellyScript.run(GroovierJellyScript.java:59)
at org.kohsuke.stapler.jelly.IncludeTag.doTag(IncludeTag.java:146)
at org.apache.commons.jelly.impl.TagScript.run(TagScript.java:270)
... 86 more
Caused by: org.apache.commons.jelly.JellyTagException: jar:file:/C:/Dev/Jenkins/war/WEB-INF/lib/jenkins-core-1.460.jar!/lib/hudson/projectView.jelly:60:22: java.lang.NullPointerException
at org.apache.commons.jelly.impl.TagScript.handleException(TagScript.java:716)
at org.apache.commons.jelly.impl.TagScript.run(TagScript.java:282)
at org.apache.commons.jelly.impl.ScriptBlock.run(ScriptBlock.java:95)
at org.apache.commons.jelly.tags.core.CoreTagLibrary$1.run(CoreTagLibrary.java:98)
at org.apache.commons.jelly.impl.ScriptBlock.run(ScriptBlock.java:95)
at org.kohsuke.stapler.jelly.ReallyStaticTagLibrary$1.run(ReallyStaticTagLibrary.java:99)
at org.apache.commons.jelly.impl.ScriptBlock.run(ScriptBlock.java:95)
at org.apache.commons.jelly.tags.core.CoreTagLibrary$2.run(CoreTagLibrary.java:105)
at org.kohsuke.stapler.jelly.CallTagLibScript.run(CallTagLibScript.java:119)
at org.kohsuke.stapler.jelly.groovy.JellyBuilder.doInvokeMethod(JellyBuilder.java:283)
... 97 more
Caused by: java.lang.NullPointerException
at java.util.TreeSet.(Unknown Source)
at hudson.model.ListView.getItems(ListView.java:138)
at hudson.model.ListView.getItems(ListView.java:58)
at hudson.security.AuthorizationStrategy$1.hasPermission(AuthorizationStrategy.java:103)
at hudson.security.ACL.hasPermission(ACL.java:63)
at hudson.model.View.hasPermission(View.java:503)
at hudson.model.ViewGroupMixIn.getViews(ViewGroupMixIn.java:115)
at jenkins.model.Jenkins.getViews(Jenkins.java:1369)
at sun.reflect.NativeMethodAccessorImpl.invoke0(Native Method)
at sun.reflect.NativeMethodAccessorImpl.invoke(Unknown Source)
at sun.reflect.DelegatingMethodAccessorImpl.invoke(Unknown Source)
at java.lang.reflect.Method.invoke(Unknown Source)
at org.codehaus.groovy.reflection.CachedMethod.invoke(CachedMethod.java:90)
at groovy.lang.MetaMethod.doMethodInvoke(MetaMethod.java:233)
at groovy.lang.MetaClassImpl$GetBeanMethodMetaProperty.getProperty(MetaClassImpl.java:3457)
at org.codehaus.groovy.runtime.callsite.GetEffectivePojoPropertySite.getProperty(GetEffectivePojoPropertySite.java:61)
at org.codehaus.groovy.runtime.callsite.AbstractCallSite.callGetProperty(AbstractCallSite.java:227)
at hudson.model.View.main$_run_closure1.doCall(main.groovy:15)
at sun.reflect.NativeMethodAccessorImpl.invoke0(Native Method)
at sun.reflect.NativeMethodAccessorImpl.invoke(Unknown Source)
at sun.reflect.DelegatingMethodAccessorImpl.invoke(Unknown Source)
at java.lang.reflect.Method.invoke(Unknown Source)
at org.codehaus.groovy.reflection.CachedMethod.invoke(CachedMethod.java:90)
at groovy.lang.MetaMethod.doMethodInvoke(MetaMethod.java:233)
at org.codehaus.groovy.runtime.metaclass.ClosureMetaClass.invokeMethod(ClosureMetaClass.java:272)
at groovy.lang.MetaClassImpl.invokeMethod(MetaClassImpl.java:884)
at org.codehaus.groovy.runtime.callsite.PogoMetaClassSite.callCurrent(PogoMetaClassSite.java:66)
at org.codehaus.groovy.runtime.callsite.CallSiteArray.defaultCallCurrent(CallSiteArray.java:46)
at org.codehaus.groovy.runtime.callsite.AbstractCallSite.callCurrent(AbstractCallSite.java:133)
at org.codehaus.groovy.runtime.callsite.AbstractCallSite.callCurrent(AbstractCallSite.java:141)
at hudson.model.View.main$_run_closure1.doCall(main.groovy)
at sun.reflect.NativeMethodAccessorImpl.invoke0(Native Method)
at sun.reflect.NativeMethodAccessorImpl.invoke(Unknown Source)
at sun.reflect.DelegatingMethodAccessorImpl.invoke(Unknown Source)
at java.lang.reflect.Method.invoke(Unknown Source)
at org.codehaus.groovy.reflection.CachedMethod.invoke(CachedMethod.java:90)
at groovy.lang.MetaMethod.doMethodInvoke(MetaMethod.java:233)
at org.codehaus.groovy.runtime.metaclass.ClosureMetaClass.invokeMethod(ClosureMetaClass.java:272)
at groovy.lang.MetaClassImpl.invokeMethod(MetaClassImpl.java:884)
at groovy.lang.Closure.call(Closure.java:412)
at groovy.lang.Closure.call(Closure.java:406)
at org.kohsuke.stapler.jelly.groovy.JellyBuilder$1.run(JellyBuilder.java:271)
at org.kohsuke.stapler.jelly.CallTagLibScript$1.run(CallTagLibScript.java:98)
at org.apache.commons.jelly.tags.define.InvokeBodyTag.doTag(InvokeBodyTag.java:91)
at org.apache.commons.jelly.impl.TagScript.run(TagScript.java:270)
... 105 more
Different filter for a jobs view would allow splitting jobs into sets.
For example :
Showing main branches (master, develop) on the main Jenkins view, with details.
Show feature branches in "Jobs View", showing only build results.
Currently I am achieving by hiding jobs with jquery and "Simple Theme Plugin".
I noticed that when there is incorrect sorting on the Test Statistics Grid panel when trying to sort by a Success, Failed or Success %.
For example, if there are 5 jobs that have a success rate of 50%, 70%, 85%, 90% and 100%... The 100% job will be at the bottom when sorting in Descending order, because the first character (1) is lower than 5, 7, 8 or 9.
The data for Test Statistics Grid shows 0 and Test Statistics Chart can not displayed when there are tests executed, please refer to the attachments.
Jobs that have been (permanently) disabled in the job configuration currently have a gray ball icon in the dashboard. But so do jobs whose current build was canceled by the user. It would be very nice to have different icons for these two different statuses.
After upgrading Jenkins from 1.658 to 2.7 and Dashboard View Plugin from 2.9.7 to 2.9.10, the folders do not appear in a job list created in the Dashboard View.
Steps to reproduce :
Playing with other filters, or manually selecting the folders to display doesn't work either.
Hi,
There is a problem in the latest release:
If you have job that history is kept let say for 14 days and it was never been green the "Test Statistics Grid" shows all in "0" and "0%" including total as 0 tests
PS: here is a screenshot with calculations to confirm the bug - http://screencast.com/t/1QkzO8Ggy - the stats are completely wrong
I'm trying to use the dashboard-view "Test Statistics Grid" portlet, and I've noticed that it is double counting tests where the jobs use "Aggregate downstream test results". I have one main job with three downstream jobs. The main job has a few tests, but the majority of the tests are in the three downstream jobs. Presumably because Hudson is aggregating the test results, I am seeing double counts in the portlet. I would have expected it to count any given test only once.
In actuality, my main job has 4 tests, and the three sub jobs have 684 tests in total. dashboard-view is reporting that the main job has 684 tests (so it is counting the subs, but not its own), in addition to the sub jobs, for a total of 1368 tests.
It seems Hudson itself does not report the 4 tests in main in the Aggregated Test Result, so perhaps missing those is not the fault of dashboard-view. However, I should note, the "Test Trend Chart" portlet gives the correct numbers (684 without the main included, 688 with).
Please let me know if anything should be tried or you need more information.
I've pasted the table generated below, although I fear it will be difficult to read.
Test Statistics Grid
Job Success Failed Skipped Total
The static analysis dashboard-view portlet doesn't pick up the styling of the current custom css.

Tried with:
The test statistics grid portlet shows the same behavior, so maybe it is related to dashboard view and not the warnings-ng portlet.
An issue has also been filed at: TobiX/jenkins-neo2-theme#13
Test Statistics Grid is not updating at all for some reason for my pipeline jobs, which call a jenkins file from SCM.
Also, when I click on "Hide projects with no tests", the rows disappear. I suspect this is a clue to the root cause of the issue or defect.
When clicking on the "schedule build" button in the dashboard, a tooltip "build scheduled" appears. This tooltip covers the next "schedule build" button, so I cannot schedule multiple builds in succession without waiting for the tooltip to disappear ..... very frustrating when I have deadlines causing me massive amounts of stress as it is......
If a Job changes its state, all entries of this job in "Latest builds" portlet are prefixed with the same Icon (e.g flashing for "currently working").
It may be better to take the state of the build number as value for displaying the state of the Job entry. (as it is done in the "Build" column.)
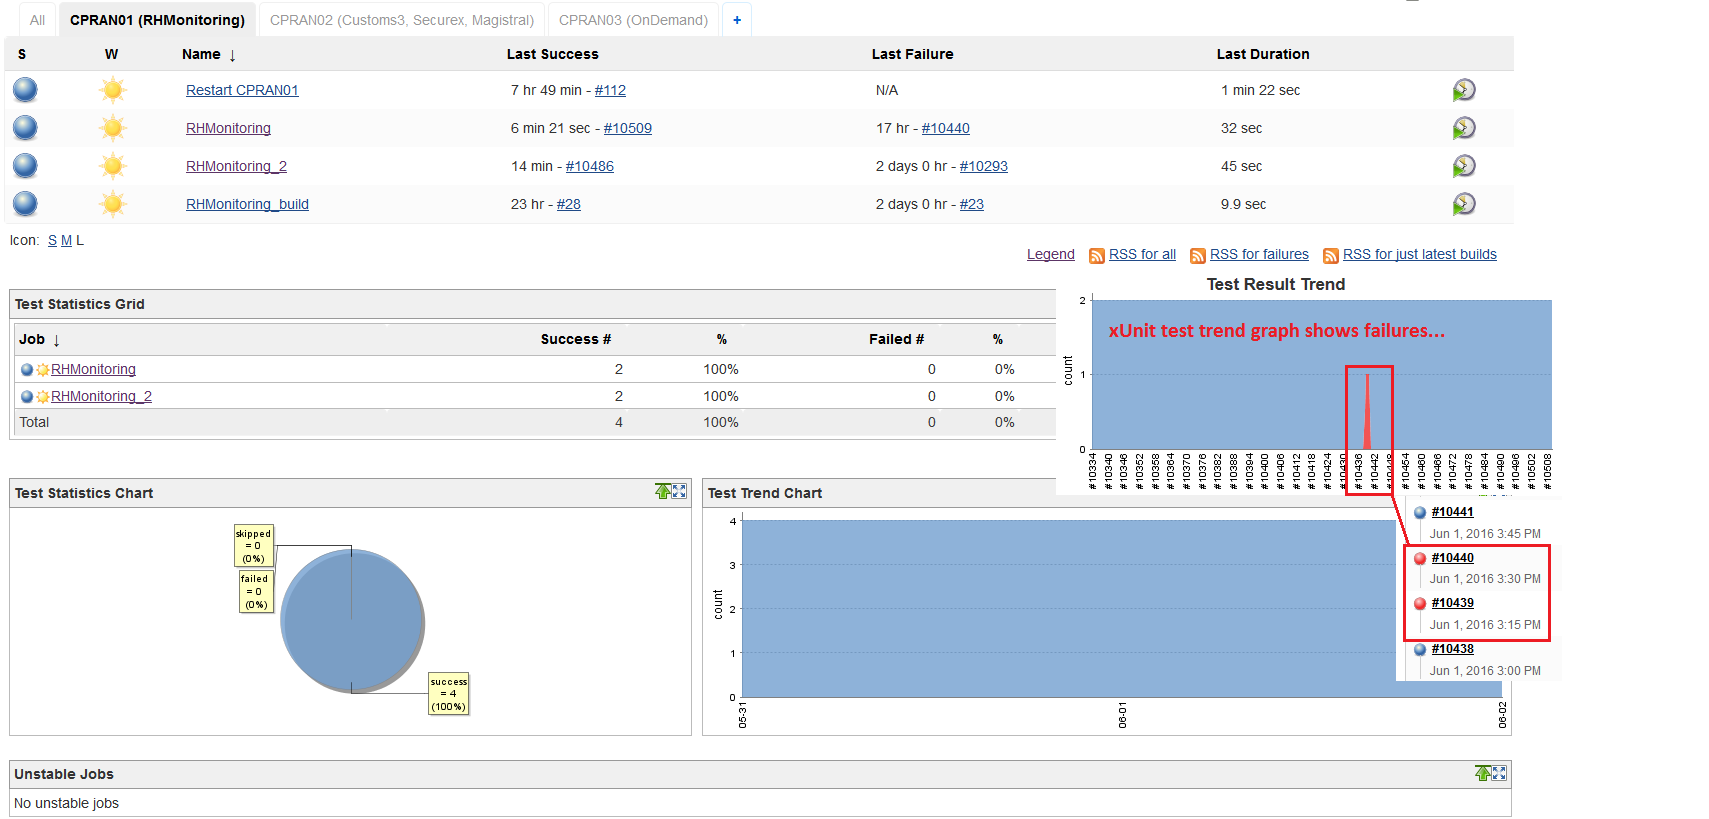
Test Trend Chart and Statistics Chart shows "0" failed tests but there were failures during the days displayed in both chart. Please see the screenshot, which shows dashboard's Test Trend chart compared to "Build History" and xUnit's "Test Result Trend" chart, which shows two failures...
I'm experiencing also another problem (maybe related), which shows only small amount of days in Test Trend Chart. I've posted about it here:
https://issues.jenkins-ci.org/browse/JENKINS-35268
Assigning size by pixels is not as useful as percents. People have differing screen sizes and making it use percents would help accommodate this.
CONOPS, you are looking at a job, you want where that job contributes. E.g. jobs are grouped by feature or tool or branch etc and you have dashboards for each group. You want to see how this job was comparative to similar jobs on other branches, or how it contributed to overall health of feature etc.
If you go from a dashboard to a job, you can back out to only that dash, not all other dashboards the job may be present in.
One possible way is to use something like what the build history uses, a box with a list in it of all dashboards, there are probably 2 or 3 other was to decorate the job page...
I have 3 different views, each view contains between 1-3 test jobs. The Test Trend Chart shows just one day for two views (with 2 or 3 test jobs), while the Test Trend Chart in one particular view shows 8 days? However, neither number of days reflects "Number of (latest) days to display", which I have 14 days for each view?
So based of which number/Jenkins setting does Test Trend Chart display its history?
we have jobs that simply run junits and publish it to jenkins.
The Test result anylser shows good results and also the dashboard-view test-statistics-trend, but the test-statistics chart and test-statistics grid show empty result (all 0 in grid and empty view in chart)
in the log the only warning we have that looks relevant is :
May 10, 2015 4:44:08 PM org.kohsuke.stapler.RequestImpl$TypePair convertJSON
WARNING : 'stapler-class' is deprecated: hudson.veiws.JobColmnMay 10, 2015 4:44:08 PM org.kohsuke.stapler.RequestImpl$TypePair convertJSON
WARNING : 'stapler-class' is deprecated: hudson.veiws.LastSucessColumn
May 10, 2015 4:44:08 PM org.kohsuke.stapler.RequestImpl$TypePair convertJSON
WARNING : 'stapler-class' is deprecated: hudson.veiws.LastFailureColumn
May 10, 2015 4:44:08 PM org.kohsuke.stapler.RequestImpl$TypePair convertJSON
WARNING : 'stapler-class' is deprecated: hudson.veiws.LastDurationColumn
May 10, 2015 4:44:08 PM org.kohsuke.stapler.RequestImpl$TypePair convertJSON
WARNING : 'stapler-class' is deprecated: hudson.veiws.BuildButtonColumn
May 10, 2015 4:44:08 PM org.kohsuke.stapler.RequestImpl$TypePair convertJSON
WARNING : 'stapler-class' is deprecated: hudson.plugins.view.dashboard.core.JudsonStdJobsPortlet
May 10, 2015 4:44:08 PM org.kohsuke.stapler.RequestImpl$TypePair convertJSON
WARNING : 'stapler-class' is deprecated: hudson.plugins.view.dashboard.test.TestStatisticsPortlet
May 10, 2015 4:44:08 PM org.kohsuke.stapler.RequestImpl$TypePair convertJSON
WARNING : 'stapler-class' is deprecated: hudson.plugins.view.dashboard.test.TestTrendChart
May 10, 2015 4:44:08 PM org.kohsuke.stapler.RequestImpl$TypePair convertJSON
WARNING : 'stapler-class' is deprecated: hudson.plugins.view.dashboard.test.TestStatistics.Chart
It looks like the chart and grid has vaules but don't show it since they can't convert the values to numbers so the can't calulates the odds that needed for results.
It is critical for us since with out it we will not use jenkins as bug tracking system and we will look for other way of showing test statistics
We have no url since the site is internal site in our environment that is not exposed over the internet
Regards
Danny
all slaves of 2008R2 & 2012 that connect using JNLP display as disconnected although they are connected.
On the dashboard view (Jobs Grid) the link to the jobs do not work together with the CloudBees Folder Plug In. When I select a link I always get HTTP ERROR 404 with a wrong link.
It seems that this view can not solve nested folders.
When a job is running the current day uses zero for all its test results (passed/failed/skipped). This results in a test trend chart that constantly has a huge dip for the current day because tests are always running. In the pic attached the tests job with 100 failures is running; which makes us look good--but we aren't.
The test statistics pie chart doesn't do this. The results of all last completed builds are used.
The analysis plug-ins provides several portlets with user configurable width and height. Since the width of a portlet depends on the screen resolution and the number of columns it would be nice if the default width for a portlet graph would be available as a variable in the jelly scripts (at least a default width for single or double column display would be nice).
(The same would be good for the height, too. Here at least a default height would be nice to have.)
As the screenshot demonstrate, the total count of tests is in my suite 8138 but the Trend Chart shows me more then 9000 tests.
Settings: "640x220", "All Tests" in the last "30" days
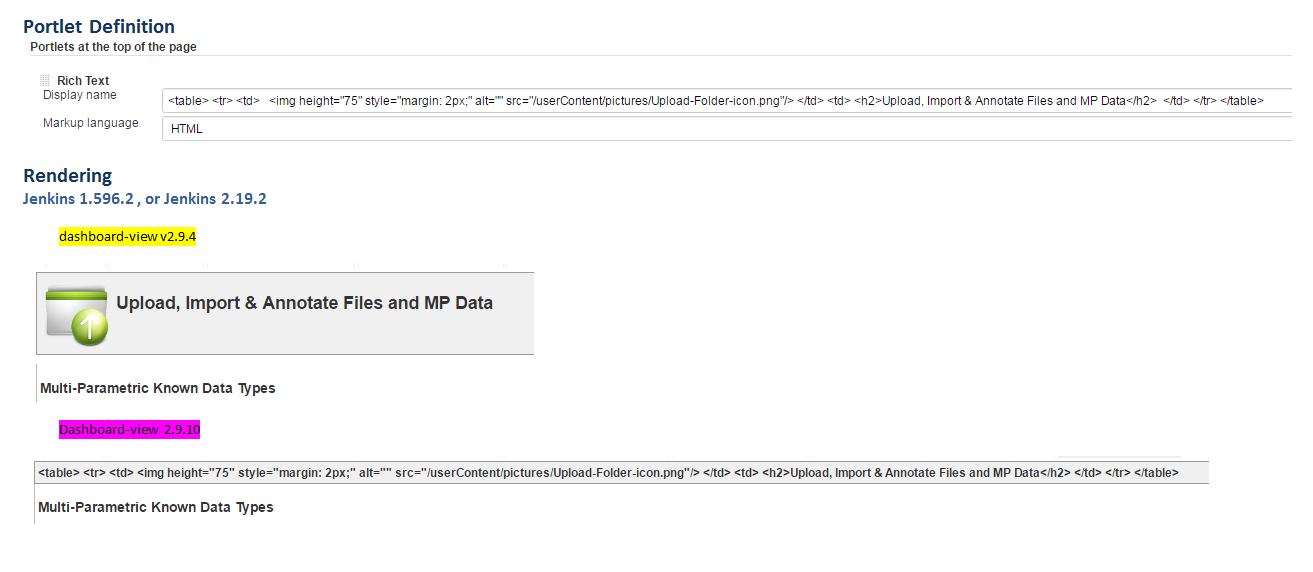
Dashboard View Plugin v2.9.10: Does not render HTML in 'Display Name' section
This was very helpful to customize the portlets. Plugin versions up to v2.9.7 correctly render the HTML.
When triggering a parameterized build using the button from the dashboard the view returns to the project page after the parameters are entered and build is triggered. It should return back to the dashboard instead. This is particularly inconvenient when trying to trigger multiple parameterized builds.
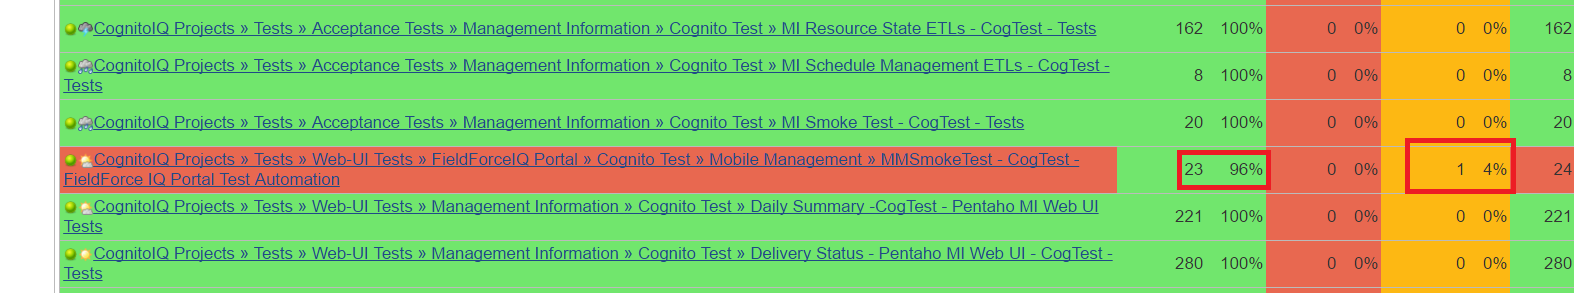
As you can see in the attached screenshot, it shouldn't highlight builds with no test failures but skipped tests as red! Or at least have it customisable so we can choose in the configuration whether we want it marked as red or not.
I have created a Dashboard View and added the Build Statistics portlet to the page. I have pointed the view at a pipeline (workflow) job with ~ 100 builds in it's history. The Build Statistics portlet only shows 9 builds.
Is the Dashboard View compatible with pipeline type jobs?
Status Code: 500Exception: java.lang.NullPointerException
Stacktrace:
javax.servlet.ServletException: java.lang.NullPointerException
at org.kohsuke.stapler.Stapler.tryInvoke(Stapler.java:778)
at org.kohsuke.stapler.Stapler.invoke(Stapler.java:858)
at org.kohsuke.stapler.Stapler.invoke(Stapler.java:631)
at org.kohsuke.stapler.Stapler.service(Stapler.java:225)
at javax.servlet.http.HttpServlet.service(HttpServlet.java:848)
at org.eclipse.jetty.servlet.ServletHolder.handle(ServletHolder.java:686)
at org.eclipse.jetty.servlet.ServletHandler$CachedChain.doFilter(ServletHandler.java:1494)
at hudson.util.PluginServletFilter$1.doFilter(PluginServletFilter.java:96)
at hudson.util.PluginServletFilter.doFilter(PluginServletFilter.java:88)
at org.eclipse.jetty.servlet.ServletHandler$CachedChain.doFilter(ServletHandler.java:1482)
at hudson.security.csrf.CrumbFilter.doFilter(CrumbFilter.java:48)
at org.eclipse.jetty.servlet.ServletHandler$CachedChain.doFilter(ServletHandler.java:1482)
at hudson.security.HudsonFilter.doFilter(HudsonFilter.java:162)
at org.eclipse.jetty.servlet.ServletHandler$CachedChain.doFilter(ServletHandler.java:1482)
at org.kohsuke.stapler.compression.CompressionFilter.doFilter(CompressionFilter.java:46)
at org.eclipse.jetty.servlet.ServletHandler$CachedChain.doFilter(ServletHandler.java:1482)
at hudson.util.CharacterEncodingFilter.doFilter(CharacterEncodingFilter.java:81)
at org.eclipse.jetty.servlet.ServletHandler$CachedChain.doFilter(ServletHandler.java:1474)
at org.eclipse.jetty.servlet.ServletHandler.doHandle(ServletHandler.java:499)
at org.eclipse.jetty.server.handler.ScopedHandler.handle(ScopedHandler.java:137)
at org.eclipse.jetty.security.SecurityHandler.handle(SecurityHandler.java:533)
at org.eclipse.jetty.server.session.SessionHandler.doHandle(SessionHandler.java:231)
at org.eclipse.jetty.server.handler.ContextHandler.doHandle(ContextHandler.java:1086)
at org.eclipse.jetty.servlet.ServletHandler.doScope(ServletHandler.java:428)
at org.eclipse.jetty.server.session.SessionHandler.doScope(SessionHandler.java:193)
at org.eclipse.jetty.server.handler.ContextHandler.doScope(ContextHandler.java:1020)
at org.eclipse.jetty.server.handler.ScopedHandler.handle(ScopedHandler.java:135)
at org.eclipse.jetty.server.handler.HandlerWrapper.handle(HandlerWrapper.java:116)
at org.eclipse.jetty.server.Server.handle(Server.java:370)
at org.eclipse.jetty.server.AbstractHttpConnection.handleRequest(AbstractHttpConnection.java:489)
at org.eclipse.jetty.server.AbstractHttpConnection.headerComplete(AbstractHttpConnection.java:949)
at org.eclipse.jetty.server.AbstractHttpConnection$RequestHandler.headerComplete(AbstractHttpConnection.java:1011)
at org.eclipse.jetty.http.HttpParser.parseNext(HttpParser.java:644)
at org.eclipse.jetty.http.HttpParser.parseAvailable(HttpParser.java:235)
at org.eclipse.jetty.server.AsyncHttpConnection.handle(AsyncHttpConnection.java:82)
at org.eclipse.jetty.io.nio.SelectChannelEndPoint.handle(SelectChannelEndPoint.java:668)
at org.eclipse.jetty.io.nio.SelectChannelEndPoint$1.run(SelectChannelEndPoint.java:52)
at winstone.BoundedExecutorService$1.run(BoundedExecutorService.java:77)
at java.util.concurrent.ThreadPoolExecutor.runWorker(ThreadPoolExecutor.java:1146)
at java.util.concurrent.ThreadPoolExecutor$Worker.run(ThreadPoolExecutor.java:615)
at java.lang.Thread.run(Thread.java:679)
Caused by: java.lang.NullPointerException
at hudson.util.ErrorObject.doDynamic(ErrorObject.java:41)
at sun.reflect.GeneratedMethodAccessor3.invoke(Unknown Source)
at sun.reflect.DelegatingMethodAccessorImpl.invoke(DelegatingMethodAccessorImpl.java:43)
at java.lang.reflect.Method.invoke(Method.java:616)
at org.kohsuke.stapler.Function$InstanceFunction.invoke(Function.java:298)
at org.kohsuke.stapler.Function.bindAndInvoke(Function.java:161)
at org.kohsuke.stapler.Function.bindAndInvokeAndServeResponse(Function.java:96)
at org.kohsuke.stapler.MetaClass$11.dispatch(MetaClass.java:370)
at org.kohsuke.stapler.Stapler.tryInvoke(Stapler.java:728)
... 40 more
Dec 11, 2013 4:12:58 PM hudson.ExpressionFactory2$JexlExpression evaluate
WARNING: Caught exception evaluating: it.getBuildStat(jobs) in /. Reason: java.lang.NullPointerException
java.lang.NullPointerException
	at hudson.model.RunMap.getNumberOf(RunMap.java:167)
	at hudson.model.RunMap.getNumberOf(RunMap.java:59)
	at jenkins.model.lazy.AbstractLazyLoadRunMap.subMap(AbstractLazyLoadRunMap.java:296)
	at jenkins.model.lazy.AbstractLazyLoadRunMap.headMap(AbstractLazyLoadRunMap.java:304)
	at jenkins.model.lazy.AbstractLazyLoadRunMap.headMap(AbstractLazyLoadRunMap.java:103)
	at java.util.Collections$UnmodifiableSortedMap.headMap(Collections.java:1500)
	at hudson.plugins.view.dashboard.stats.StatBuilds.getBuildStat(StatBuilds.java:48)
	at sun.reflect.NativeMethodAccessorImpl.invoke0(Native Method)
	at sun.reflect.NativeMethodAccessorImpl.invoke(NativeMethodAccessorImpl.java:57)
	at sun.reflect.DelegatingMethodAccessorImpl.invoke(DelegatingMethodAccessorImpl.java:43)
	at java.lang.reflect.Method.invoke(Method.java:616)
	at org.apache.commons.jexl.util.introspection.UberspectImpl$VelMethodImpl.invoke(UberspectImpl.java:258)
	at org.apache.commons.jexl.parser.ASTMethod.execute(ASTMethod.java:104)
	at org.apache.commons.jexl.parser.ASTReference.execute(ASTReference.java:83)
	at org.apache.commons.jexl.parser.ASTReference.value(ASTReference.java:57)
	at org.apache.commons.jexl.parser.ASTReferenceExpression.value(ASTReferenceExpression.java:51)
	at org.apache.commons.jexl.ExpressionImpl.evaluate(ExpressionImpl.java:80)
	at hudson.ExpressionFactory2$JexlExpression.evaluate(ExpressionFactory2.java:74)
	at org.apache.commons.jelly.tags.core.CoreTagLibrary$3.run(CoreTagLibrary.java:134)
	at org.apache.commons.jelly.impl.ScriptBlock.run(ScriptBlock.java:95)
	at org.apache.commons.jelly.tags.core.CoreTagLibrary$2.run(CoreTagLibrary.java:105)
	at org.kohsuke.stapler.jelly.JellyViewScript.run(JellyViewScript.java:81)
	at org.kohsuke.stapler.jelly.IncludeTag.doTag(IncludeTag.java:147)
	at org.apache.commons.jelly.impl.TagScript.run(TagScript.java:269)
	at org.kohsuke.stapler.jelly.ReallyStaticTagLibrary$1.run(ReallyStaticTagLibrary.java:99)
	at org.kohsuke.stapler.jelly.ReallyStaticTagLibrary$1.run(ReallyStaticTagLibrary.java:99)
	at org.kohsuke.stapler.jelly.ReallyStaticTagLibrary$1.run(ReallyStaticTagLibrary.java:99)
	at org.kohsuke.stapler.jelly.CallTagLibScript$1.run(CallTagLibScript.java:99)
	at org.apache.commons.jelly.tags.define.InvokeBodyTag.doTag(InvokeBodyTag.java:91)
	at org.apache.commons.jelly.impl.TagScript.run(TagScript.java:269)
	at org.kohsuke.stapler.jelly.ReallyStaticTagLibrary$1.run(ReallyStaticTagLibrary.java:99)
	at org.apache.commons.jelly.impl.ScriptBlock.run(ScriptBlock.java:95)
	at org.kohsuke.stapler.jelly.ReallyStaticTagLibrary$1.run(ReallyStaticTagLibrary.java:99)
	at org.apache.commons.jelly.impl.ScriptBlock.run(ScriptBlock.java:95)
	at org.apache.commons.jelly.tags.core.CoreTagLibrary$2.run(CoreTagLibrary.java:105)
	at org.kohsuke.stapler.jelly.CallTagLibScript.run(CallTagLibScript.java:120)
	at org.apache.commons.jelly.tags.core.CoreTagLibrary$2.run(CoreTagLibrary.java:105)
	at org.kohsuke.stapler.jelly.JellyViewScript.run(JellyViewScript.java:81)
	at org.kohsuke.stapler.jelly.IncludeTag.doTag(IncludeTag.java:147)
	at org.apache.commons.jelly.impl.TagScript.run(TagScript.java:269)
	at org.apache.commons.jelly.impl.ScriptBlock.run(ScriptBlock.java:95)
	at org.apache.commons.jelly.TagSupport.invokeBody(TagSupport.java:161)
	at org.apache.commons.jelly.tags.core.ForEachTag.doTag(ForEachTag.java:150)
	at org.apache.commons.jelly.impl.TagScript.run(TagScript.java:269)
	at org.kohsuke.stapler.jelly.ReallyStaticTagLibrary$1.run(ReallyStaticTagLibrary.java:99)
	at org.apache.commons.jelly.tags.core.CoreTagLibrary$1.run(CoreTagLibrary.java:98)
	at org.apache.commons.jelly.impl.ScriptBlock.run(ScriptBlock.java:95)
	at org.kohsuke.stapler.jelly.ReallyStaticTagLibrary$1.run(ReallyStaticTagLibrary.java:99)
	at org.kohsuke.stapler.jelly.ReallyStaticTagLibrary$1.run(ReallyStaticTagLibrary.java:99)
	at org.kohsuke.stapler.jelly.ReallyStaticTagLibrary$1.run(ReallyStaticTagLibrary.java:99)
	at org.apache.commons.jelly.impl.ScriptBlock.run(ScriptBlock.java:95)
	at org.apache.commons.jelly.TagSupport.invokeBody(TagSupport.java:161)
	at org.apache.commons.jelly.tags.core.OtherwiseTag.doTag(OtherwiseTag.java:41)
	at org.apache.commons.jelly.impl.TagScript.run(TagScript.java:269)
	at org.apache.commons.jelly.impl.ScriptBlock.run(ScriptBlock.java:95)
	at org.apache.commons.jelly.TagSupport.invokeBody(TagSupport.java:161)
	at org.apache.commons.jelly.tags.core.ChooseTag.doTag(ChooseTag.java:38)
	at org.apache.commons.jelly.impl.TagScript.run(TagScript.java:269)
	at org.apache.commons.jelly.impl.ScriptBlock.run(ScriptBlock.java:95)
	at org.apache.commons.jelly.tags.core.CoreTagLibrary$2.run(CoreTagLibrary.java:105)
	at org.kohsuke.stapler.jelly.JellyViewScript.run(JellyViewScript.java:81)
	at org.kohsuke.stapler.jelly.IncludeTag.doTag(IncludeTag.java:147)
	at org.apache.commons.jelly.impl.TagScript.run(TagScript.java:269)
	at org.apache.commons.jelly.impl.ScriptBlock.run(ScriptBlock.java:95)
	at org.kohsuke.stapler.jelly.CallTagLibScript$1.run(CallTagLibScript.java:99)
	at org.apache.commons.jelly.tags.define.InvokeBodyTag.doTag(InvokeBodyTag.java:91)
	at org.apache.commons.jelly.impl.TagScript.run(TagScript.java:269)
	at org.apache.commons.jelly.impl.ScriptBlock.run(ScriptBlock.java:95)
	at org.apache.commons.jelly.tags.core.CoreTagLibrary$1.run(CoreTagLibrary.java:98)
	at org.apache.commons.jelly.impl.ScriptBlock.run(ScriptBlock.java:95)
	at org.apache.commons.jelly.tags.core.CoreTagLibrary$2.run(CoreTagLibrary.java:105)
	at org.kohsuke.stapler.jelly.CallTagLibScript.run(CallTagLibScript.java:120)
	at org.apache.commons.jelly.impl.ScriptBlock.run(ScriptBlock.java:95)
	at org.kohsuke.stapler.jelly.CallTagLibScript$1.run(CallTagLibScript.java:99)
	at org.apache.commons.jelly.tags.define.InvokeBodyTag.doTag(InvokeBodyTag.java:91)
	at org.apache.commons.jelly.impl.TagScript.run(TagScript.java:269)
	at org.apache.commons.jelly.impl.ScriptBlock.run(ScriptBlock.java:95)
	at org.kohsuke.stapler.jelly.ReallyStaticTagLibrary$1.run(ReallyStaticTagLibrary.java:99)
	at org.apache.commons.jelly.impl.ScriptBlock.run(ScriptBlock.java:95)
	at org.kohsuke.stapler.jelly.ReallyStaticTagLibrary$1.run(ReallyStaticTagLibrary.java:99)
	at org.kohsuke.stapler.jelly.ReallyStaticTagLibrary$1.run(ReallyStaticTagLibrary.java:99)
	at org.apache.commons.jelly.impl.ScriptBlock.run(ScriptBlock.java:95)
	at org.kohsuke.stapler.jelly.ReallyStaticTagLibrary$1.run(ReallyStaticTagLibrary.java:99)
	at org.apache.commons.jelly.impl.ScriptBlock.run(ScriptBlock.java:95)
	at org.kohsuke.stapler.jelly.ReallyStaticTagLibrary$1.run(ReallyStaticTagLibrary.java:99)
	at org.apache.commons.jelly.impl.ScriptBlock.run(ScriptBlock.java:95)
	at org.apache.commons.jelly.tags.core.CoreTagLibrary$2.run(CoreTagLibrary.java:105)
	at org.kohsuke.stapler.jelly.CallTagLibScript.run(CallTagLibScript.java:120)
	at org.kohsuke.stapler.jelly.CompressTag.doTag(CompressTag.java:44)
	at org.apache.commons.jelly.impl.TagScript.run(TagScript.java:269)
	at org.kohsuke.stapler.jelly.JellyViewScript.run(JellyViewScript.java:81)
	at org.kohsuke.stapler.jelly.DefaultScriptInvoker.invokeScript(DefaultScriptInvoker.java:63)
	at org.kohsuke.stapler.jelly.DefaultScriptInvoker.invokeScript(DefaultScriptInvoker.java:53)
	at org.kohsuke.stapler.jelly.JellyClassTearOff.serveIndexJelly(JellyClassTearOff.java:112)
	at org.kohsuke.stapler.jelly.JellyFacet.handleIndexRequest(JellyFacet.java:127)
	at org.kohsuke.stapler.Stapler.tryInvoke(Stapler.java:717)
	at org.kohsuke.stapler.Stapler.invoke(Stapler.java:858)
	at org.kohsuke.stapler.Stapler.tryInvoke(Stapler.java:795)
	at org.kohsuke.stapler.Stapler.invoke(Stapler.java:858)
	at org.kohsuke.stapler.Stapler.invoke(Stapler.java:631)
	at org.kohsuke.stapler.Stapler.service(Stapler.java:225)
	at javax.servlet.http.HttpServlet.service(HttpServlet.java:848)
	at org.eclipse.jetty.servlet.ServletHolder.handle(ServletHolder.java:686)
	at org.eclipse.jetty.servlet.ServletHandler$CachedChain.doFilter(ServletHandler.java:1494)
	at hudson.util.PluginServletFilter$1.doFilter(PluginServletFilter.java:96)
	at net.bull.javamelody.MonitoringFilter.doFilter(MonitoringFilter.java:203)
	at net.bull.javamelody.MonitoringFilter.doFilter(MonitoringFilter.java:181)
	at net.bull.javamelody.PluginMonitoringFilter.doFilter(PluginMonitoringFilter.java:86)
	at org.jvnet.hudson.plugins.monitoring.HudsonMonitoringFilter.doFilter(HudsonMonitoringFilter.java:84)
	at hudson.util.PluginServletFilter$1.doFilter(PluginServletFilter.java:99)
	at hudson.plugins.greenballs.GreenBallFilter.doFilter(GreenBallFilter.java:58)
	at hudson.util.PluginServletFilter$1.doFilter(PluginServletFilter.java:99)
	at hudson.plugins.audit_trail.AuditTrailFilter.doFilter(AuditTrailFilter.java:66)
	at hudson.util.PluginServletFilter$1.doFilter(PluginServletFilter.java:99)
	at hudson.util.PluginServletFilter.doFilter(PluginServletFilter.java:88)
	at org.eclipse.jetty.servlet.ServletHandler$CachedChain.doFilter(ServletHandler.java:1482)
	at hudson.security.csrf.CrumbFilter.doFilter(CrumbFilter.java:91)
	at org.eclipse.jetty.servlet.ServletHandler$CachedChain.doFilter(ServletHandler.java:1482)
	at hudson.security.ChainedServletFilter$1.doFilter(ChainedServletFilter.java:84)
	at hudson.security.UnwrapSecurityExceptionFilter.doFilter(UnwrapSecurityExceptionFilter.java:51)
	at hudson.security.ChainedServletFilter$1.doFilter(ChainedServletFilter.java:87)
	at jenkins.security.ExceptionTranslationFilter.doFilter(ExceptionTranslationFilter.java:117)
	at hudson.security.ChainedServletFilter$1.doFilter(ChainedServletFilter.java:87)
	at org.acegisecurity.providers.anonymous.AnonymousProcessingFilter.doFilter(AnonymousProcessingFilter.java:125)
	at hudson.security.ChainedServletFilter$1.doFilter(ChainedServletFilter.java:87)
	at org.acegisecurity.ui.rememberme.RememberMeProcessingFilter.doFilter(RememberMeProcessingFilter.java:135)
	at hudson.security.ChainedServletFilter$1.doFilter(ChainedServletFilter.java:87)
	at org.acegisecurity.ui.AbstractProcessingFilter.doFilter(AbstractProcessingFilter.java:271)
	at hudson.security.ChainedServletFilter$1.doFilter(ChainedServletFilter.java:87)
	at org.acegisecurity.ui.basicauth.BasicProcessingFilter.doFilter(BasicProcessingFilter.java:174)
	at hudson.security.ChainedServletFilter$1.doFilter(ChainedServletFilter.java:87)
	at jenkins.security.ApiTokenFilter.doFilter(ApiTokenFilter.java:64)
	at hudson.security.ChainedServletFilter$1.doFilter(ChainedServletFilter.java:87)
	at org.acegisecurity.context.HttpSessionContextIntegrationFilter.doFilter(HttpSessionContextIntegrationFilter.java:249)
	at hudson.security.HttpSessionContextIntegrationFilter2.doFilter(HttpSessionContextIntegrationFilter2.java:67)
	at hudson.security.ChainedServletFilter$1.doFilter(ChainedServletFilter.java:87)
	at hudson.security.ChainedServletFilter.doFilter(ChainedServletFilter.java:76)
	at hudson.security.HudsonFilter.doFilter(HudsonFilter.java:164)
	at org.eclipse.jetty.servlet.ServletHandler$CachedChain.doFilter(ServletHandler.java:1482)
	at org.kohsuke.stapler.compression.CompressionFilter.doFilter(CompressionFilter.java:46)
	at org.eclipse.jetty.servlet.ServletHandler$CachedChain.doFilter(ServletHandler.java:1482)
	at hudson.util.CharacterEncodingFilter.doFilter(CharacterEncodingFilter.java:81)
	at org.eclipse.jetty.servlet.ServletHandler$CachedChain.doFilter(ServletHandler.java:1474)
	at org.eclipse.jetty.servlet.ServletHandler.doHandle(ServletHandler.java:499)
	at org.eclipse.jetty.server.handler.ScopedHandler.handle(ScopedHandler.java:137)
	at org.eclipse.jetty.security.SecurityHandler.handle(SecurityHandler.java:533)
	at org.eclipse.jetty.server.session.SessionHandler.doHandle(SessionHandler.java:231)
	at org.eclipse.jetty.server.handler.ContextHandler.doHandle(ContextHandler.java:1086)
	at org.eclipse.jetty.servlet.ServletHandler.doScope(ServletHandler.java:428)
	at org.eclipse.jetty.server.session.SessionHandler.doScope(SessionHandler.java:193)
	at org.eclipse.jetty.server.handler.ContextHandler.doScope(ContextHandler.java:1020)
	at org.eclipse.jetty.server.handler.ScopedHandler.handle(ScopedHandler.java:135)
	at org.eclipse.jetty.server.handler.HandlerWrapper.handle(HandlerWrapper.java:116)
	at org.eclipse.jetty.server.Server.handle(Server.java:370)
	at org.eclipse.jetty.server.AbstractHttpConnection.handleRequest(AbstractHttpConnection.java:489)
	at org.eclipse.jetty.server.AbstractHttpConnection.headerComplete(AbstractHttpConnection.java:949)
	at org.eclipse.jetty.server.AbstractHttpConnection$RequestHandler.headerComplete(AbstractHttpConnection.java:1011)
	at org.eclipse.jetty.http.HttpParser.parseNext(HttpParser.java:644)
	at org.eclipse.jetty.http.HttpParser.parseAvailable(HttpParser.java:235)
	at org.eclipse.jetty.server.AsyncHttpConnection.handle(AsyncHttpConnection.java:82)
	at org.eclipse.jetty.io.nio.SelectChannelEndPoint.handle(SelectChannelEndPoint.java:668)
	at org.eclipse.jetty.io.nio.SelectChannelEndPoint$1.run(SelectChannelEndPoint.java:52)
	at winstone.BoundedExecutorService$1.run(BoundedExecutorService.java:77)
	at java.util.concurrent.ThreadPoolExecutor.runWorker(ThreadPoolExecutor.java:1146)
	at java.util.concurrent.ThreadPoolExecutor$Worker.run(ThreadPoolExecutor.java:615)
	at java.lang.Thread.run(Thread.java:679)
I've installed the dashboard plugin and created a new view for the dashboard. In the new view i was able to add a "dasbboard view" which consists of a "pipeline view" and other portlets. Things are working fine until now. Instead of over populating my jenkins main view with too many tabs i decide to have nested views, and within the nested view i started creating dashboard views. The capability of adding the pipeline view as one of the portlet is not available when i go with nested view. The pipeline portlet view is only available when i go with the main view.
Hope the above is clear, if not please feel free to let me know i'll add more info to the above.
A declarative, efficient, and flexible JavaScript library for building user interfaces.
🖖 Vue.js is a progressive, incrementally-adoptable JavaScript framework for building UI on the web.
TypeScript is a superset of JavaScript that compiles to clean JavaScript output.
An Open Source Machine Learning Framework for Everyone
The Web framework for perfectionists with deadlines.
A PHP framework for web artisans
Bring data to life with SVG, Canvas and HTML. 📊📈🎉
JavaScript (JS) is a lightweight interpreted programming language with first-class functions.
Some thing interesting about web. New door for the world.
A server is a program made to process requests and deliver data to clients.
Machine learning is a way of modeling and interpreting data that allows a piece of software to respond intelligently.
Some thing interesting about visualization, use data art
Some thing interesting about game, make everyone happy.
We are working to build community through open source technology. NB: members must have two-factor auth.
Open source projects and samples from Microsoft.
Google ❤️ Open Source for everyone.
Alibaba Open Source for everyone
Data-Driven Documents codes.
China tencent open source team.