GithubHelp home page GithubHelp logo

jhen0409 / react-native-debugger Goto Github PK

View Code? Open in Web Editor NEW
10.3K 82.0 811.0 8.28 MB

The standalone app based on official debugger of React Native, and includes React Inspector / Redux DevTools

License: MIT License

JavaScript 97.59% HTML 0.19% Shell 2.22%
react-native debugger react-devtools redux-devtools-extension electron

react-native-debugger's Introduction

React Native Debugger

Backers on Open Collective Sponsors on Open Collective CI Status

โš ๏ธ This app is currently only supported old Remote Debugger, if you're looking for new debugger support (e.g. Hermes / JSI / New Architecture) of React Native Debugger, please follow discussion#774.

React Native Debugger

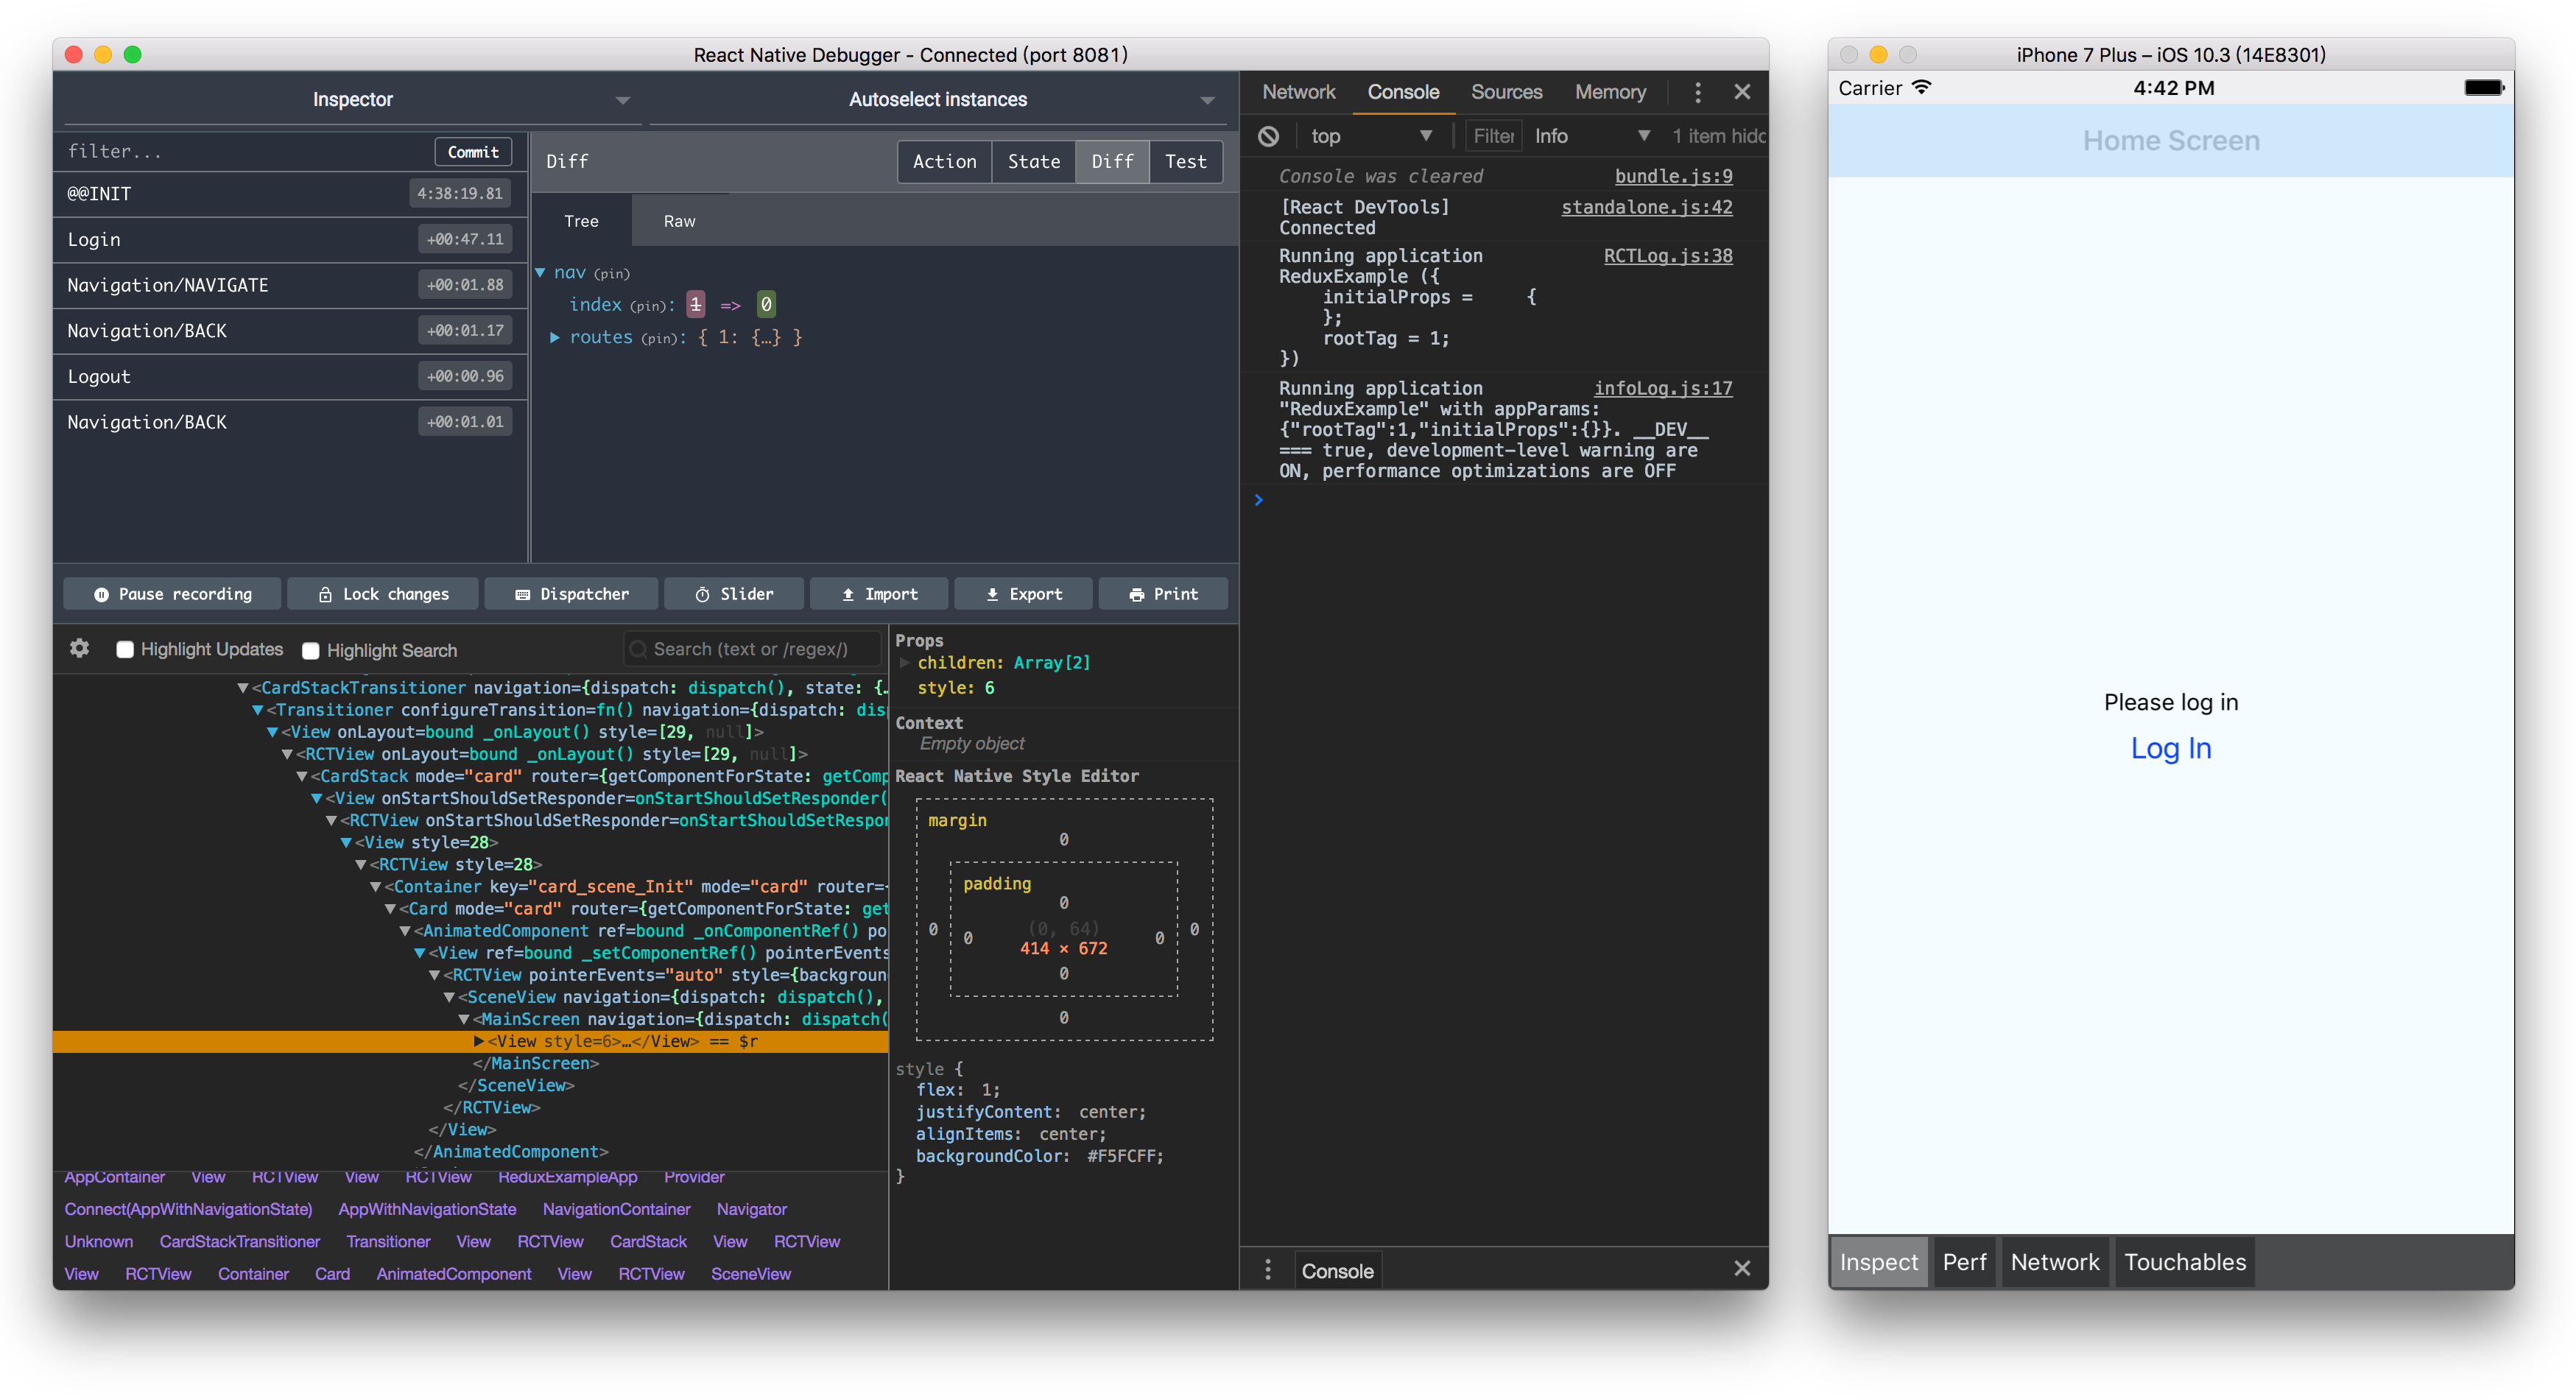
Run the redux example of react-navigation with Redux DevTools setup

This is a standalone app for debugging React Native apps:

Installation

To install the app, you can download a prebuilt binary from the release page.

For macOS, you can use Homebrew Cask to install:

< Homebrew 2.6.0

brew update && brew install --cask react-native-debugger

>= Homebrew 2.6.0

brew install --cask react-native-debugger

This puts React Native Debugger.app in your /applications/ folder.

NOTICE: React Native Compatibility

To use this app you need to ensure you are using the correct version of React Native Debugger and react-native:

React Native Debugger react-native
>= 0.11 >= 0.62
<= 0.10 <= 0.61

We used different auto-update feed for v0.10 and v0.11, so you won't see update tips of v0.11 from v0.10.

Install last release of v0.10 (0.10.7)

< Homebrew 2.6.0

brew update && brew cask install https://raw.githubusercontent.com/Homebrew/homebrew-cask/b6ac3795c1df9f97242481c0817b1165e3e6306a/Casks/react-native-debugger.rb

>= Homebrew 2.6.0

brew install --cask https://raw.githubusercontent.com/Homebrew/homebrew-cask/b6ac3795c1df9f97242481c0817b1165e3e6306a/Casks/react-native-debugger.rb

Arch-based distributions

You can install react-native-debugger-bin from Arch User Repository:

git clone https://aur.archlinux.org/react-native-debugger-bin.git
cd react-native-debugger-bin
makepkg -si

# or using AUR helper
paru -S react-native-debugger-bin

Build from source

Please read Development section in docs/contributing.md for how to build the app from source.

Documentation

Documentation (v0.10)

Please visit v0.10 branch.

Credits

Backers

Thank you to all our backers! ๐Ÿ™ [Become a backer]

Sponsors

Support this project by becoming a sponsor. Your logo will show up here with a link to your website. [Become a sponsor]

LICENSE

MIT

react-native-debugger's People

Contributors

1rahul1 avatar berndschrooten avatar bobbravo2 avatar changliuunsw avatar chinesedfan avatar cndw avatar dependabot[bot] avatar dps0340 avatar gongreg avatar hawkup avatar jhen0409 avatar kraffslol avatar kwv avatar letsila avatar lfkwtz avatar liuqiang1357 avatar nathanielongyiitak avatar orta avatar phil-flyclops avatar rafauke avatar richlloydmiles avatar ryancford avatar sebastianmaciel avatar skorotkiewicz avatar stanislavmayorov avatar stevenblack avatar sukkaw avatar tomauty avatar usamaliaquat123 avatar yuanchuan avatar

Stargazers

 avatar  avatar  avatar  avatar  avatar  avatar  avatar  avatar  avatar  avatar  avatar  avatar  avatar  avatar  avatar  avatar  avatar  avatar  avatar  avatar  avatar  avatar  avatar  avatar  avatar  avatar  avatar  avatar  avatar  avatar  avatar  avatar  avatar  avatar  avatar  avatar  avatar  avatar  avatar  avatar  avatar  avatar  avatar  avatar  avatar  avatar  avatar  avatar  avatar  avatar  avatar  avatar  avatar  avatar  avatar  avatar  avatar  avatar  avatar  avatar  avatar  avatar  avatar  avatar  avatar  avatar  avatar  avatar  avatar  avatar  avatar  avatar  avatar  avatar  avatar  avatar  avatar  avatar  avatar  avatar  avatar  avatar  avatar  avatar  avatar  avatar  avatar  avatar  avatar  avatar  avatar  avatar  avatar  avatar  avatar  avatar  avatar  avatar  avatar  avatar

Watchers

 avatar  avatar  avatar  avatar  avatar  avatar  avatar  avatar  avatar  avatar  avatar  avatar  avatar  avatar  avatar  avatar  avatar  avatar  avatar  avatar  avatar  avatar  avatar  avatar  avatar  avatar  avatar  avatar  avatar  avatar  avatar  avatar  avatar  avatar  avatar  avatar  avatar  avatar  avatar  avatar  avatar  avatar  avatar  avatar  avatar  avatar  avatar  avatar  avatar  avatar  avatar  avatar  avatar  avatar  avatar  avatar  avatar  avatar  avatar  avatar  avatar  avatar  avatar  avatar  avatar  avatar  avatar  avatar  avatar  avatar  avatar  avatar  avatar  avatar  avatar  avatar  avatar  avatar  avatar  avatar  avatar  avatar

react-native-debugger's Issues

binary / problem building

Hi,
Since documentation and release (and what's on homebrew) are not in-sync I'd suggest putting a new build or removing binaries completely, or maybe putting a note about the incompatibility. I just spent an hour trying to figure out why the 0.4.0 build isn't working :(

Continuing on, when trying to build, one of the requirements ([email protected]) needs a node version < 6.0.0, which means I had to fetch dependencies with my node 4.3.1 version, and then build with 6.0.0, since when building with 4.3.1 I got a broken app.

I'll happily upload the binary I just built somewhere if needed.

Can't connect with Android Emulator

Hi

React Native v^0.30
React Redux v^4.4.5

I try to use this tool for my React Native App, It works in iOS simulator, I reload JS, it connected with React Native Debugger. But in Android, It doesn't work, I started android app, the output as follow:

Starting JS server...
Running /Users/xnliu/Library/Android/sdk/platform-tools/adb reverse tcp:8081 tcp:8081
Building and installing the app on the device (cd android && ./gradlew installDebug...
Incremental java compilation is an incubating feature.
...
Installing APK 'app-debug.apk' on 'AVD_for_Nexus_5_by_Google(AVD) - 7.0' for app:debug
Installed on 1 device.

BUILD SUCCESSFUL

Total time: 12.302 secs

This build could be faster, please consider using the Gradle Daemon: https://docs.gradle.org/2.10/userguide/gradle_daemon.html
Starting the app on emulator-5554 (/Users/xnliu/Library/Android/sdk/platform-tools/adb -s emulator-5554 shell am start -n com.propertyfinder/.MainActivity)...
Starting: Intent { cmp=com.propertyfinder/.MainActivity }

but no matter how much times i reload JS, it never connected with React Native Debugger.

A weird thing is that I open http://localhost:8081/debugger-ui in chrome, It says Another Debugger is already connected. after I close React Native Debugger, the web page didn't say that anymore, It looks like React Native Debugger is really connect with the app just didn't show anything in Debugger UI.

Is there any additional setting for Android dedug?

Thank you!

Just wanna say this tool is amazing ๐Ÿ˜„ thanks so much!

No longer able to preview network response bodies after update to 0.6.0

After the recent update to v0.6.0 I can no longer see the preview or raw response body for network responses in the network tab. I can still see all of the request and response headers being logged, but as far as response bodies go, I just see the message, 'This request has no preview available.' in both the 'Preview' and 'Response' tabs.

I have confirmed that, by re-installing v0.5.6, I can once again see the response bodies. If it is of any help, I am using the snippet from the documentation to enable network logging, namely:

global.XMLHttpRequest = global.originalXMLHttpRequest ? global.originalXMLHttpRequest : global.XMLHttpRequest; global.FormData = global.originalFormData ? global.originalFormData : global.FormData;

That aside, this tool is great. Thanks for making it ๐Ÿ‘

React Native version: 0.41.2
Platform: iOS
Is real device of platform: No
Operating System: macOSX

How to view dimensions (height/width etc.) of an element

I've been using react-native-debugger without any issues for a while now, but one thing I haven't been able to figure out is how to view the dimensions (height/width etc.) of an element. When I click on an element in the hierarchy, the side panel shows the element name, props, and applied styles, but I can't find any way to see the actual rendered dimensions of the element. This is something that was possible to view when using the built in react-native inspector.

React Native version: 15.4.0
Platform: iOS
Is real device of platform: No, Simulator
Operating System: macOS

Slow AsyncStorage reading

React Native version: [0.43.4]
Platform: [IOS], Simulator
Operating System: [macOS]

Hello, in my app i use AsyncStorage.(get/set)Item Module for profile save (object with ~100 props)

Using RND: verry slow reading so in my case around 3-5 seconds
Using Chrome: normal 0.4-0.7 seconds

Any suggestions for fix it, really like this awesome debugger)
Thanks!

[Feature] Remember last state

In my project I don't use Redux, so I have to hide Redux DevTools always when I start React Native Debugger. It would be great if app will remeber my last toggled/untoggled tools.

6.0-beta1 stuck with "Waiting for React to connect..."

The Debug JS works, the packager is working, but the React / Redux tools doesn't load, it's stuck in "Waiting for React to connect" even though it's already being able to log and replay redux actions, and I can set breakpoints and it does work.

image

On windows 10 x64, node 7.50 and react-native 0.41.2 / react 15.4.2

Using a real device through Wifi (using adb tcpip 5555 / adb shell ip route / adb connect 192.168.0.109:5555

Cannot see the inspector

In the first load, the screen always shows a error as below:
screen shot 2017-02-03 at 5 21 58 pm

After pressing the 'Dismiss' button at the left bottom of the screen, the debugger can be used properly in some extent. However, the inspector show up a connecting forever and I am not able to inspect any component from the screen.

screen shot 2017-02-03 at 5 21 38 pm

Config

remotedev-debugger i would pass setup options as follows:

remotedev-debugger --hostname localhost --port 5678

How would you solve this issue with react-native-debugger?

Android App gets stuck while running react native debugger

React Native version: 0.39.2
Platform: Android
Is real device of platform: Yes
Operating System: Linux

-While debugging android application, app gets stuck often. Mostly, if we are using react native listview.
-Tried increasing the memory of the device, but it also doesn't work.
-Same application works fine with debugger on IOS platform.

[Feature] Stay in front

There is no way to turn on "Stay in front" option (or "Always on top")

For example it's possible to enable "Stay in front" option in Xcode Simulator app through Window > Stay in front

Error with redux-saga middleware

Noob here getting an error which seems to indicate that the saga middleware is not getting loaded properly with the store.

F:\Courses\react-native-redux\manager\node_modules\react-native\Libraries\Core\ExceptionsManager.js:71uncaught at check Before running a Saga, you must mount the Saga middleware on the Store using applyMiddleware

Here is my store setup:

/* eslint-disable no-underscore-dangle */
    const sagaMiddleware = createSagaMiddleware();
    const composeEnhancers = window.__REDUX_DEVTOOLS_EXTENSION__ || compose;
    const store = createStore(
        reducers,
        initialState,
        composeEnhancers(applyMiddleware(sagaMiddleware)),
      );
    sagaMiddleware.run(sagas);
/* eslint-enable */

global.reduxNativeDevTools is undefined

Hi,

I followed all of the instructions, and installed everything, but my React app is still opening the old/normal debugger window into Chrome.

I also notice that if I just run Node and look at global.reduxNativeDevTools, it's undefined.

What has to run to inject this into globals?

redux devtool doesn't get any data

Hi...

For some reason my redux devtool doesn't recieve any data. The JS developer tools and React Devtools works fine.

I am using the Apollo GraphQL redux middleware. Seems like that is the problem, but can't figure out how to fix or debug? Should the choice of middleware could be a problem for the redux messages in devtools?

I use the composeWithDevTools() arround the middleware.

Cheers
Peter

Change port of development console

Maybe I'm doing smth wrong but If I'm right I's not possible to choose port of development console now.

For example I have two development consoles opened on ports 8081 and 8085, and debugger automatically chooses 8081.

Is there a way to fix it?

iOS: Simulator socket connection times out due to debugger

Hi there! Thanks for the debugger, I use it daily and find it very helpful. ๐Ÿ˜€

After I rebuild in Xcode and launch the simulator, the socket connection to the debugger times out roughly 5 seconds after starting the app and the simulator crashes. Once I reload the simulator using command + R, I no longer have socket connection issues until the next time I rebuild.

Here's a screenshot of the crash screen on the simulator:
glass

Here are some excerpts from my Xcode log that may be helpful:

2016-12-09 16:10:56.114498 bulbasaur[21709:8268397] [] __tcp_connection_start_block_invoke 53 sending event TCP_CONNECTION_EVENT_TLS_HANDSHAKE_COMPLETE in response to state ready and error (null)
2016-12-09 16:10:56.114739 bulbasaur[21709:8268397] [] tcp_connection_event_notify 53 event: TCP_CONNECTION_EVENT_TLS_HANDSHAKE_COMPLETE, reason: nw_connection event, should deliver: true
2016-12-09 16:10:56.115090 bulbasaur[21709:8268397] [] tcp_connection_get_statistics DNS: 3ms/4ms since start, TCP: 16ms/277ms since start, TLS: 11ms/287ms since start
2016-12-09 16:11:24.680962 bulbasaur[21709:8256238] [] tcp_connection_cancel 50
2016-12-09 16:11:24.681405 bulbasaur[21709:8268396] [] nw_socket_handle_socket_event Event mask: 0x4
2016-12-09 16:11:24.681745 bulbasaur[21709:8256238] [] tcp_connection_cancel 51
2016-12-09 16:11:24.682188 bulbasaur[21709:8268396] [] nw_socket_handle_socket_event Socket received WRITE_CLOSE event
2016-12-09 16:11:24.683606 bulbasaur[21709:8268396] [] __nw_socket_service_writes_block_invoke sendmsg(fd 20, 31 bytes): socket has been closed
2016-12-09 16:11:24.683948 bulbasaur[21709:8268396] [] nw_endpoint_flow_protocol_error [50.2 *IP address* cancelled socket-flow (null)] Socket protocol sent error: [32] Broken pipe

cc @kkemple

PATCH requests ignore their body

** Please provide the following information if you found some bugs or have question:

React Native version: 41.3
Platform: iOS
Is real device of platform: No
Operating System: macOS
React Native Debugger: 0.6.2

When using react-native-debugger, all PATCH requests which have a body, just drop it and the server receives an empty body:

fetch('http://myServer.com/test', {method: 'PATCH', body: {test: 1234}});

when I use POST, it's working fine.

I'm have react-native-fetch-blob in my app and it polyfills xor, blob and fetch, so this might be what's causing it.

Can't reload Chrome dev tools

If (JS) hot reload is enabled, due to a bug in DevTools, the source map is not reloaded. The suggested workaround of reloading dev tools with alt+r does not seem to work in react-native-debugger, nor does toggling via alt+cmd+i.

React Native version: 0.40
Platform: Android
Is real device of platform: Yes
Operating System: macOS
react-native-debugger version: 0.6.0-beta2

New `setupDevTools` method for React inspector

Currently React inspector server port is 8097, it can only accept one connection, that's why we still not support multi-device. (You can run react-native start --port=8082 for start the second react-native instance)

Finally we got facebook/react-native#10522 (It should land at 0.39), we can custom React inspector server port, but I hope it can backward compatibility, so a new setupDevtools might be better.

// Internal use
setupDevtools(hostByWorkerMessage, portByWorkerMessage);

Roadmap

  • Get random port with get-port for React inspector, it should with the prepareJSRuntime method for debugger.
  • A hostname option for device (default is localhost & Android automatic identification)
  • New setupDevtools method
  • Support New window for multi-device (Include automatic start for set-debugger-loc)

"Waiting for React to connect" when debugging Android devices

** Please ensure:

  • I'm using the latest version of react-native-debugger
  • I have read README.md

** Please provide the following information if you found some bugs or have question:

React Native version: [0.42]
Platform: [Android]
Is real device of platform: [real device]
Operating System: [macOS]

I follow the README but the React inspector keeps showing "Waiting for React to connect...". Break points do work.

How should we edit setupDevtools?

I have opened the file but don't know exactly which changes to perform in order to see the React hierarchy on the devtools.

I am developing on a real android device.

Thanks for your amazing work!

Cannot find module 'remotedev-server'

My terminal window stucks with this message:

Cannot find module 'remotedev-server'

I think there is something i have to npm install on my project in order to use react-native-debugger as monitor, right? but what?

Cannot install react-native-debugger

React Native version: [0.41.2]
Platform: [iOS]
Is real device of platform: [No]
Operating System: [macOS, Linux, or Windows?]

I'm trying to install react-native-debugger, but I get a connection timeout. What's the issue? Here's my terminal output.

$ brew cask install react-native-debugger --verbose ==> Downloading https://github.com/jhen0409/react-native-debugger/releases/download/v0.5.6/rn-debugger-macos-x64.zip /usr/bin/curl --remote-time --location --user-agent Homebrew/1.1.10-425-gfa34aa2a (Macintosh; Intel macOS 10.12.3) curl/7.51.0 --fail https://github.com/jhen0409/react-native-debugger/releases/download/v0.5.6/rn-debugger-macos-x64.zip -C 0 -o /Users/pbarzev/Library/Caches/Homebrew/Cask/react-native-debugger--0.5.6.zip.incomplete % Total % Received % Xferd Average Speed Time Time Time Current Dload Upload Total Spent Left Speed 100 602 0 602 0 0 1349 0 --:--:-- --:--:-- --:--:-- 1349 0 0 0 0 0 0 0 0 --:--:-- 0:01:15 --:--:-- 0curl: (7) Failed to connect to github-cloud.s3.amazonaws.com port 443: Operation timed out Error: Download failed on Cask 'react-native-debugger' with message: Download failed: https://github.com/jhen0409/react-native-debugger/releases/download/v0.5.6/rn-debugger-macos-x64.zip The incomplete download is cached at /Users/pbarzev/Library/Caches/Homebrew/Cask/react-native-debugger--0.5.6.zip.incomplete Error: nothing to install Error: Kernel.exit

Roadmap for v0.2.0

  • Support to set debugger host, port (#3)
  • Support to disable React DevTools / Redux DevTools
  • Create a patch to replace open debugger-ui with Chrome for React Native packager (#3)

The provided value 'blob' is unsupported in this environment

When using react-native-fetch-blob and debugging with react-native-debugger, as soon as fetch is called, the app throws The provided value โ€˜blobโ€™ is unsupported in this environment. This does not happen using standard Chrome dev tools or when using RN's built in fetch polyfill.

Error: The provided value 'blob' is unsupported in this environment.
    at invariant (invariant.js:44)
    at XMLHttpRequest.set (XMLHttpRequest.js:190)
    at fetch.js:455
    at tryCallTwo (core.js:45)
    at doResolve (core.js:200)
    at new Promise (core.js:66)
    at self.fetch (fetch.js:425)
    at haveUser (auth.js:142)
    at login (auth.js:201)
    at Object.dispatch (index.js:11)

react-native-debugger: 0.6.3
React Native version: 0.42
Platform: Android
Is real device of platform: Yes
Operating System: Linux

RND in Fullscreen on Mac OS hot-reloading doesn't work if screen out of view

RND v0.6.2, Mac OS 10.11.6

I noticed yesterday that putting RND into it's own "Space" (full screen mode), if I have moved to a different "Space" hiding RND, hot reloading does not happen until I bring RND back into view. I don't think this is an RND problem, however I'm wondering if others have run into this issue?

Great tool, by the way!

react devtools not working for same setup that works for iOS

I'm using the same setup I have for iOS, but in Android. The Redux devtools and console works, but for whatever reason the react-devtools don't. I can't find any Android-specific documentation for things I might need to change.

Do the included React Devtools not work for Android yet?

Here's the error I'm getting:

failed to connect
(anonymous) @ Store.js:507
 _establishConnection() {
    var tries = 0;
    var requestInt;
    this._bridge.once('capabilities', capabilities => {
      clearInterval(requestInt);
      this.capabilities = assign(this.capabilities, capabilities);
      this.emit('connected');
    });
    this._bridge.send('requestCapabilities');
    requestInt = setInterval(() => {
      tries += 1;
      if (tries > 100) {
        console.error('failed to connect'); // line 507!
        clearInterval(requestInt);
        this.emit('connection failed');
        return;
      }
      this._bridge.send('requestCapabilities');
    }, 500);
  }

React Native version: 44
Platform: Android
Is real device of platform: NO
Operating System: macOS

show in source (with babel plugin) has this error: "Uncaught TypeError: Cannot convert undefined or null to object"

Uncaught TypeError: Cannot convert undefined or null to object
    at Function.from (native)
    at _toArray (/Applications/React Native Debugger.app/Contents/Resources/app.asar/node_modules/react-devtools-core/build/standalone.js:14797:49)
    at launchEditor (/Applications/React Native Debugger.app/Contents/Resources/app.asar/node_modules/react-devtools-core/build/standalone.js:14852:63)
    at Object.showElementSource (/Applications/React Native Debugger.app/Contents/Resources/app.asar/node_modules/react-devtools-core/build/standalone.js:92:13)
    at /Applications/React Native Debugger.app/Contents/Resources/app.asar/node_modules/react-devtools-core/build/standalone.js:293:34

It fails on the first line here (Array.from(arr)):

function _toArray(arr) { return Array.isArray(arr) ? arr : Array.from(arr); }
	
var fs = __webpack_require__(2);
var path = __webpack_require__(3);
var child_process = __webpack_require__(260);
var shellQuote = __webpack_require__(261);
	
function isTerminalEditor(editor) {
	switch (editor) {
	    case 'vim':
	    case 'emacs':
	    case 'nano':
	      return true;
	}
	return false;
}	

I have the babel plugin set:

{
  "presets": ["react-native"],
  "plugins": ["transform-react-jsx-source"]
}

The source filename and line number correctly shows in the standalone debugger app, but the link doesn't open (it has the above error). I'm using VSCode.

React Native version: 44
Platform: iOS
Is real device of platform: NO
Operating System: macOS

[iOS][macOS] Invoke dev menu methods by rndebugger

The React Native for iOS have NativeModules.DevMenu, so we can invoke following methods on the worker:

  • Reload JS
  • Enable LiveReload
  • Enable Hot Reload
  • Enable Profiling
  • Show Dev menu

I think it will be helpful to enhance the development experience, even we can support MacBook Touch Bar in the future.

Or we can invoke directly in RNDebuggerWorker.js context for console:

global.require('NativeModules').DevMenu.reload();

Others

  • (Not iOS only, #15) Enable XHR Inspect

Roadmap

  • Check methods available by worker message
  • Add methods to menu or context menu, invoke by worker message
  • Touch Bar support for macOS (Upstream: electron/electron#7781)

Ignoring library

Hi, how about Ignoring library code in call stack on breakpoints?
chrome just have an experimental setting for it: 'Enable frameworks debugging support';
and i can add some libs to blacklist;
Usually i don't want to see the guts of React or Redux

Default debugger opens in chrome tab after upgrading to RN 0.43.4

Prior to upgrading RN from 0.42.0 to 0.43.4, React Native Debugger would open when the project was launched or debugging was enabled. After the upgrade, I just get the default debugger.

React Native Debugger version: 0.6.4
React Native version: ^0.43.4
Platform: tested iOS simulator, Android device
Operating System: macOS

RN not connecting after upgrading to 0.5.3

Hi,

First of all thank you for amazing package that includes everything needed for RN development in one app :)
Today I got an automatic upgrade to 0.5.3 version on my MacOS Sierra, and after this upgrade my RN project connecting to Debugger only for the first load. But when I reload the RN app (with Live reload or manually with Cmd+R) it couldn't connect to Debugger anymore.
Also I can see a JS errors related to the Redux chart tree building. Not sure if it's related to the not reloading issue though.

screen shot 2016-11-25 at 22 27 18

global.reduxNativeDevTools() is undefined

The readme needs a lot work, I've been trying to make this work for hours but no matter how many times I read the instructions, nothing works.

global.reduxNativeDevTools() is undefined.

I have installed React Native Debugger and it says "Waiting, press command-R in simulator..." but obviously nothing happens. Not even the react dev tools load on the bottom of the screen.

I have also failed trying to make this work with the remote.io and with Remote Redux DevTools.

Get project roots for support relative paths for JSX source in React DevTools

See facebook/react-devtools#703, it would be better for Show <> in Source feature for React DevTools.

Also, it's possible to set a function to debugger worker, let user set the projectRoots in JS:

if (window.setProjectRootForRNDebugger) {
  window.setProjectRootForRNDebugger('<path_of_project>')
}

Except the global function, it seems to be no good way without rndebugger-open, so we should make it recommended to use in the documentation.

[0.6.0] Debugger worker perform slowly if the app invisible

It looks the same as this problem in StackOverflow, currently we intend use [email protected] (based on Chrome 56) for RNDebugger v0.6, so the problem will caused, but we haven't the warn. This will write to readme If I released stable version of RNDebugger.

A good news is seems the problem is solved by Chrome 57 (currently beta and it should release at Mar 14th), we can also PR for remove warnings to RN when it released.

Updated: Chrome 57 released, we should waiting for Electron upgrade.

How to hide element parent list

Is there any way to hide the element parent list that appears when you inspect an element? I'm referring to the following part of the React Native Debugger interface:

screen shot 2017-03-06 at 1 34 27 pm

I find that this part of the interface often ends up having such a high number of items in the element parent list that it takes up a huge amount of space in the interface, but doesn't really provide much value since the view above it with the full element hierarchy gives you the same information anyway. I'd like to completely hide this element parent list view, is that possible?

React Native version: 15.4.0
Platform: iOS
Is real device of platform: No, Simulator
Operating System: macOS

Unable to figure out how to initialize properly to store, different from examples

I'm trying to add these tools to a react-native project at https://github.com/GeoffreyPlitt/RN-NavigationExperimental-Redux-Example/blob/master/app/app.js

The store construction (with middleware etc) doesn't quite follow the examples you guys have, and every combination I've tried leads to confusing errors.

Is it easy to point out the proper way to do it? If not, I can put together a few branches showing my attempts and the error messages I'm getting.

Formdata sends [object object] in request

When I try to call POST and request's content type is multipart/formdata it shows [object object] in request params and API can not get any properties. It works good with JSON data.

Does anyone else having same problem?

Can't type `/` in Dispatcher for an action type.

We namespace our actions like so: auth/SAVE_CREDENTIALS but I can't type a forward slash inside the Dispatcher. It automatically focuses on searching for a react component, even if I have the React DevTools closed/hidden.

RND freezes after connect

When i try to connect to react native debugger, console region freezes, DOM view and Redux DevTools a still work.

Video: http://take.ms/nMu5U

import { createStore, applyMiddleware, compose } from 'redux';
import reducers from '../reducers';
import thunk from 'redux-thunk';

function configureStore(initialState) {
  let enhancer;
  if (global.__DEV__) {
    const composeEnhancers = window.__REDUX_DEVTOOLS_EXTENSION_COMPOSE__ || compose;
    enhancer = composeEnhancers(applyMiddleware(thunk));
  } else {
    enhancer = compose(applyMiddleware(thunk));
  }
  const store = createStore(reducers, initialState, enhancer);
  return store;
}

const store = configureStore();

export default store;

react native debugger: 0.5.5

Packager running on non default port - error message "Failed to execute 'importScripts' (...)"

Hello!

I'm running packager on port 8082. Everything is fine, e.g. HMR is working. When I enter remote debug mode I get following error on emulator.

zrzut ekranu 2017-02-28 o 10 08 05

In Network Tab of React Native Debugger I can see that following HTTP request has been made:
http://localhost:8081/index.android.bundle?platform=android&dev=true&hot=true&minify=false

Request URL:http://localhost:8081/index.android.bundle?platform=android&dev=true&hot=true&minify=false
Request Method:GET
Status Code:403 Forbidden
Remote Address:[::1]:8081

I guess it should make a request that targets localhost:8082 not localhost:8081, since this is where packager is listening.

I could not find easy way to change a port, so remote debugging could work. How to change it ?

React Native version: 0.41.2 & 0.38
React Native boilerplate: https://github.com/jhen0409/react-native-boilerplate
Platform: Android,
Is real device of platform: No
Operating System: macOS

Can't seem to print $r from console, $r is not defined.

When I print $r in the console I get "Uncaught ReferenceError: $r is not defined(โ€ฆ)". I changed the context from "top" to "RNDebuggerWorker.js" in the console but it does not seem to change anything. I cannot see the React component either in the React debugger.

Any ideas what it might be?

Thanks for the great debugging tool :)

Connections to debugger-proxy timed out.

React Native version: 0.43
Platform: iOS & Android
Is real device of platform: No
Operating System: macOS

Hello, I have this error pretty often. When I have it, I must stop debug mode et restart it to make it works again, what's the problem ? (I'm using expo SDK 16, I didn't have this problem with SDK 15)

image

Recommend Projects

  • React photo React

    A declarative, efficient, and flexible JavaScript library for building user interfaces.

  • Vue.js photo Vue.js

    ๐Ÿ–– Vue.js is a progressive, incrementally-adoptable JavaScript framework for building UI on the web.

  • Typescript photo Typescript

    TypeScript is a superset of JavaScript that compiles to clean JavaScript output.

  • TensorFlow photo TensorFlow

    An Open Source Machine Learning Framework for Everyone

  • Django photo Django

    The Web framework for perfectionists with deadlines.

  • D3 photo D3

    Bring data to life with SVG, Canvas and HTML. ๐Ÿ“Š๐Ÿ“ˆ๐ŸŽ‰

Recommend Topics

  • javascript

    JavaScript (JS) is a lightweight interpreted programming language with first-class functions.

  • web

    Some thing interesting about web. New door for the world.

  • server

    A server is a program made to process requests and deliver data to clients.

  • Machine learning

    Machine learning is a way of modeling and interpreting data that allows a piece of software to respond intelligently.

  • Game

    Some thing interesting about game, make everyone happy.

Recommend Org

  • Facebook photo Facebook

    We are working to build community through open source technology. NB: members must have two-factor auth.

  • Microsoft photo Microsoft

    Open source projects and samples from Microsoft.

  • Google photo Google

    Google โค๏ธ Open Source for everyone.

  • D3 photo D3

    Data-Driven Documents codes.