collected & summarized research on the effectiveness of visualization techniques
Pie charts are misleading: position and color of slices affects our judgments of their size. Prefer bar charts to pie charts.
Our analysis has provided, in a sense, a resolution of the 'Bar-Circle Debate'...about whether the divided bar chart or the pie chart was superior for portraying parts of a whole. The contest appears to have ended in a draw. We conclude that neither graphical form should be used because other methods are demonstrably better.
A divided bar chart can always be replaced by a grouped bar chart; again, we prefer a grouped dot chart to a grouped bar chart.
Graphical Perception: Theory, Experimentation, and Application to the Development of Graphical Methods by William S. Cleveland; Robert McGill
Change Blindness in Animated Choropleth Maps: An Empirical Study by Carolyn Fish, Kirk P. Goldsberry and Sarah Battersby
Many people are change-blind to animated graphics, especially those that abruptly transition between colors and shapes. Animating value changes improves the awareness and measurement of change.
Animated Transitions in Statistical Data Graphics by Jeffrey Heer, George Robertson
There was evidence that staged animation, such as staggered movements to reduce occlusion and separate stages for axis rescaling and value changes, provide additional benefits. This claim is strongly backed by subject preferences and consistently (though at times marginally) supported by error measures. The results further discourage the use of complex multi-stage transitions, favoring simple staging over aggressive “do one thing at a time” staging.
A popular industry application of this research is d3js's staggered transitions as seen in its showreel.
According to this analysis, if there are benefits to animation, they should be evident especially for continuous rather than discrete changes, in particular, for manner of change and for microsteps, the subtle and intricate timing relations among parts of a complex system. However, even for these cases, clever schematization of static diagrams may be just as effective as animation. For example, arrows are effective in indicating temporal sequence and direction of motion
Large 2D information spaces, such as maps, images, or abstract visualizations, require views at various level of detail: Close ups to inspect details, overviews to maintain (literally) an overview. Users often switch between these views. We discuss how smooth animations from one view to another can be defined. To this end, a metric on the effect of simultaneous zooming and panning is defined, based on an estimate of the perceived velocity
The proposed algorithm, which is implemented in Leaflet 0.8, and Mapbox GL, presents a way to pan and zoom that is less jarring and easier to follow that simple linear interpolation of both variables. The paper doesn't discuss cognitive benefits, but the results are often percieved as more pleasant than the simple way.
Smooth and efficient zooming and panning by Jarke J. van Wijk & Wim A.A. Nuij
Perceptual Guidelines for Creating Rectangular Treemaps by Nicholas Kong, Jeffrey Heer, and Maneesh Agrawala
- the optimal distribution of rectangle aspect ratios within a treemap should include non-squares, but should avoid extreme aspect ratios.
- even at relatively low data densities treemaps result in faster comparisons than bar charts.
use hue to show categorical differences and use lightness to show lightness differences
Color Use Guidelines for Data Representation
Avoid interpolating color palettes using RGB values, because the hue and brightness of colors within that system are strongly linked. Instead, use perceptual color spaces like CIE.
Generating Color Palettes using Intuitive Parameters & How to Avoid Equidistant Colors
A fisheye camera lens is a very wide angle lens that magnifies nearby objects while shrinking distant objects. It is a valuable tool for seeing both “local detail” and “global context” simultaneously.
Graphical Fisheye Views by Mano jit Sarkar and Marc H. Brown
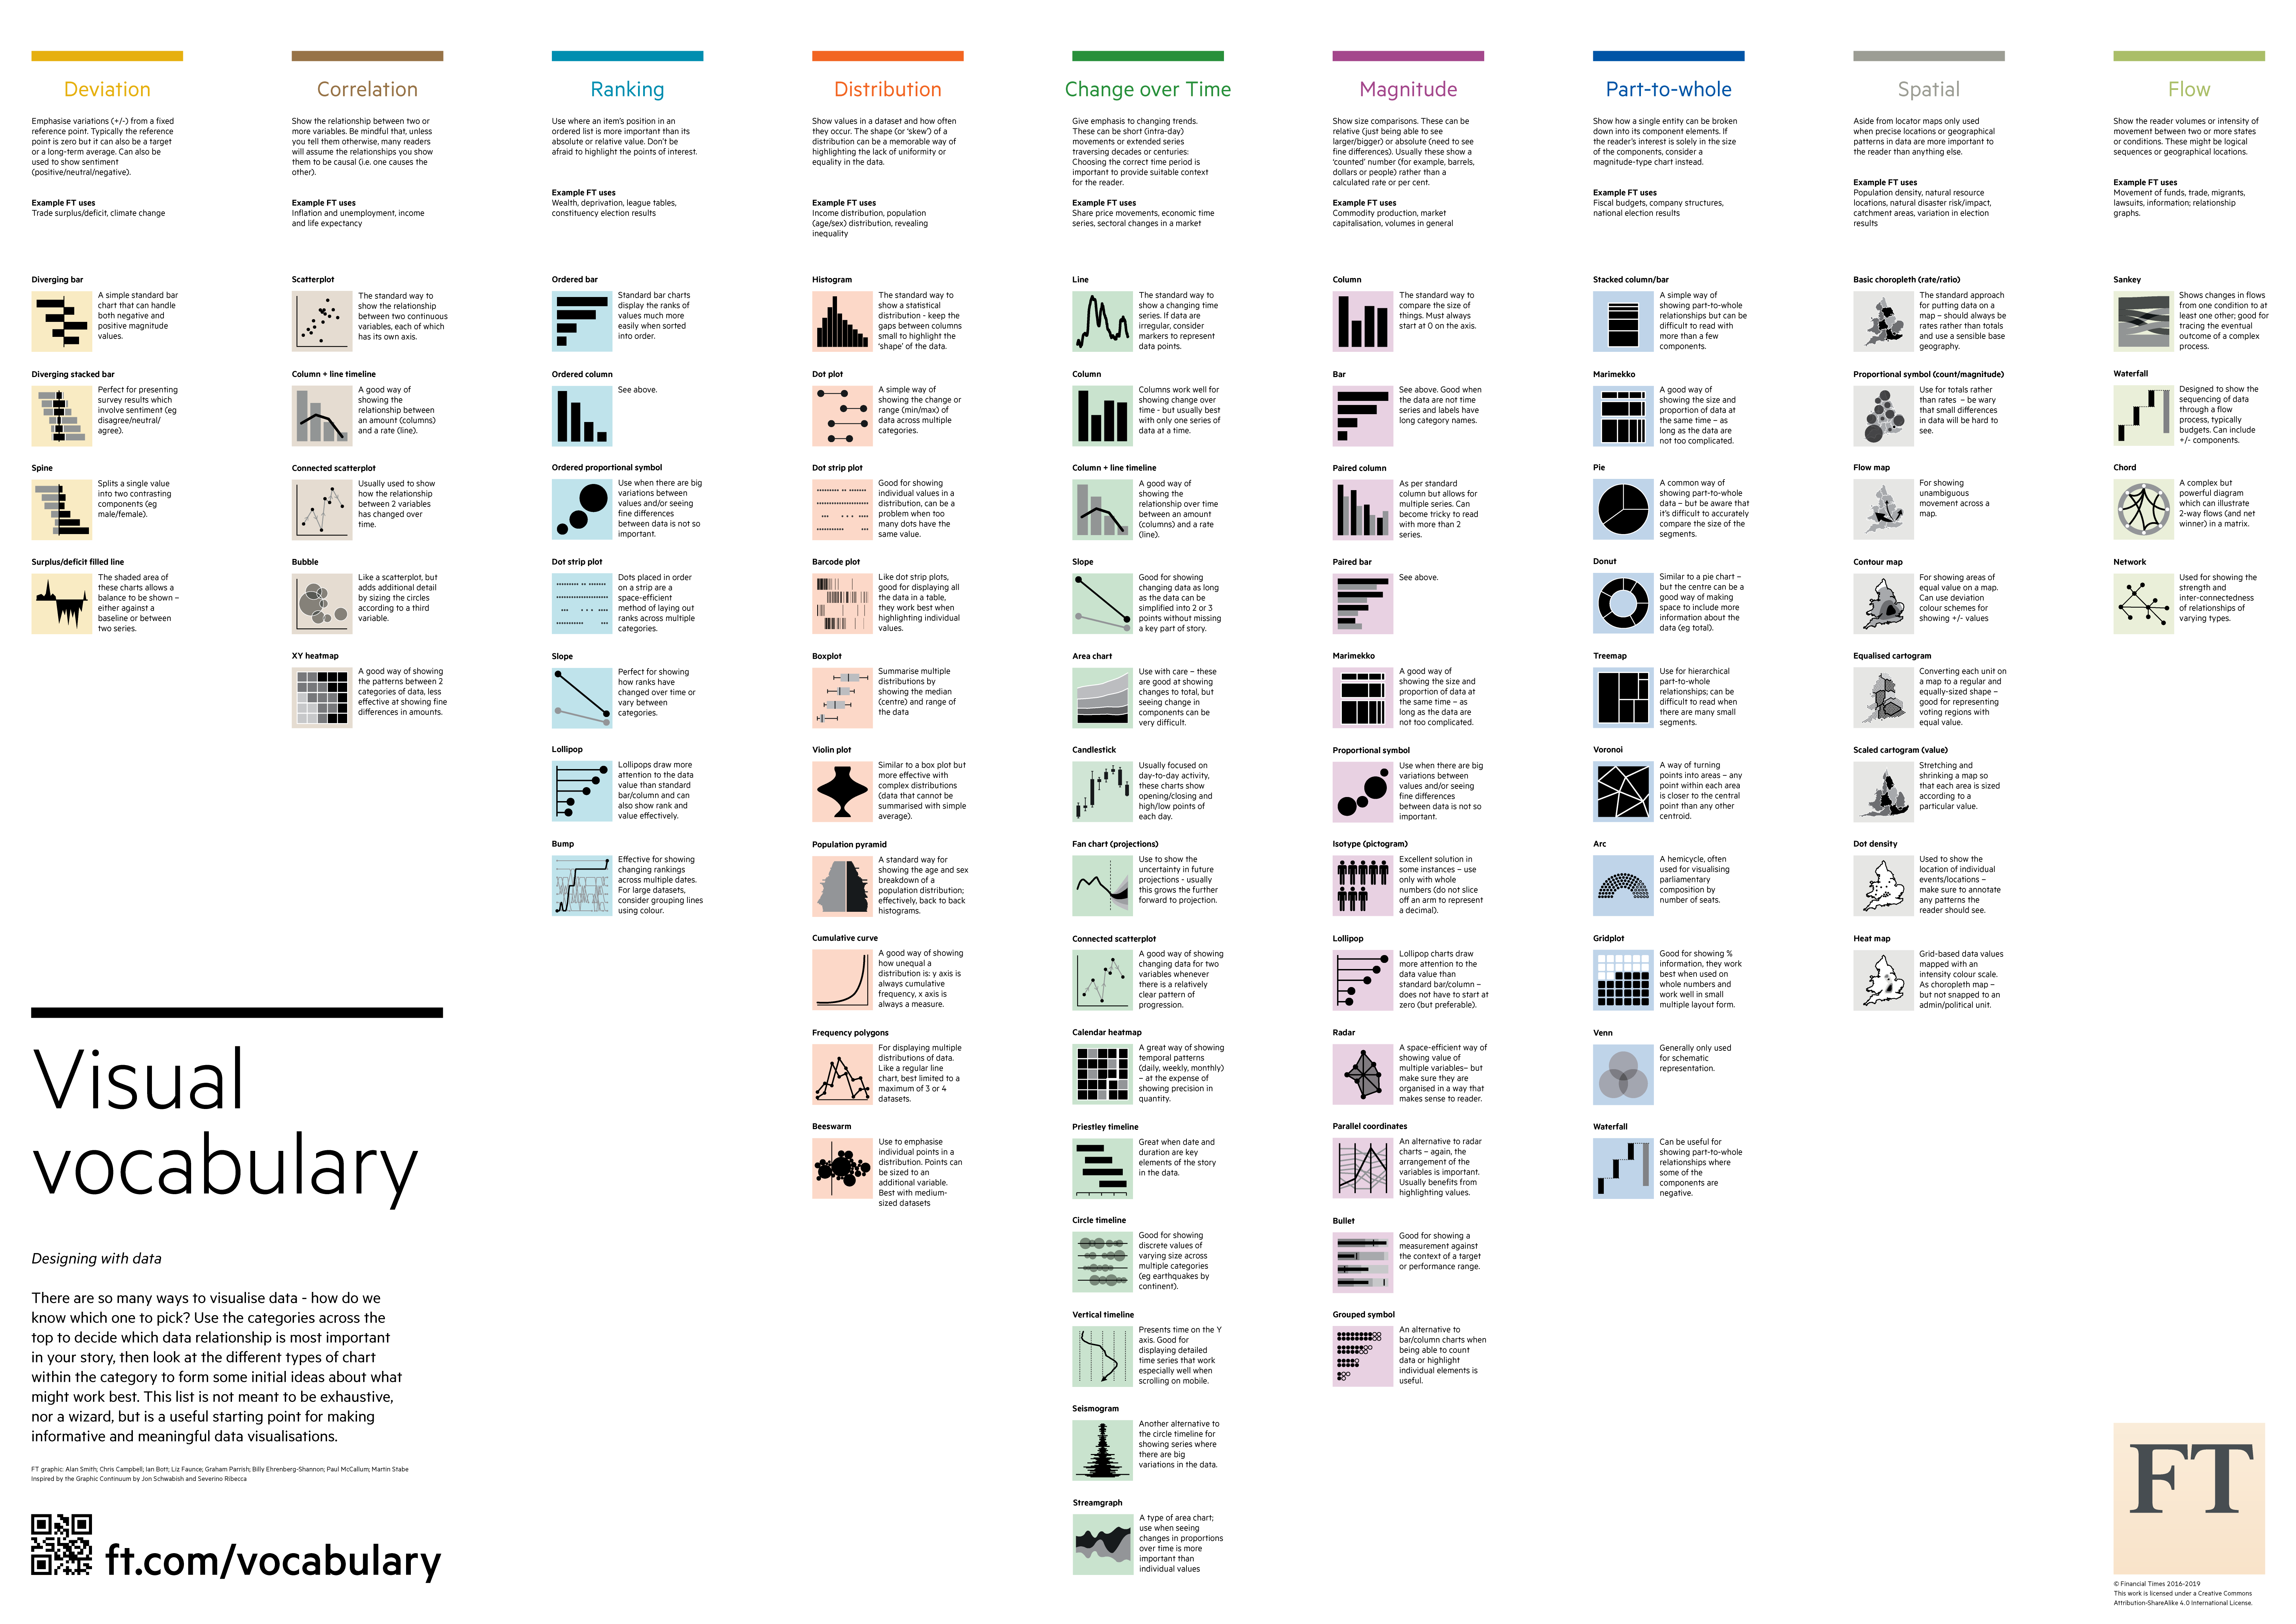
- Data Visualization Infographic. A smorgasbord of data visualization techniques in an easy-to-read infographic.
- Horizon charts improve recognition of both small and large changes for data that fits x & y axes, like time series
- Chord diagrams enable visualization of multi-dimensional and connected data
- Stacked Graphs also known as streamgraphs, which gained popularity with ThemeRiver and its visualization of last.fm data. An alternative to stacked area charts, they can thrive with series that vary and disappear over time.


