


Collect Jenkins monitoring data through OpenTelemetry.
Using the OpenTelemetry Collector, you can use many monitoring backends to monitor Jenkins such as Jaeger, Zipkin, Prometheus, Elastic Observability and many others listed here.
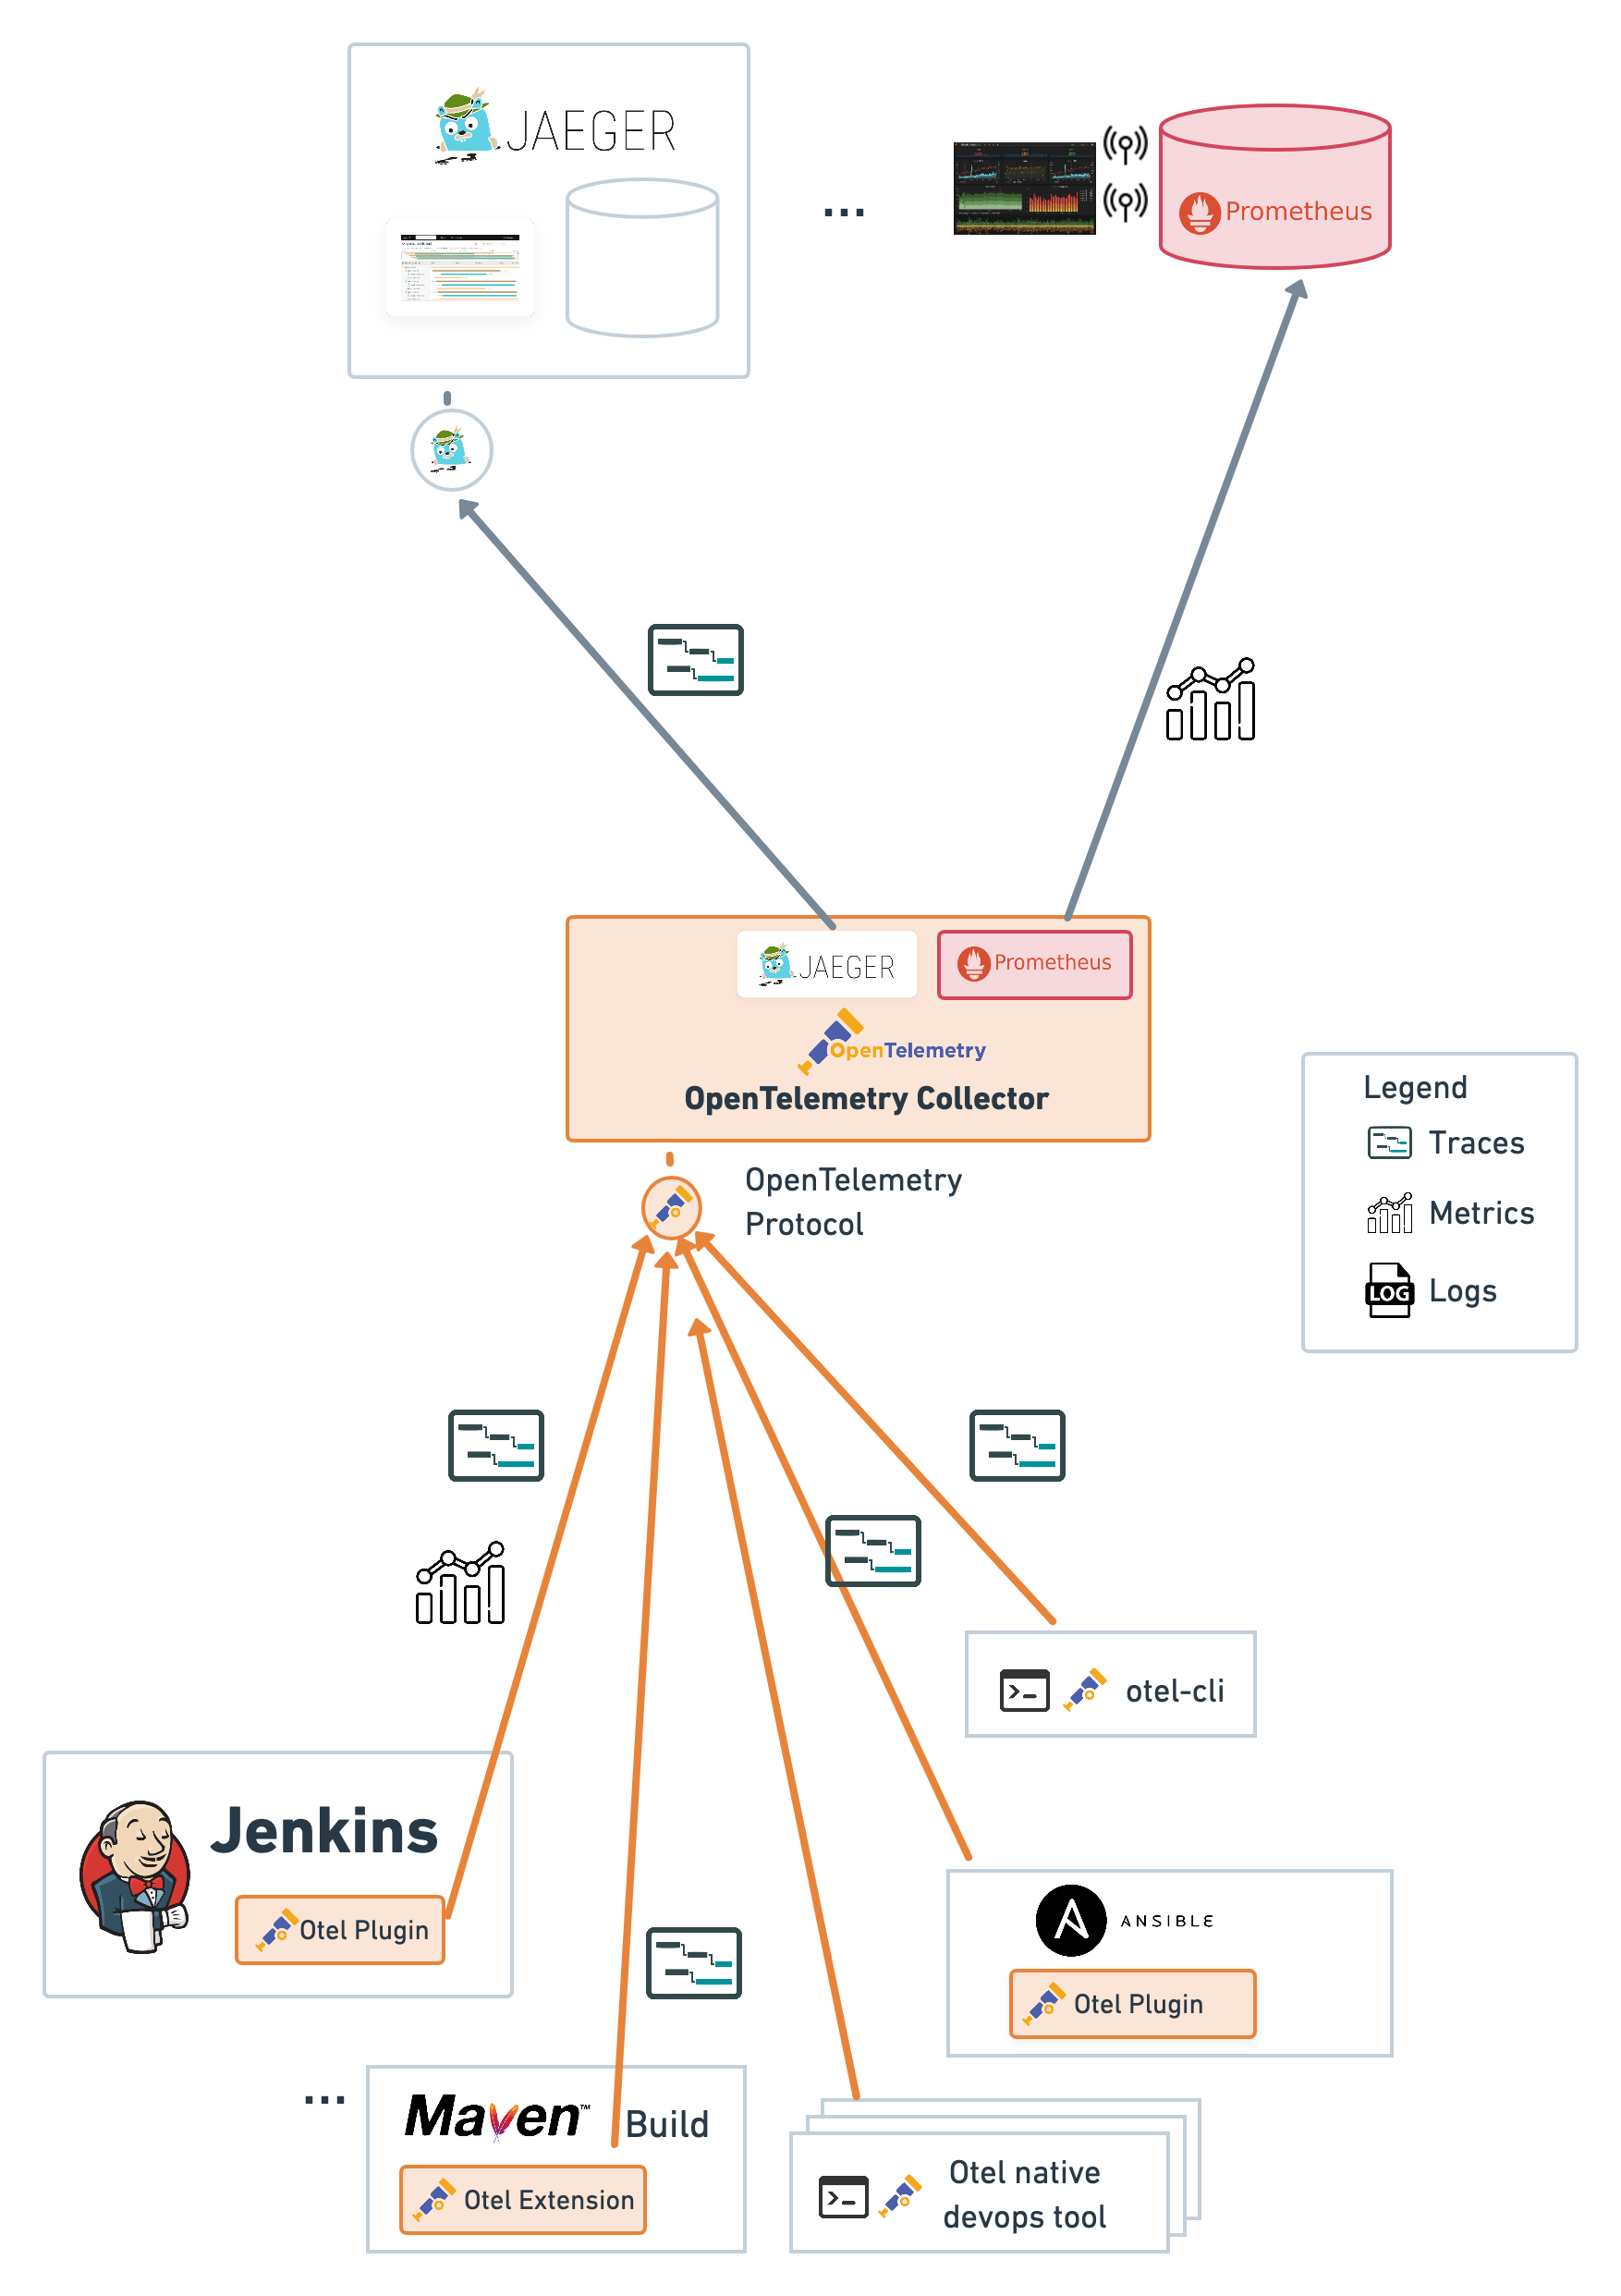
Here are few examples of architecture:
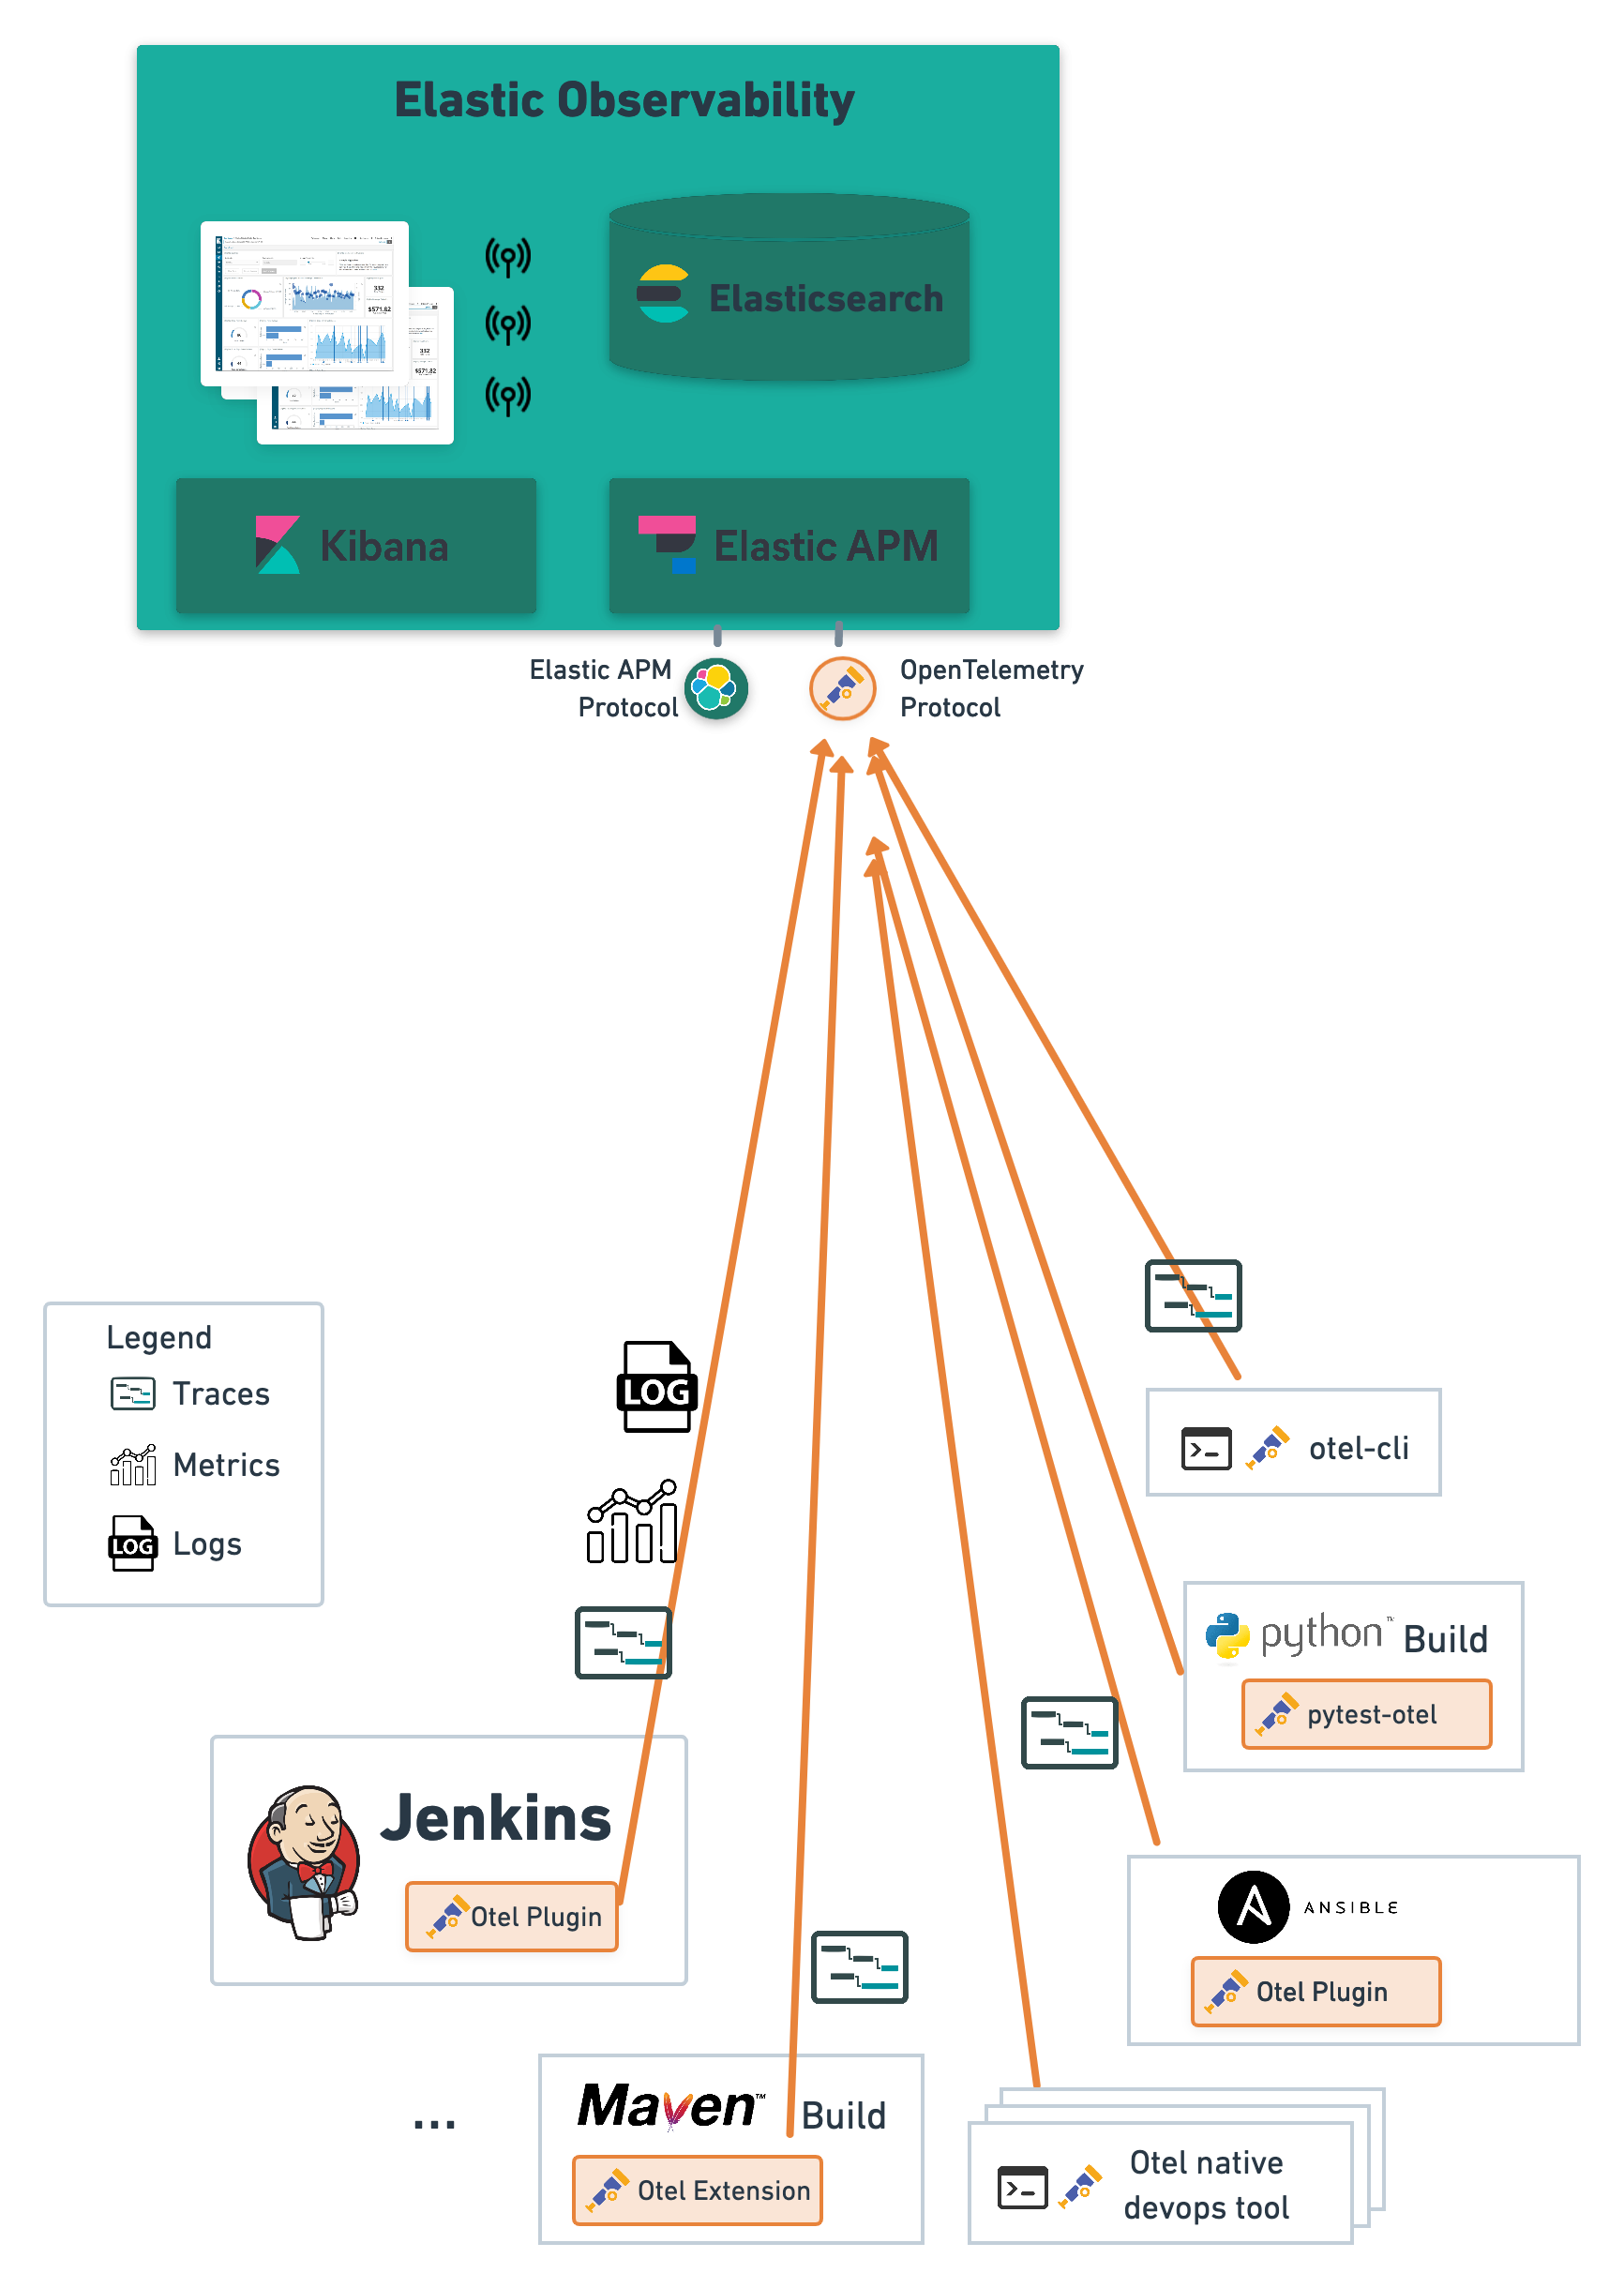
You just have to configure the Jenkins Controller to send OpenTelemetry data either directly to Elastic APM Server or via an OpenTelemetry Collector. Elastic handles both traces and metrics.
Configure the Jenkins Controller to send OpenTelemetry data to an OpenTelemetry Collector and setup a Prometheus exporter on this collector.
ℹ️ Enable resource_to_telemetry_conversion on the OpenTelemetry Collector exporter for Prometheus in order to have the OpenTelemetry metrics resource attributes converted to Prometheus labels to differentiate the different Jenkins Controllers.
exporters:
  prometheus:
    endpoint: 0.0.0.0:1234
    resource_to_telemetry_conversion:
      enabled: true
  ...
service:
  pipelines:
    metrics:
      receivers:
        - otlp
      exporters:
        - prometheus
    traces:
...- Understand where time is spent, including time spent waiting to schedule the job (time spent in the build queue)
- The time spent in the built queue waiting for a build agent is visualised with the span "Phase : Start"
- Detect increasing time spent in steps like
- Invocations of external systems (e.g. git checkout...)
- Built in integration with Elastic Observability, Jaeger, and Zipkin. Other OpenTelemetry compatible distributed tracing solutions are also supported.
The context of the current span is exposed as environment variables to ease integration with third party tools.
TRACEPARENT: the W3C Trace Context headertraceparentTRACESTATE: the W3C Trace Context headertracestateTRACE_ID: the trace id of the job / pipelineSPAN_ID: the id of the pipeline shell step span
When the configuration options "Export OpenTelemetry configuration as environment variables", the following OpenTelemetry environment variables will be exported according to the settings of the plugin:
OTEL_EXPORTER_OTLP_ENDPOINT: Target to which the exporter is going to send spans or metrics.OTEL_EXPORTER_OTLP_INSECURE: Whether to enable client transport security for the exporter's gRPC connectionOTEL_EXPORTER_OTLP_HEADERS: Key-value pairs to be used as headers associated with gRPC or HTTP requests. Typically used to pass credentials.OTEL_EXPORTER_OTLP_TIMEOUT: Maximum time the OTLP exporter will wait for each batch export.OTEL_EXPORTER_OTLP_CERTIFICATE: The trusted certificate to use when verifying a server's TLS credentials.
In addition, if the backends were configured then there will be an environment variable for each of them pointing to the URL with the span/transactions:
OTEL_CUSTOM_URLOTEL_ELASTIC_URLOTEL_JAEGER_URLOTEL_ZIPKIN_URL
| Attribute | Description | Type |
|---|---|---|
| ci.pipeline.id | Job name | String |
| ci.pipeline.name | Job name (user friendly) | String |
| ci.pipeline.type | Job type | Enum (freestyle, matrix, maven, workflow, multibranch, unknown) |
| ci.pipeline.multibranch.type | Multibranch type | Enum (branch, tag, change_request) |
| ci.pipeline.agent.id | Name of the agent | String |
| ci.pipeline.run.completed | Is this a complete build? | Boolean |
| ci.pipeline.run.durationMillis | Build duration | Long |
| ci.pipeline.run.description | Build description | String |
| ci.pipeline.run.number | Build number | Long |
| ci.pipeline.run.result | Build result | Enum (aborted, success, failure, not_build and unstable) |
| ci.pipeline.run.url | Build URL | String |
| ci.pipeline.run.user | Who triggered the build | String |
| ci.pipeline.parameter.sensitive | Whether the information contained in this parameter is sensitive or security related. | Boolean |
| ci.pipeline.parameter.name | Name of the parameter | String |
| ci.pipeline.parameter.value | Value of the parameter. "Sensitive" values are redacted | String |
| Attribute | Description | Type |
|---|---|---|
| jenkins.pipeline.step.name | Step name (user friendly) | String |
| jenkins.pipeline.step.type | Step name | String |
| jenkins.pipeline.step.id | Step id | String |
| jenkins.pipeline.step.plugin.name | Jenkins plugin for that particular step | String |
| jenkins.pipeline.step.plugin.version | Jenkins plugin version | String |
| jenkins.pipeline.step.agent.label | Labels attached to the agent | String |
| git.branch | Git branch name | String |
| git.repository | Git repository | String |
| git.username | Git user | String |
| git.clone.shallow | Git shallow clone | Boolean |
| git.clone.depth | Git shallow clone depth | Long |
| git.username | Git user | String |
| jenkins.url | Jenkins URL | String |
| jenkins.computer.name | Name of the agent | String |
| Metrics | Unit | Label key | Label Value | Description |
|---|---|---|---|---|
| ci.pipeline.run.active | 1 | Gauge of active jobs | ||
| ci.pipeline.run.launched | 1 | Job launched | ||
| ci.pipeline.run.started | 1 | Job started | ||
| ci.pipeline.run.completed | 1 | Job completed | ||
| ci.pipeline.run.aborted | 1 | Job aborted | ||
| jenkins.queue.waiting | 1 | Number of waiting items in queue | ||
| jenkins.queue.blocked | 1 | Number of blocked items in queue | ||
| jenkins.queue.buildable | 1 | Number of buildable items in queue | ||
| jenkins.queue.left | 1 | Total count of left items | ||
| jenkins.queue.time_spent_millis | ms | Total time spent in queue by items | ||
| jenkins.agents.total | 1 | Number of agents | ||
| jenkins.agents.online | 1 | Number of online agents | ||
| jenkins.agents.offline | 1 | Number of offline agents | ||
| jenkins.agents.launch.failure | 1 | Number of failed launched agents | ||
| jenkins.cloud.agents.completed | 1 | Number of provisioned cloud agents | ||
| jenkins.cloud.agents.launch.failure | 1 | Number of failed cloud agents | ||
| jenkins.disk.usage.bytes | By | Disk Usage size | ||
| runtime.jvm.gc.time | ms | gc | G1 Young Generation, G1 Old Generation... |
see GarbageCollectorMXBean |
| runtime.jvm.gc.count | 1 | gc | G1 Young Generation, G1 Old Generation... |
see GarbageCollectorMXBean |
| runtime.jvm.memory.area | bytes | type, area | used, committed, max. heap, non_heap |
see MemoryUsage |
| runtime.jvm.memory.pool | bytes | type, pool | used, committed, max. PS Eden Space, G1 Old Gen... |
see MemoryUsage |
| system.cpu.load | 1 | System CPU load. See com.sun.management.OperatingSystemMXBean.getSystemCpuLoad |
||
| system.cpu.load.average.1m | 1 | System CPU load average 1 minute See java.lang.management.OperatingSystemMXBean.getSystemLoadAverage |
||
| system.memory.usage | By | state | used, free |
see com.sun.management.OperatingSystemMXBean.getTotalPhysicalMemorySize and com.sun.management.OperatingSystemMXBean.getFreePhysicalMemorySize |
| system.memory.utilization | 1 | System memory utilization, see com.sun.management.OperatingSystemMXBean.getTotalPhysicalMemorySize and com.sun.management.OperatingSystemMXBean.getFreePhysicalMemorySize. Report 0% if no physical memory is discovered by the JVM. |
||
| system.paging.usage | By | state | used, free |
see com.sun.management.OperatingSystemMXBean.getFreeSwapSpaceSize and com.sun.management.OperatingSystemMXBean.getTotalSwapSpaceSize |
| system.paging.utilization | 1 | see com.sun.management.OperatingSystemMXBean.getFreeSwapSpaceSize and com.sun.management.OperatingSystemMXBean.getTotalSwapSpaceSize. Report 0% if no swap memory is discovered by the JVM. |
||
| process.cpu.load | 1 | Process CPU load. See com.sun.management.OperatingSystemMXBean.getProcessCpuLoad |
||
| process.cpu.time | ns | Process CPU time. See com.sun.management.OperatingSystemMXBean.getProcessCpuTime |
Jenkins metrics can be visualised with any OpenTelemetry compatible metrics solution such as Prometheus or Elastic Observability
The runtime.* metrics are the same as the one collected by the `
:WIP:
Node steps will be transformed to Agent spans to be the more agnostic to any platform. Therefore the jenkins.pipeline.step.type attribute will report the jenkins pipeline step node but
the span name will refer to Agent in the distributed traces.

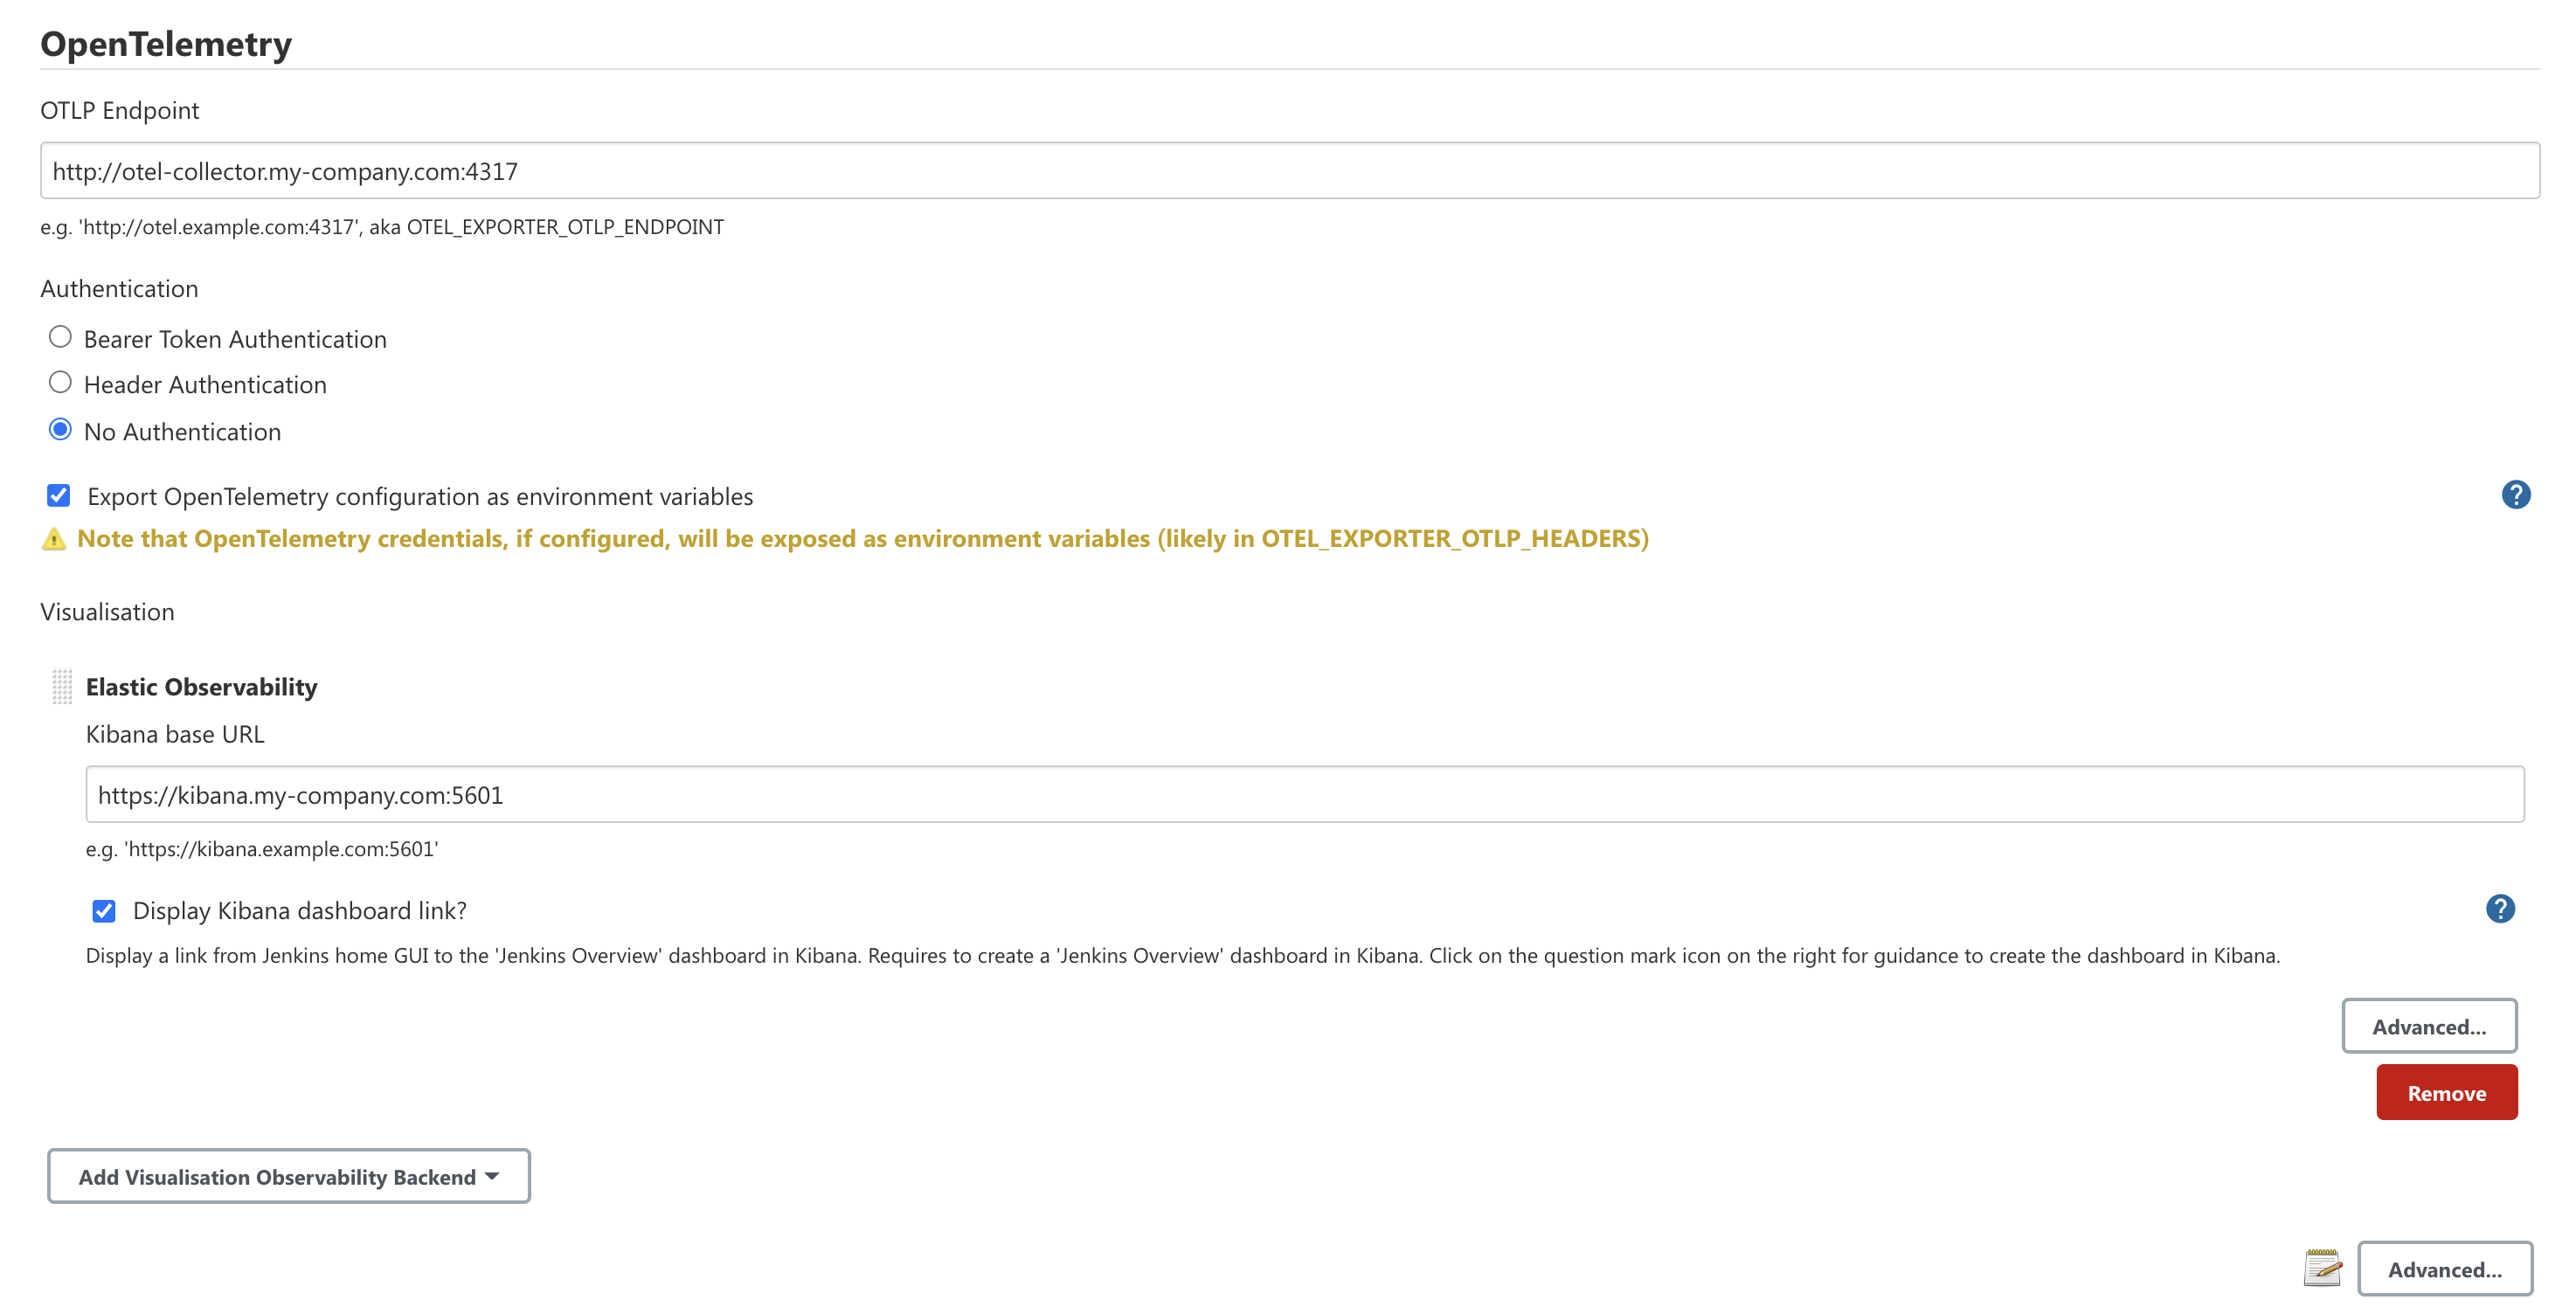
- Setup an OpenTelemetry endpoint such as the OpenTelemetry Collector
- Install the Jenkins OpenTelemetry plugin
- Configure the Jenkins OpenTelemetry plugin navigating to the "Manage Jenkins / Configure System" screen
- In the OpenTelemetry section define
- "OTLP GRPC Endpoint": the hostname and port of the OpenTelemetry GRPC Protocol (OTLP GRPC) endpoint, typically an OpenTelemetry Collector or directly an Observability backend that supports the OTLP GRPC protocol
- "Header Authentication" : name of the authentication header if header based authentication is used.
- "Bearer Token Authentication": Bearer token when using header based authentication.
- Visualization: the backend used to visualize job executions as traces.
- Elastic Observability
- Jaeger
- Zipkin
- Custom Observability backend for other visualisation solution
You can now import some of the existing dashboards that have been created to provide further insights about your CI/CD Jenkins platform
See the details in the dashboard docs.
Sample of traces collected for various flavors of pipelines
node {
    stage('Prepare') {
        echo("Prepare")
    }
    stage('Build') {
        git 'https://github.com/jglick/simple-maven-project-with-tests.git'
        sh "mvn -Dmaven.test.failure.ignore=true clean package"
    }
    stage('Post Build') {
        echo("this is the post build phase")
    }
}


pipeline {
    agent any

    stages {
        stage('Build') {
            steps {
                git 'https://github.com/jglick/simple-maven-project-with-tests.git'
                sh "mvn -Dmaven.test.failure.ignore=true clean package"
            }
            post {
                success {
                    echo "success"
                }
            }
        }
    }
}

node {
    stage('Prepare') {
        echo("Prepare")
    }
    stage('Build') {
        git 'https://github.com/jglick/simple-maven-project-with-tests.git'
        sh "mvn -Dmaven.test.failure.ignore=true clean package"
    }
    stage('Post Build') {
        error 'Fail'
    }
}

node {
    stage('Prepare') {
        echo("Prepare")
    }
    stage('Build') {
        git 'https://github.com/jglick/simple-maven-project-with-tests.git'
        sh "mvn -Dmaven.test.failure.ignore=true clean package"
    }
    stage('Parallel Post Build') {
        parallel parallBranch1: {
            echo("this is the post build parallel branch 1")
        } ,parallBranch2: {
            echo("this is the post build parallel branch 2")
            echo("this is the post build parallel branch 2")
        }
    }
}

This plugin supports configuration as code. Add to your yaml file:
unclassified:
  openTelemetry:
    authentication: "noAuthentication"
    endpoint: "otel-collector-contrib:4317"
    exportOtelConfigurationAsEnvironmentVariables: true
    exporterIntervalMillis: 60000
    exporterTimeoutMillis: 30000
    ignoredSteps: "dir,echo,isUnix,pwd,properties"
    observabilityBackends:
      - elastic:
          kibanaBaseUrl: "http://localhost:5601"
          name: "Elastic Observability"
      - jaeger:
          jaegerBaseUrl: "http://localhost:16686"
          name: "Jaeger"
      - customObservabilityBackend:
          metricsVisualisationUrlTemplate: "foo"
          traceVisualisationUrlTemplate: "http://example.com"
          name: "Custom Observability"
      - zipkin:
          zipkinBaseUrl: "http://localhost:9411/"
          name: "Zipkin"
    serviceName: "jenkins"
    serviceNamespace: "jenkins"
See the jcasc folder with various samples.
For more details see the configuration as code plugin documentation: https://github.com/jenkinsci/configuration-as-code-plugin#getting-started
Refer to our contribution guidelines
Licensed under Apache Software License 2, see LICENSE