![]()
Unsupervised Inference of Developmental Directions for Single Cells Using VECTOR, https://doi.org/10.1016/j.celrep.2020.108069
fzhang_at_shsmu.edu.cn
15110700005_at_fudan.edu.cn
fzhang15_at_fudan.edu.cn
install.packages('circlize')   # 0.4.11
install.packages('gatepoints') # 0.1.3
install.packages('stringr')    # 1.4.0
install.packages('igraph')     # 1.2.6
install.packages('gmodels')    # 2.18.1
Users can follow https://satijalab.org/seurat/ to generate Seurat object (V3.0.0).
library(Seurat)
# DATA: Expression matrix. Rownames are gene names. Colnames are cell names.
pbmc <- CreateSeuratObject(counts = DATA, project = "pbmc3k", min.cells = 0, min.features = 0)
pbmc <- NormalizeData(pbmc, normalization.method = "LogNormalize", scale.factor = 10000)

pbmc <- FindVariableFeatures(pbmc, selection.method = "vst", nfeatures = 5000)
all.genes <- rownames(pbmc)
pbmc <- ScaleData(pbmc, features = all.genes)
pbmc <- RunPCA(pbmc, features = VariableFeatures(object = pbmc),npcs = 150)
pbmc <- RunUMAP(pbmc, dims = 1:50)
DimPlot(pbmc, reduction = "umap")
saveRDS(pbmc,file='pbmc.RDS')
VEC = pbmc@[email protected]
rownames(VEC) = colnames(pbmc)
PCA = pbmc@[email protected]

source('https://raw.githubusercontent.com/jumphone/Vector/master/Vector.R')

# Remove quantile-based colinearity among PCs (new feature in VECTOR 0.0.3):
PCA=vector.rankPCA(PCA)
source('https://raw.githubusercontent.com/jumphone/Vector/master/Vector.R')
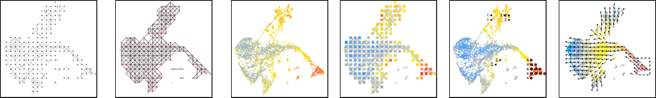
# Define pixel
OUT=vector.buildGrid(VEC, N=30,SHOW=TRUE)
# Build network
OUT=vector.buildNet(OUT, CUT=1, SHOW=TRUE)
# Calculate Quantile Polarization (QP) score
OUT=vector.getValue(OUT, PCA, SHOW=TRUE)
# Get pixel's QP score
OUT=vector.gridValue(OUT,SHOW=TRUE)
# Find starting point
OUT=vector.autoCenter(OUT,UP=0.9,SHOW=TRUE)
# Infer vector
OUT=vector.drawArrow(OUT,P=0.9,SHOW=TRUE, COL=OUT$COL, SHOW.SUMMIT=TRUE)
# OUT$P.PS : Peseudotime Score (PS) of each cell
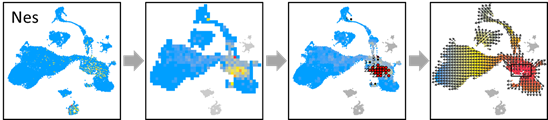
NES.EXP = pbmc@assays$RNA@data[which(rownames(pbmc) =='Nes'),]
OUT=vector.buildGrid(VEC, N=30,SHOW=TRUE)
OUT=vector.buildNet(OUT, CUT=1, SHOW=TRUE)
OUT=vector.getValue(OUT, PCA, SHOW=TRUE)

OUT$VALUE=NES.EXP

OUT=vector.showValue(OUT)
OUT=vector.gridValue(OUT, SHOW=TRUE)
OUT=vector.autoCenter(OUT,UP=0.9,SHOW=TRUE)
OUT=vector.drawArrow(OUT,P=0.9,SHOW=TRUE, COL=OUT$COL)
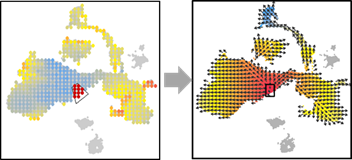
OUT=vector.buildGrid(VEC, N=30,SHOW=TRUE)
OUT=vector.buildNet(OUT, CUT=1, SHOW=TRUE)
OUT=vector.getValue(OUT, PCA, SHOW=TRUE)
OUT=vector.gridValue(OUT,SHOW=TRUE)

OUT=vector.selectCenter(OUT)

OUT=vector.drawArrow(OUT,P=0.9,SHOW=TRUE, COL=OUT$COL)
OUT=vector.buildGrid(VEC, N=30,SHOW=TRUE)
OUT=vector.buildNet(OUT, CUT=1, SHOW=TRUE)
OUT=vector.getValue(OUT, PCA, SHOW=TRUE)
OUT=vector.gridValue(OUT,SHOW=TRUE)
OUT=vector.autoCenter(OUT,UP=0.9,SHOW=TRUE)
OUT=vector.drawArrow(OUT,P=0.9,SHOW=TRUE, COL=OUT$COL)
#######################
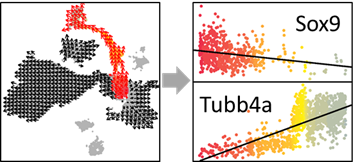
OUT=vector.reDrawArrow(OUT, COL=OUT$COL)
OUT=vector.selectRegion(OUT)
#######################
SELECT_PS=OUT$SELECT_PS #Peseudotime Score (PS) of selected cells
SELECT_INDEX=OUT$SELECT_INDEX #Index of selected cells in the expression matrix
SELECT_COL=OUT$COL[OUT$SELECT_INDEX] #Colors
#######################
# Identify development related genes
EXP=as.matrix(pbmc@assays$RNA@data)[which(rownames(pbmc) %in% VariableFeatures(pbmc)),SELECT_INDEX]
COR=c()
i=1
while(i<=nrow(EXP)){
this_cor=cor(SELECT_PS, EXP[i,],method='spearman')
COR=c(COR,this_cor)
if(i %%100==1){print(i)}
i=i+1}
names(COR)=rownames(EXP)
head(sort(COR),n=10) #Decreasing (top 10)
tail(sort(COR),n=10) #Increasing (top 10)
# Select one gene to draw figure
show_gene=names(head(sort(COR),n=10))[1]
show_gene.exp=EXP[which(rownames(EXP)==show_gene),]
# Smooth expression value along pesudotime order (optional)
show_gene.exp[order(SELECT_PS)]=smooth.spline(show_gene.exp[order(SELECT_PS)], df=5)$y
# Draw figure
plot(jitter(SELECT_PS), show_gene.exp, pch=16,col=SELECT_COL, ylab=show_gene,xlab='PS')
show_gene.fit=lm(show_gene.exp~SELECT_PS)
abline(show_gene.fit,col='black',lwd=1)
# Get UMAP:
VEC = cds@reducedDims$UMAP
colnames(VEC) = c('UMAP_1','UMAP_2')

# or
VEC = cds@int_colData$reducedDims$UMAP
colnames(VEC) = c('UMAP_1','UMAP_2')

# Get 150 PCs
library(Seurat)
DATA=as.matrix(cds@assays$data[[1]])
pbmc <- CreateSeuratObject(counts = DATA, project = "pbmc3k", min.cells = 0, min.features = 0)
pbmc <- NormalizeData(pbmc, normalization.method = "LogNormalize", scale.factor = 10000)
pbmc <- FindVariableFeatures(pbmc, selection.method = "vst", nfeatures = 5000)
all.genes <- rownames(pbmc)
pbmc <- ScaleData(pbmc, features = all.genes)
pbmc <- RunPCA(pbmc, features = VariableFeatures(object = pbmc),npcs = 150)
PCA = pbmc@[email protected]


