k8spacket / k8spacket Goto Github PK
View Code? Open in Web Editor NEWk8spacket - collects TCP traffic and TLS connection metadata in the Kubernetes cluster using eBPF and visualizes in Grafana
License: Apache License 2.0
k8spacket - collects TCP traffic and TLS connection metadata in the Kubernetes cluster using eBPF and visualizes in Grafana
License: Apache License 2.0
Hi, my k8spacket pods are Rollback restarting and on logs I see this:
2023/09/04 13:07:05 Refreshing interfaces for capturing...
2023/09/04 13:07:05 Starting capture on interface "calic816fde54ba"
2023/09/04 13:07:05 Starting capture on interface "MULTICAST"
2023/09/04 13:07:05 Starting capture on interface "LOWER_UP> mtu 1400 qdisc noqueue state UP group default qlen 1000"
2023/09/04 13:07:05 Starting capture on interface "UP"
2023/09/04 13:07:05 Starting capture on interface "3: eno1.4020@eno1: <BROADCAST"
2023/09/04 13:07:05 Starting capture on interface "cali96835af48d2"
Getting k8s resources
2023/09/04 13:07:05 Starting capture on interface "calia58eb8e389d"
2023/09/04 13:07:05 Starting capture on interface "cali4cb50dd9858"
2023/09/04 13:07:05 Starting capture on interface "calia6620d21b69"
2023/09/04 13:07:05 Starting capture on interface "cali627dbb76466"
2023/09/04 13:07:05 Starting capture on interface "cali827f318ffe4"
2023/09/04 13:07:05 Starting capture on interface "calid6155257109"
2023/09/04 13:07:05 error opening pcap handle: LOWER_UP> mtu 1400 qdisc noqueue state UP group default qlen 1000: No such device exists (No such device exists)
As you can see there some bad interfaces name, like "UP", "LOWER_UP> ....", "MULTICAST".

Why don't used k8s clouster network ?
mybe, the monitor message direction is this:
user --> k8s ingress-controller
                    |--> grafana
                              |---> k8spackage service
                                           |--> k8spacket pod 2
                                           |--> k8spacket pod 3
                                           |--> k8spacket pod 1
Caveat: I am not sure if this is k8spacket or a Grafana issue
I tried installing k8spacket to test it out. I currently have a cluster running the kube-prometheus-stack, which works fine and runs on the latest Helm chart version (58.0.0). I installed the Helm chart for the K8spacket, which also works fine. Modified my values.yaml of the kube-prometheus-stack as follows:
grafana:
  env:
    GF_INSTALL_PLUGINS: hamedkarbasi93-nodegraphapi-datasource,marcusolsson-json-datasource,marcusolsson-dynamictext-panel
  deploymentStrategy:
    type: Recreate
  additionalDataSources:
  - name: "Node Graph API"
    jsonData:
      url: "http://k8spacket.k8spacket.svc.cluster.local:8080/nodegraph"
    access: "proxy"
    basicAuth: false
    isDefault: false
    readOnly: false
    type: "hamedkarbasi93-nodegraphapi-datasource"
    typeLogoUrl: "public/plugins/hamedkarbasi93-nodegraphapi-datasource/img/logo.svg"
    typeName: "node-graph-plugin"
    orgId: 1
    version: 1
  - name: "JSON API"
    url: "http://k8spacket.k8spacket.svc.cluster.local:8080/tlsparser/api/data"
    access: "proxy"
    basicAuth: false
    isDefault: false
    readOnly: false
    type: "marcusolsson-json-datasource"
    typeLogoUrl: "public/plugins/marcusolsson-json-datasource/img/logo.svg"
    typeName: "json-api-plugin"
    orgId: 1
    version: 1
  sidecar:
    dashboards:
      searchNamespace: ALL
      provider:
        foldersFromFilesStructure: true

prometheus:
  prometheusSpec:
    retention: 14d
    logLevel: warn
    serviceMonitorSelectorNilUsesHelmValues: false
    ruleSelectorNilUsesHelmValues: false
    podMonitorSelectorNilUsesHelmValues: false
    additionalScrapeConfigs:
    - job_name: "k8spacket-metrics"
      metrics_path: /metrics
      scrape_interval: 25s
      static_configs:
      - targets: [k8spacket.k8spacket.svc.cluster.local:8080]
So far, so good; I can see the data sources in Grafana and the test clear in the UI. I deployed my Grafana dashboards ( kubectl -n $GRAFANA_NS apply --recursive -f ./dashboards and I can see those also appear in Grafana. When I go to the node graph dashboard, I get the following

When I edit the dashboard, select the datasource and add the query again, it starts to work.

I exported that working dashboard and couldn't really see a difference between the export and the original. The exported yaml is:
{
  "annotations": {
    "list": [
      {
        "builtIn": 1,
        "datasource": {
          "type": "grafana",
          "uid": "-- Grafana --"
        },
        "enable": true,
        "hide": true,
        "iconColor": "rgba(0, 211, 255, 1)",
        "name": "Annotations & Alerts",
        "type": "dashboard"
      }
    ]
  },
  "editable": true,
  "fiscalYearStartMonth": 0,
  "graphTooltip": 0,
  "id": 2529,
  "links": [],
  "liveNow": false,
  "panels": [
    {
      "datasource": {
        "type": "hamedkarbasi93-nodegraphapi-datasource",
        "uid": "PC93AC6A0E760905D"
      },
      "gridPos": {
        "h": 31,
        "w": 24,
        "x": 0,
        "y": 0
      },
      "id": 2,
      "options": {
        "edges": {},
        "nodes": {}
      },
      "targets": [
        {
          "datasource": {
            "type": "hamedkarbasi93-nodegraphapi-datasource",
            "uid": "PC93AC6A0E760905D"
          },
          "queryText": "namespace=$namespace&include=$include&exclude=$exclude&stats-type=$statstype&from=${__from}&to=${__to}",
          "refId": "A"
        }
      ],
      "title": "Node graph",
      "type": "nodeGraph"
    }
  ],
  "refresh": "",
  "schemaVersion": 39,
  "tags": [
    "k8spacket"
  ],
  "templating": {
    "list": [
      {
        "current": {
          "selected": false,
          "text": "connection",
          "value": "connection"
        },
        "hide": 0,
        "includeAll": false,
        "label": "graph mode",
        "multi": false,
        "name": "statstype",
        "options": [
          {
            "selected": true,
            "text": "connection",
            "value": "connection"
          },
          {
            "selected": false,
            "text": "bytes",
            "value": "bytes"
          },
          {
            "selected": false,
            "text": "duration",
            "value": "duration"
          }
        ],
        "query": "connection,bytes,duration",
        "queryValue": "",
        "skipUrlSync": false,
        "type": "custom"
      },
      {
        "current": {
          "selected": false,
          "text": "",
          "value": ""
        },
        "description": "",
        "hide": 0,
        "label": "namespace (regexp)",
        "name": "namespace",
        "options": [
          {
            "selected": true,
            "text": "",
            "value": ""
          }
        ],
        "query": "",
        "skipUrlSync": false,
        "type": "textbox"
      },
      {
        "current": {
          "selected": false,
          "text": "",
          "value": ""
        },
        "hide": 0,
        "label": "include name (regexp)",
        "name": "include",
        "options": [
          {
            "selected": true,
            "text": "",
            "value": ""
          }
        ],
        "query": "",
        "skipUrlSync": false,
        "type": "textbox"
      },
      {
        "current": {
          "selected": false,
          "text": "",
          "value": ""
        },
        "hide": 0,
        "label": "exclude name (regexp)",
        "name": "exclude",
        "options": [
          {
            "selected": true,
            "text": "",
            "value": ""
          }
        ],
        "query": "",
        "skipUrlSync": false,
        "type": "textbox"
      },
      {
        "current": {
          "selected": false,
          "text": "Node Graph API",
          "value": "PC93AC6A0E760905D"
        },
        "hide": 2,
        "includeAll": false,
        "multi": false,
        "name": "datasource",
        "options": [],
        "query": "hamedkarbasi93-nodegraphapi-datasource",
        "queryValue": "",
        "refresh": 1,
        "regex": "",
        "skipUrlSync": false,
        "type": "datasource"
      }
    ]
  },
  "time": {
    "from": "now-6h",
    "to": "now"
  },
  "timepicker": {},
  "timezone": "",
  "title": "k8spacket - node graph",
  "uid": "fdad1ee1-a619-493d-b0ff-2ca2682fdc57",
  "version": 1,
  "weekStart": ""
}
My hunch is that it automatically falls back to the default data source, which, in my case, is the Prometheus one. I am not 100% sure how to set the correct one.
when me in pod weget k8spacket.k8spacket.svc.cluster.local:8080/nodegraph:
/ # wget http://k8spacket.k8spacket.svc.cluster.local:8080/nodegraph/
Connecting to k8spacket.k8spacket.svc.cluster.local:8080 (10.43.92.47:8080)
wget: server returned error: HTTP/1.1 404 Not Found
/ # wget http://k8spacket.k8spacket.svc.cluster.local:8080/nodegraph
Connecting to k8spacket.k8spacket.svc.cluster.local:8080 (10.43.92.47:8080)
wget: server returned error: HTTP/1.1 404 Not Found
this is my pod status:
k8spacket-7k67h                      1/1     Running            0          91m
k8spacket-cwj6h                      1/1     Running            0          91m
k8spacket-fwd6c                      0/1     CrashLoopBackOff   25         91m
k8spacket-j9rs2                      1/1     Running            0          91m
k8spacket-n68cc                      1/1     Running            1          91m
k8spacket-sjfjt                      1/1     Running            4          91m
and this is my grafana datasource yaml:
{
    "apiVersion": 1,
    "datasources": [
        {
            "name": "Node Graph API",
            "jsonData": {
              "url": "http://k8spacket.k8spacket.svc.cluster.local:8080/nodegraph"
            },
            "access": "proxy",
            "basicAuth": false,
            "isDefault": false,
            "readOnly": false,
            "type": "hamedkarbasi93-nodegraphapi-datasource",
            "typeLogoUrl": "public/plugins/hamedkarbasi93-nodegraphapi-datasource/img/logo.svg",
            "typeName": "node-graph-plugin",
            "orgId": 1,
            "version": 1
          },
          {
            "name": "JSON API",
            "url": "http://k8spacket.k8spacket.svc.cluster.local:8080/tlsparser/api/data",
            "access": "proxy",
            "basicAuth": false,
            "isDefault": false,
            "readOnly": false,
            "type": "marcusolsson-json-datasource",
            "typeLogoUrl": "public/plugins/marcusolsson-json-datasource/img/logo.svg",
            "typeName": "json-api-plugin",
            "orgId": 1,
            "version": 1
          }
    ]
}Dear,
I met a problem,my k8spacket pod never got the two *.so ,i didn't know whether it is related to the previous issue about $(path), which lead to this problem :
nodegraph-x86_64.so
tls-parser-x86_64.so
So I tried to download the two *.so , when the pod is ok, I use kubectl cp ,copy the two *.so into the pod's /home/k8spacket/plugins,the grafana is normal
after a while , the pod k8spacket begun to restart, and the /home/k8spacket/plugins/*.so are missing ,of course.
I found the reason,from the log:
`panic: interface conversion: gopacket.TransportLayer is nil, not *layers.TCP
goroutine 13 [running]:
github.com/k8spacket/k8spacket/tcp.listenInterface({0xc000044106, 0xf}, {0x20d08c4, 0x3})
/home/k8spacket/tcp/tcp.go:52 +0x6e8
created by github.com/k8spacket/k8spacket/tcp.interfacesRefresher
/home/k8spacket/tcp/tcp.go:88 +0x1cals`
So what cause this problem and how to slove it , thx
this is my error:
State: Waiting
Reason: CrashLoopBackOff
Last State: Terminated
Reason: Error
Message: Connecting to files.m.daocloud.io (113.31.105.121:443)
wget: note: TLS certificate validation not implemented
wget: TLS error from peer (alert code 80): internal error
wget: error getting response: Connection reset by peer
Hi folks, congratulation on this awesome project.
I'm working on GKE with Managed Prometheus. I was able to deploy the k8spacket with helm and apparently, it's working properly.
2023/01/03 10:39:32 [nodegraph plugin] Connection: src=10.80.1.1 srcName=N/A srcPort=38732 srcNS= dst=10.80.1.71 dstName=pod.prometheus-6d4bdcb6f7-bdbgn dstPort=9090 dstNS=gmp-system closed=true bytesSent=111 bytesReceived=168 duration=1.9404e-05
2023/01/03 10:39:32 [nodegraph plugin] Connection: src=10.80.1.1 srcName=N/A srcPort=38730 srcNS= dst=10.80.1.71 dstName=pod.prometheus-6d4bdcb6f7-bdbgn dstPort=9090 dstNS=gmp-system closed=true bytesSent=109 bytesReceived=166 duration=0.000105884
2023/01/03 10:39:35 [nodegraph plugin] Connection: src=10.80.1.1 srcName=N/A srcPort=45910 srcNS= dst=10.80.1.145 dstName=pod.grafana-deployment-846c46f9f6-6p7hw dstPort=3000 dstNS=gmp-system closed=true bytesSent=113 bytesReceived=357 duration=1.5131e-05
2023/01/03 10:39:35 [nodegraph plugin] Connection: src=10.80.1.1 srcName=N/A srcPort=45908 srcNS= dst=10.80.1.145 dstName=pod.grafana-deployment-846c46f9f6-6p7hw dstPort=3000 dstNS=gmp-system closed=true bytesSent=113 bytesReceived=357 duration=0.000101168
Unfortunately, after the data sources have been configured properly, then the Dashboards don't show anything.
I think I have to configure the additional scrape config in Managed Prometheus, but I am not able to do it.
Do you know how I can do it? Thanks in advance
DASHBOARD
Hello, any chance port will be configurable in the future ?
getting 404 error for /nodegraph path
I install on minikube 1.22.1

Hi
after installing helm chart version 0.1.1
the pods cant start , regarding "standard_init_linux.go:219: exec user process caused: operation not permitted" errors on pods
is this app capable to run on openshift platform ?
the pod will restart frequently, I have tried to adjust the timeout of prod, but it still can't solve the problem


Hey there! using this tool I can list all traffic and then there is a dedicated metric for all TLS traffic. What i am trying to achieve - I would like to easily identify all traffic within cluster which is not encrypted.
Would it be possible to have a dedicated metric for plaintext traffic? Or maybe there is already a way to do so?
Would it make sense to provide a krew plugin so this could be used via kubectl?
Hi, I want to monitor external transmit and receive traffics of pod. External traffic means traffic that send or receive from outside of k8s cluster.
Can you help me please?
The endpoint (/api/graph/data) cannot obtain data after deployment
k8spacket version: 1.1.1
granfana version: 9.5.3
k8s version :1.21
Endpoint data return:

k8spacket log:

grafana dashboard:

I think this tool has very good potential and really liking it so far.
I found the instructions (especially the install/setup) to be lacking for newbies (like me).
I have added some steps that might help newer K8s users to get this installed and operational.
Thanks for all the hard work.
k8spacket-readme-suggestions.txt


URL填的是http://k8spacket.k8spacket.svc.cluster.local:8080/nodegraph
,但是点击test,提示not found 404,请问是什么原因啊?k8spacket和grafana pod都正常运行。Prometheus metrics指标也有结果。
I followed the deployment instructions for k8spacket in this article.
helm repo add k8spacket https://k8spacket.github.io/k8spacket-helm-chart
helm repo update
helm install k8spacket --namespace k8spacket k8spacket/k8spacket --create-namespace
My environment is:
❯ minikube config view
- container-runtime: containerd
- cpus: 6
- disk-size: 100gb
- driver: docker
- memory: 16384
Here is the error log of the k8spacket container.
Stream closed EOF for k8spacket/k8spacket-m5bnf (k8spacket)
init-k8spacket Connecting to github.com (140.82.113.3:443)
init-k8spacket wget: note: TLS certificate validation not implemented
init-k8spacket Connecting to objects.githubusercontent.com (185.199.110.133:443)
init-k8spacket saving to 'nodegraph.so'
init-k8spacket nodegraph.so          18% |*****                           | 11.0M  0:00:04 ETA
init-k8spacket nodegraph.so          61% |*******************             | 36.6M  0:00:01 ETA
init-k8spacket nodegraph.so         100% |********************************| 59.9M  0:00:00 ETA
init-k8spacket 'nodegraph.so' saved
init-k8spacket Connecting to github.com (140.82.113.3:443)
init-k8spacket Connecting to objects.githubusercontent.com (185.199.110.133:443)
init-k8spacket saving to 'tls-parser.so'
init-k8spacket tls-parser.so          0% |                                |  383k  0:02:39 ETA
init-k8spacket tls-parser.so         22% |*******                         | 13.5M  0:00:06 ETA
init-k8spacket tls-parser.so         49% |***************                 | 29.9M  0:00:03 ETA
init-k8spacket tls-parser.so         87% |***************************     | 52.2M  0:00:00 ETA
init-k8spacket tls-parser.so        100% |********************************| 59.9M  0:00:00 ETA
init-k8spacket 'tls-parser.so' saved
k8spacket plugins/nodegraph.so
k8spacket plugins/tls-parser.so
k8spacket 2023/01/07 20:58:41 Serving requests on port 6676
k8spacket 2023/01/07 20:58:41 Refreshing interfaces for capturing...
k8spacket 2023/01/07 20:58:41 Starting capture on interface "veth84b2a72"
k8spacket 2023/01/07 20:58:41 Starting capture on interface "vethb462699"
k8spacket 2023/01/07 20:58:41 Starting capture on interface "veth7b0e04b"
k8spacket 2023/01/07 20:58:41 Starting capture on interface "veth0abff89"
k8spacket 2023/01/07 20:58:41 Starting capture on interface "veth4031cb9"
k8spacket 2023/01/07 20:58:41 Starting capture on interface "veth5bdbd8c"
k8spacket Getting k8s resources
k8spacket 2023/01/07 20:58:41 Starting capture on interface "veth8ba07b7"
k8spacket 2023/01/07 20:58:41 Starting capture on interface "veth91a8e8c"
k8spacket 2023/01/07 20:58:41 Starting capture on interface "veth5177087"
k8spacket 2023/01/07 20:58:41 Starting capture on interface "vethe239822"
k8spacket 2023/01/07 20:58:42 Starting capture on interface "veth5a3dbdd"
k8spacket 2023/01/07 20:58:42 Starting capture on interface "eth0"
k8spacket 2023/01/07 20:58:42 Starting capture on interface "vethf2fa26d"
k8spacket 2023/01/07 20:58:42 Starting capture on interface "veth687836e"
k8spacket 2023/01/07 20:58:42 Starting capture on interface "veth78d1f7a"
k8spacket 2023/01/07 20:58:42 error opening pcap handle: vethf2fa26d: SIOCETHTOOL(ETHTOOL_GET_TS_INFO) ioctl failed: Function not implemented
k8spacket 2023/01/07 20:58:42 error opening pcap handle: veth5177087: SIOCETHTOOL(ETHTOOL_GET_TS_INFO) ioctl failed: Function not implemented
k8spacket 2023/01/07 20:58:42 error opening pcap handle: veth78d1f7a: SIOCETHTOOL(ETHTOOL_GET_TS_INFO) ioctl failed: Function not implemented
k8spacket 2023/01/07 20:58:42 Starting capture on interface "vethd7d6cdc"
k8spacket 2023/01/07 20:58:42 Starting capture on interface "vethece1508"
k8spacket 2023/01/07 20:58:42 error opening pcap handle: vethb462699: SIOCETHTOOL(ETHTOOL_GET_TS_INFO) ioctl failed: Function not implemented
k8spacket 2023/01/07 20:58:42 error opening pcap handle: veth91a8e8c: SIOCETHTOOL(ETHTOOL_GET_TS_INFO) ioctl failed: Function not implemented
k8spacket 2023/01/07 20:58:42 Starting capture on interface "veth1b7fb6b"
Stream closed EOF for k8spacket/k8spacket-m5bnf (init-k8spacket)
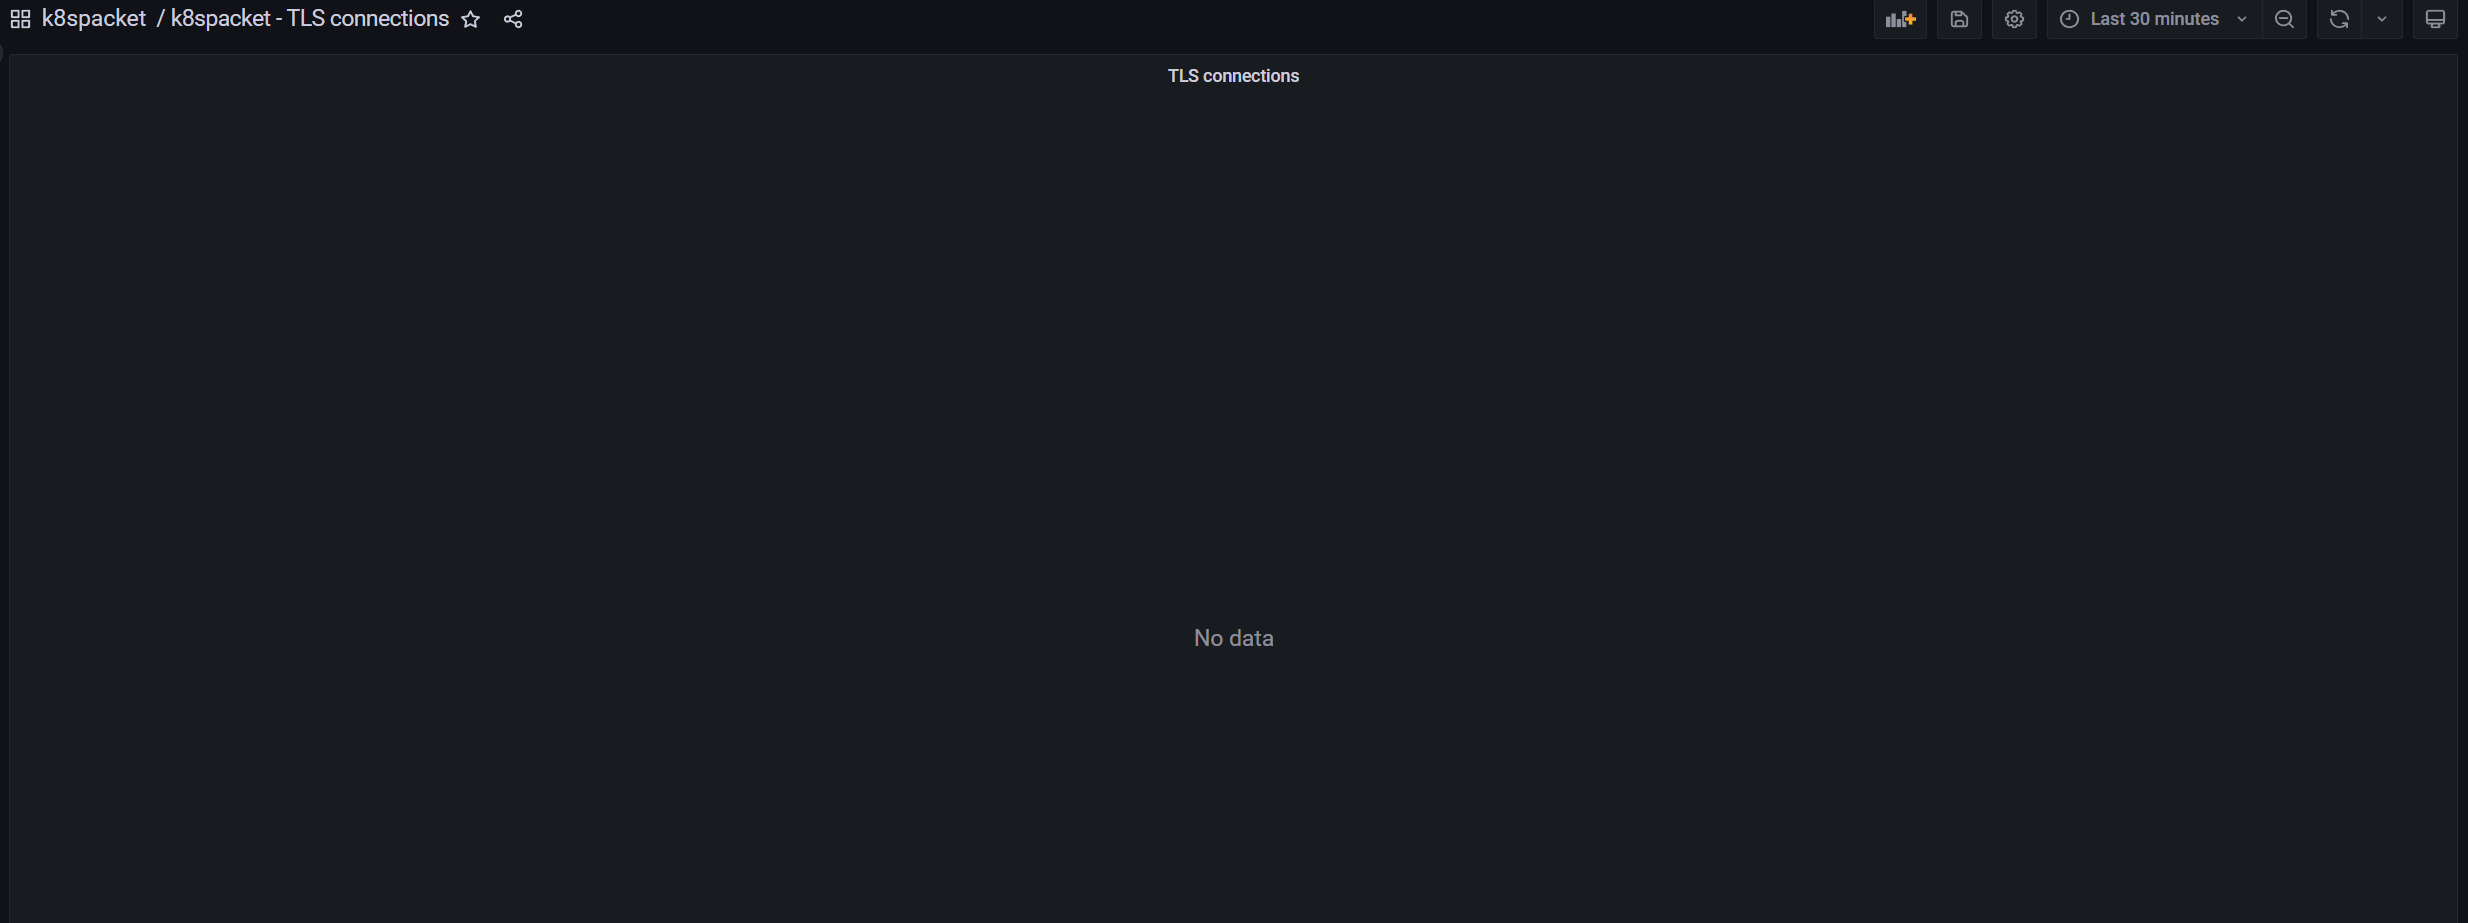
The Grafana graph to show TLS connections & certificates is blank and shows an error.
<html> <head><title>404 Not Found</title></head> <body> <center><h1>404 Not Found</h1></center> <hr><center>nginx/1.20.2</center> </body> </html> <!-- a padding to disable MSIE and Chrome friendly error page --> <!-- a padding to disable MSIE and Chrome friendly error page --> <!-- a padding to disable MSIE and Chrome friendly error page --> <!-- a padding to disable MSIE and Chrome friendly error page --> <!-- a padding to disable MSIE and Chrome friendly error page --> <!-- a padding to disable MSIE and Chrome friendly error page -->status:404
statusText:"Not Found"
data:Object
message:"<html>
<head><title>404 Not Found</title></head>
<body>
<center><h1>404 Not Found</h1></center>
<hr><center>nginx/1.20.2</center>
</body>
</html>
<!-- a padding to disable MSIE and Chrome friendly error page -->
<!-- a padding to disable MSIE and Chrome friendly error page -->
<!-- a padding to disable MSIE and Chrome friendly error page -->
<!-- a padding to disable MSIE and Chrome friendly error page -->
<!-- a padding to disable MSIE and Chrome friendly error page -->
<!-- a padding to disable MSIE and Chrome friendly error page -->
"
error:"Not Found"
response:"<html>
<head><title>404 Not Found</title></head>
<body>
<center><h1>404 Not Found</h1></center>
<hr><center>nginx/1.20.2</center>
</body>
</html>
<!-- a padding to disable MSIE and Chrome friendly error page -->
<!-- a padding to disable MSIE and Chrome friendly error page -->
<!-- a padding to disable MSIE and Chrome friendly error page -->
<!-- a padding to disable MSIE and Chrome friendly error page -->
<!-- a padding to disable MSIE and Chrome friendly error page -->
<!-- a padding to disable MSIE and Chrome friendly error page -->
"
config:Object
url:"api/datasources/proxy/1"
method:"GET"
headers:Object
retry:0
hideFromInspector:false
message:"<html>
<head><title>404 Not Found</title></head>
<body>
<center><h1>404 Not Found</h1></center>
<hr><center>nginx/1.20.2</center>
</body>
</html>
<!-- a padding to disable MSIE and Chrome friendly error page -->
<!-- a padding to disable MSIE and Chrome friendly error page -->
<!-- a padding to disable MSIE and Chrome friendly error page -->
<!-- a padding to disable MSIE and Chrome friendly error page -->
<!-- a padding to disable MSIE and Chrome friendly error page -->
<!-- a padding to disable MSIE and Chrome friendly error page -->
"helm install kube-prometheus prometheus-community/kube-prometheus-stack --v43.1.1helm install -n k8spacket k8spacket/k8spacket --version 1.1.1helm upgrade kube-prometheus --v43.1.1 -f helm_grafana_patch_k8spacket_plugins.yamlkubectl apply -n monitoring -R -f ~/k8s/k8spacket/v1.1.1/git/k8spacket/dashboards/grafana:
env:
GF_INSTALL_PLUGINS: hamedkarbasi93-nodegraphapi-datasource,marcusolsson-json-datasource,marcusolsson-dynamictext-panel
datasources:
nodegraphapi-plugin-datasource.yaml:
apiVersion: 1
datasources:
- name: "Node Graph API"
jsonData:
url: "http://k8spacket.k8spacket.svc.cluster.local:8080/nodegraph"
access: "proxy"
basicAuth: false
isDefault: false
readOnly: false
type: "hamedkarbasi93-nodegraphapi-datasource"
typeLogoUrl: "public/plugins/hamedkarbasi93-nodegraphapi-datasource/img/logo.svg"
typeName: "node-graph-plugin"
orgId: 1
version: 1
marcusolsson-json-datasource.yaml:
apiVersion: 1
datasources:
- name: "JSON API"
url: "http://k8spacket.k8spacket.svc.cluster.local:8080/tlsparser/api/data"
access: "proxy"
basicAuth: false
isDefault: false
readOnly: false
type: "marcusolsson-json-datasource"
typeLogoUrl: "public/plugins/marcusolsson-json-datasource/img/logo.svg"
typeName: "json-api-plugin"
orgId: 1
version: 1kubectl version
WARNING: This version information is deprecated and will be replaced with the output from kubectl version --short. Use --output=yaml|json to get the full version.
Client Version: version.Info{Major:"1", Minor:"24", GitVersion:"v1.24.2", GitCommit:"f66044f4361b9f1f96f0053dd46cb7dce5e990a8", GitTreeState:"clean", BuildDate:"2022-06-15T14:22:29Z", GoVersion:"go1.18.3", Compiler:"gc", Platform:"linux/amd64"}
Kustomize Version: v4.5.4
Server Version: version.Info{Major:"1", Minor:"24", GitVersion:"v1.24.2", GitCommit:"f66044f4361b9f1f96f0053dd46cb7dce5e990a8", GitTreeState:"clean", BuildDate:"2022-06-15T14:15:38Z", GoVersion:"go1.18.3", Compiler:"gc", Platform:"linux/amd64"}{
"id": 4,
"gridPos": {
"h": 9,
"w": 24,
"x": 0,
"y": 0
},
"type": "table",
"title": "TLS Connections",
"datasource": {
"type": "marcusolsson-json-datasource",
"uid": "${datasource}"
},
"pluginVersion": "9.3.1",
"fieldConfig": {
"defaults": {
"custom": {
"align": "center",
"displayMode": "auto",
"inspect": false,
"filterable": true,
"minWidth": 50
},
"mappings": [],
"thresholds": {
"mode": "absolute",
"steps": [
{
"color": "green",
"value": null
},
{
"color": "red",
"value": 80
}
]
},
"color": {
"mode": "thresholds"
},
"links": [
{
"title": "Show details",
"url": "/d/_WjaqJt4k/k8spacket-tls-connections-and-certificates?var-id=${__data.fields[\"id\"]}"
}
]
},
"overrides": [
{
"matcher": {
"id": "byName",
"options": "id"
},
"properties": [
{
"id": "custom.hidden",
"value": true
}
]
}
]
},
"options": {
"showHeader": true,
"footer": {
"show": false,
"reducer": [
"sum"
],
"fields": "",
"enablePagination": false
},
"sortBy": [
{
"desc": true,
"displayName": "usedTLSVersion"
}
]
},
"targets": [
{
"cacheDurationSeconds": 300,
"datasource": {
"type": "marcusolsson-json-datasource",
"uid": "${datasource}"
},
"fields": [
{
"jsonPath": "$[*].src",
"name": "src"
},
{
"jsonPath": "$[*].srcName",
"language": "jsonpath",
"name": "srcName"
},
{
"jsonPath": "$[*].srcNamespace",
"language": "jsonpath",
"name": "srcNamespace"
},
{
"jsonPath": "$[*].dst",
"language": "jsonpath",
"name": "dst"
},
{
"jsonPath": "$[*].dstName",
"language": "jsonpath",
"name": "dstName"
},
{
"jsonPath": "$[*].dstPort",
"language": "jsonpath",
"name": "dstPort"
},
{
"jsonPath": "$[*].domain",
"language": "jsonpath",
"name": "domain"
},
{
"jsonPath": "$[*].usedTLSVersion",
"language": "jsonpath",
"name": "usedTLSVersion"
},
{
"jsonPath": "$[*].usedCipherSuite",
"language": "jsonpath",
"name": "usedCipherSuite"
},
{
"jsonPath": "$[*].id",
"language": "jsonpath",
"name": "id"
}
],
"method": "GET",
"queryParams": "",
"refId": "A",
"urlPath": ""
}
]
}There is a problem with the test in the grafana data source, and the panel has no data


How to check availability after deploying k8spacket?

Check that the metrics are available. It is normal for curl 10.64.41.146:8080/nodegraph to output 404 page not found. If it is normal, is there any configuration requirement for grafana? It cannot be displayed after online deployment
When deploying k8spacket in our cluster its not able to find the needed plugins, however they are available in the plugins directory
I'm getting this error message
2024/03/27 12:58:02 [k8spacket] [plugins] Cannot find plugin TLSConsumerPlugin, gave up. plugin: symbol TLSConsumerPlugin not found in plugin github.com/k8spacket/plugins/nodegraph
2024/03/27 12:58:02 [k8spacket] [plugins] Cannot find plugin TCPConsumerPlugin, gave up. plugin: symbol TCPConsumerPlugin not found in plugin github.com/k8spacket/plugins/tls-parser
When moving the plugins into the directory where the k8spacket binary lives, I wont get this message. However the application fails to start up with the following error.
2024/03/27 13:29:27 [k8spacket] [api] Serving requests on port 6676
2024/03/27 13:29:27 [k8spacket] INIT inet
2024/03/27 13:29:27 [k8spacket] [inet] Cannot attach tracepoint: neither debugfs nor tracefs are mounted
panic: runtime error: invalid memory address or nil pointer dereference
[signal SIGSEGV: segmentation violation code=0x1 addr=0x0 pc=0x1e3e94f]

goroutine 8 [running]:
github.com/k8spacket/k8spacket/ebpf/inet.Init()
	/home/k8spacket/ebpf/inet/inet.go:54 +0x1af
created by github.com/k8spacket/k8spacket/ebpf.LoadEbpf in goroutine 1
	/home/k8spacket/ebpf/loader.go:20 +0x1a
What might be the problem here?
System:
AWS EKS
AmazonLinux 2
Deployed with helm
Repo github.com/k8spacket/k8spacket depends on github.com/likexian/[email protected].
https://github.com/k8spacket/k8spacket#L9
However, comparing version v1.14.2 of github.com/likexian/whois from proxy.golang.org and github, there are inconsistencies.
"committer": {
      "name": "Li Kexian",
      "email": "[email protected]",
      "date": "2022-07-10T06:13:31Z"
}{"Version":"v1.14.2","Time":"2022-07-03T10:11:43Z"}So the checksum from the code in github does not match the checksum saved in sum.golang.org. The v1.14.2 tag of github.com/likexian/whois might have been retagged after a minor edition on github. I guess you use proxy.golang.org to get dependencies, but that also shows that your project is depending on the copy of github.com/likexian/[email protected] before its edition. Depending upon such inconsistent tag version may also result in some unexpected errors as well as build errors due to different proxy settings.
For example, when someone who does not use proxy.golang.org, say GOPROXY=direct, attempts to get github.com/likexian/[email protected], the following error occurs.
go: downloading github.com/likexian/whois v1.14.2
go: github.com/likexian/whois@v1.14.2: verifying module: checksum mismatch
        downloaded: h1:W4nb1rz5H63VpFePWnNep24OGcwbeB3OYd8H8jd+Sro=
        sum.golang.org: h1:RFtXK/2PSgl6vG1beXEwB2zCkwUWhy7A9zh258iQTqg=

SECURITY ERROR
This download does NOT match the one reported by the checksum server.
The bits may have been replaced on the origin server, or an attacker may
have intercepted the download attempt.

For more information, see 'go help module-auth'.
So, this is a reminder in the hope that you can get rid of this problematic version of project github.com/likexian/whois.
github.com/likexian/whoisI would recommend bumping the version of github.com/likexian/whois to a new release to ensure dependency copy in proxy.golang.org and github in sync.
After completion of the command, I ran these below command as given
export NODE_PORT=$(kubectl get --namespace k8spacket -o jsonpath="{.spec.ports[0].nodePort}" services k8spacket)
export NODE_IP=$(kubectl get nodes --namespace k8spacket -o jsonpath="{.items[0].status.addresses[0].address}")
echo http://$NODE_IP:$NODE_PORT
Where I'm not getting port number.
When I tried to access through Grafana its showing no data found.
When I tried to access the service using port-forward using k8spacket its showing 404 page not found.
I'm receiving data in pods logs.
This error occurs after about 2 minutes of running the program.
2024/02/28 13:53:01 [nodegraph plugin] Connection: src=10.42.0.133 srcName=service-info-68744b99bd-6g88q srcPort=49444 srcNS=defaultdst=121.226.36.81 dstName= dstPort=4337 dstNS= closed=true bytesSent=1354 bytesReceived=649 duration=0.134677404
fatal error: concurrent map writes
k8spacket version: 1.2.1
k8s version: 1.21
Hi,
I use helm to install k8spacket. Pods not getting ready and after a while the state of pods will be crashloopbackoff
I use helm to install k8spacket but when I want to add JSON API datasource I get this error:
JSON API: Not Found
I use http://k8spacket.k8spacket.svc.cluster.local:8080/tlsparser/api/data as URL.
With curl has response code 301 Moved Permanently and with wget I can download the data.
As of now connection graph show all connection regardless of the time selected.
I'm new to Grafana and really like this tool, but I need to be able to show inter pod communication with ports. Can anyone point me in the right direction? Much appreciated
I am not using grafana stack, creating config maps for this doesn't work for me.
I tried to just use the json for import TLS connections graph.
Seems like I am unable to import it, no matter I try it manually or via API or just copy paste the json.
Any suggestions? By default Data source goes to Prometheus but after changing it o json all queries are lost.

When I use explore option and pass all the values manully it works

I encountered an issue following an installation. Upon reviewing the graph, I observed that metrics from previously deleted pods are still present. These metrics persist with the same fixed value recorded at the time of the pod's deletion. Could you please adjust the system so these old pods no longer transmit data, while ensuring their historical data remains accessible? Because if I will deploy this on the production cluster it will kill the Prometheus server after a few seconds. This also breaks the accuracy of the data and dashboard. Thank you.
A declarative, efficient, and flexible JavaScript library for building user interfaces.
🖖 Vue.js is a progressive, incrementally-adoptable JavaScript framework for building UI on the web.
TypeScript is a superset of JavaScript that compiles to clean JavaScript output.
An Open Source Machine Learning Framework for Everyone
The Web framework for perfectionists with deadlines.
A PHP framework for web artisans
Bring data to life with SVG, Canvas and HTML. 📊📈🎉
JavaScript (JS) is a lightweight interpreted programming language with first-class functions.
Some thing interesting about web. New door for the world.
A server is a program made to process requests and deliver data to clients.
Machine learning is a way of modeling and interpreting data that allows a piece of software to respond intelligently.
Some thing interesting about visualization, use data art
Some thing interesting about game, make everyone happy.
We are working to build community through open source technology. NB: members must have two-factor auth.
Open source projects and samples from Microsoft.
Google ❤️ Open Source for everyone.
Alibaba Open Source for everyone
Data-Driven Documents codes.
China tencent open source team.


