GithubHelp home page GithubHelp logo

kanaries / graphic-walker Goto Github PK

View Code? Open in Web Editor NEW
2.4K 10.0 126.0 3.18 MB

An open source alternative to Tableau. Embeddable visual analytic

Home Page: https://docs.kanaries.net/graphic-walker

License: Apache License 2.0

HTML 0.19% JavaScript 0.48% TypeScript 98.88% CSS 0.45%
tableau vega-lite visualization bi data-visualization pivot-table react data data-analysis data-mining

graphic-walker's Introduction

English | 简体中文 | 日本語

graphic-walker-banner

Graphic Walker

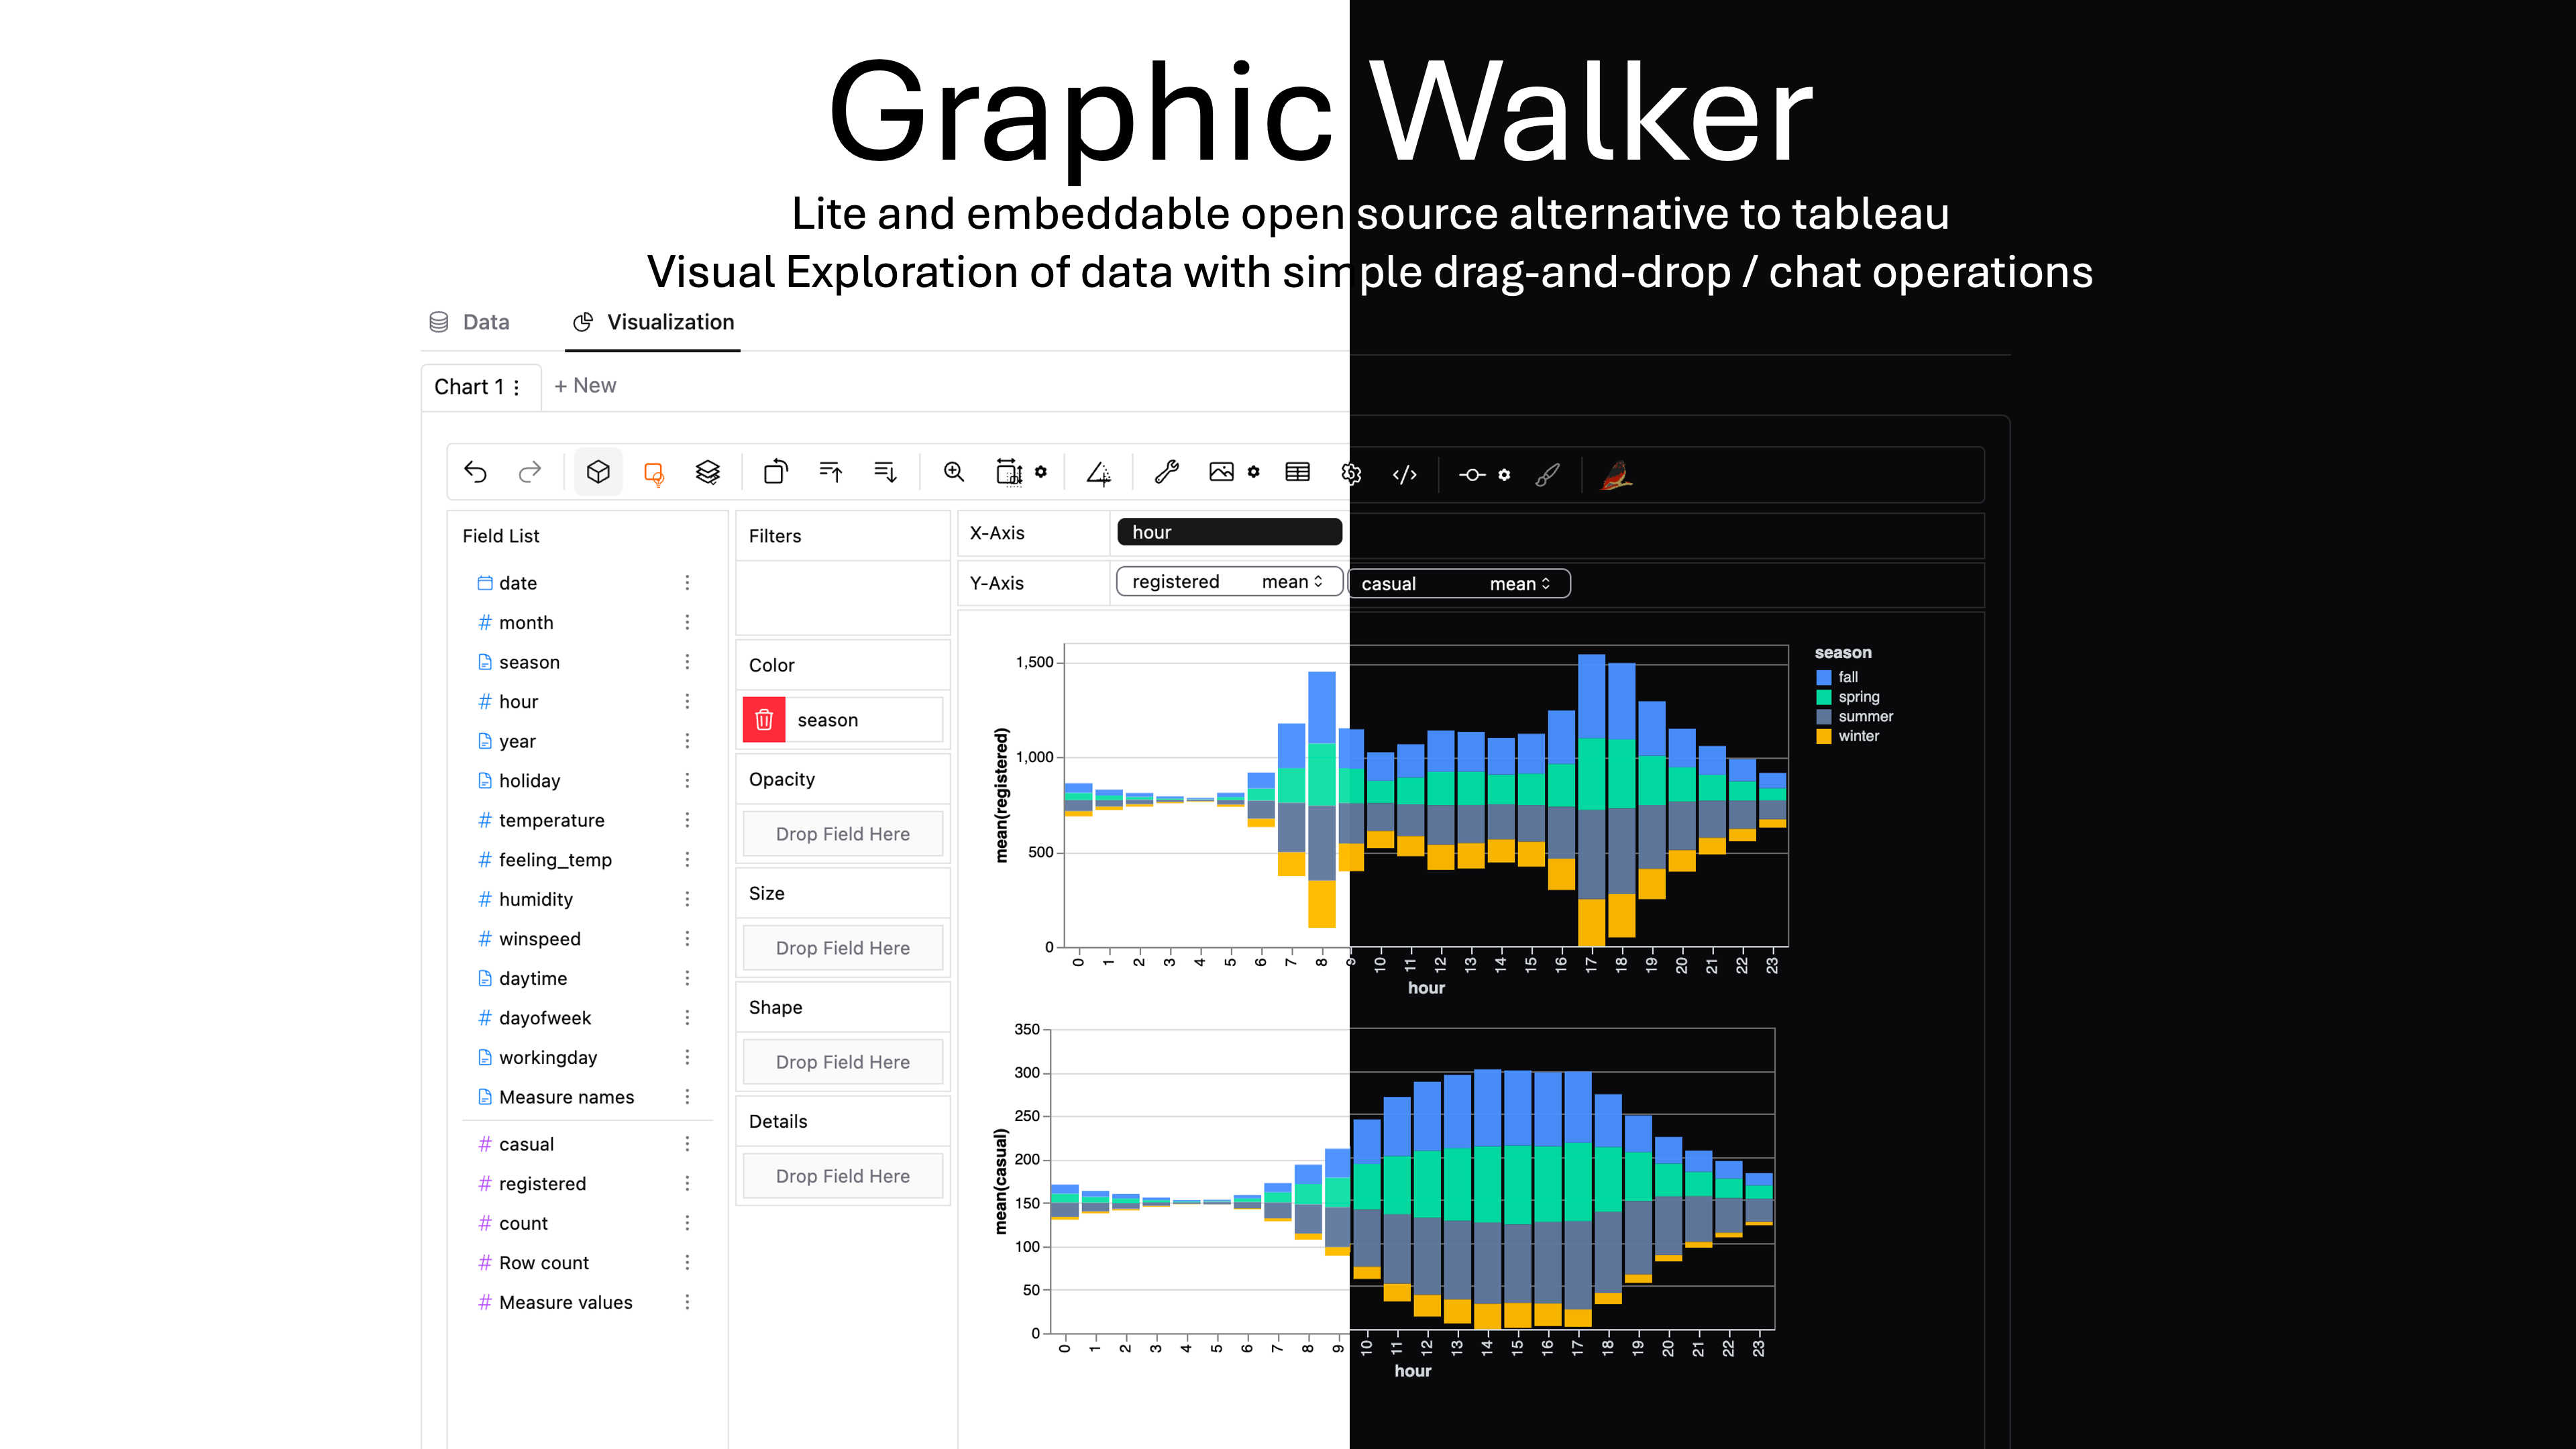
Graphic Walker is a different open-source alternative to Tableau. It allows data scientists to analyze data and visualize patterns with simple drag-and-drop / natural language query operations.

Why is it different?

It is extremely easy to embed in your apps just as a React component 🎉! The original purpose of graphic-walker is not to be a heavy BI platform, but a easy to embed, lite, plugin.

Main features

  • A user friendly drag and drop based interaction for exploratory data analysis with visualizations.
  • A Data Explainer which explains why some patterns occur / what may cause them (like salesforce einstein).
  • Using web workers to handle computational tasks which allow you to use it as a pure front-end app.
  • A general query interface for submit data queries to your own computation service. You can have a look at how we using DuckDB to handle data queries in PyGWalker
  • Light Theme / Dark Theme! 🤩
  • Spatial visualization. (supports GeoJSON, TopoJSON)
  • Natural language / Chat interface. Ask question about your data!
  • A grammar of graphics based visual analytic user interface where users can build visualizations from low-level visual channel encodings. (based on vega-lite)
ask-gw-dark.mp4

Usage for End Users

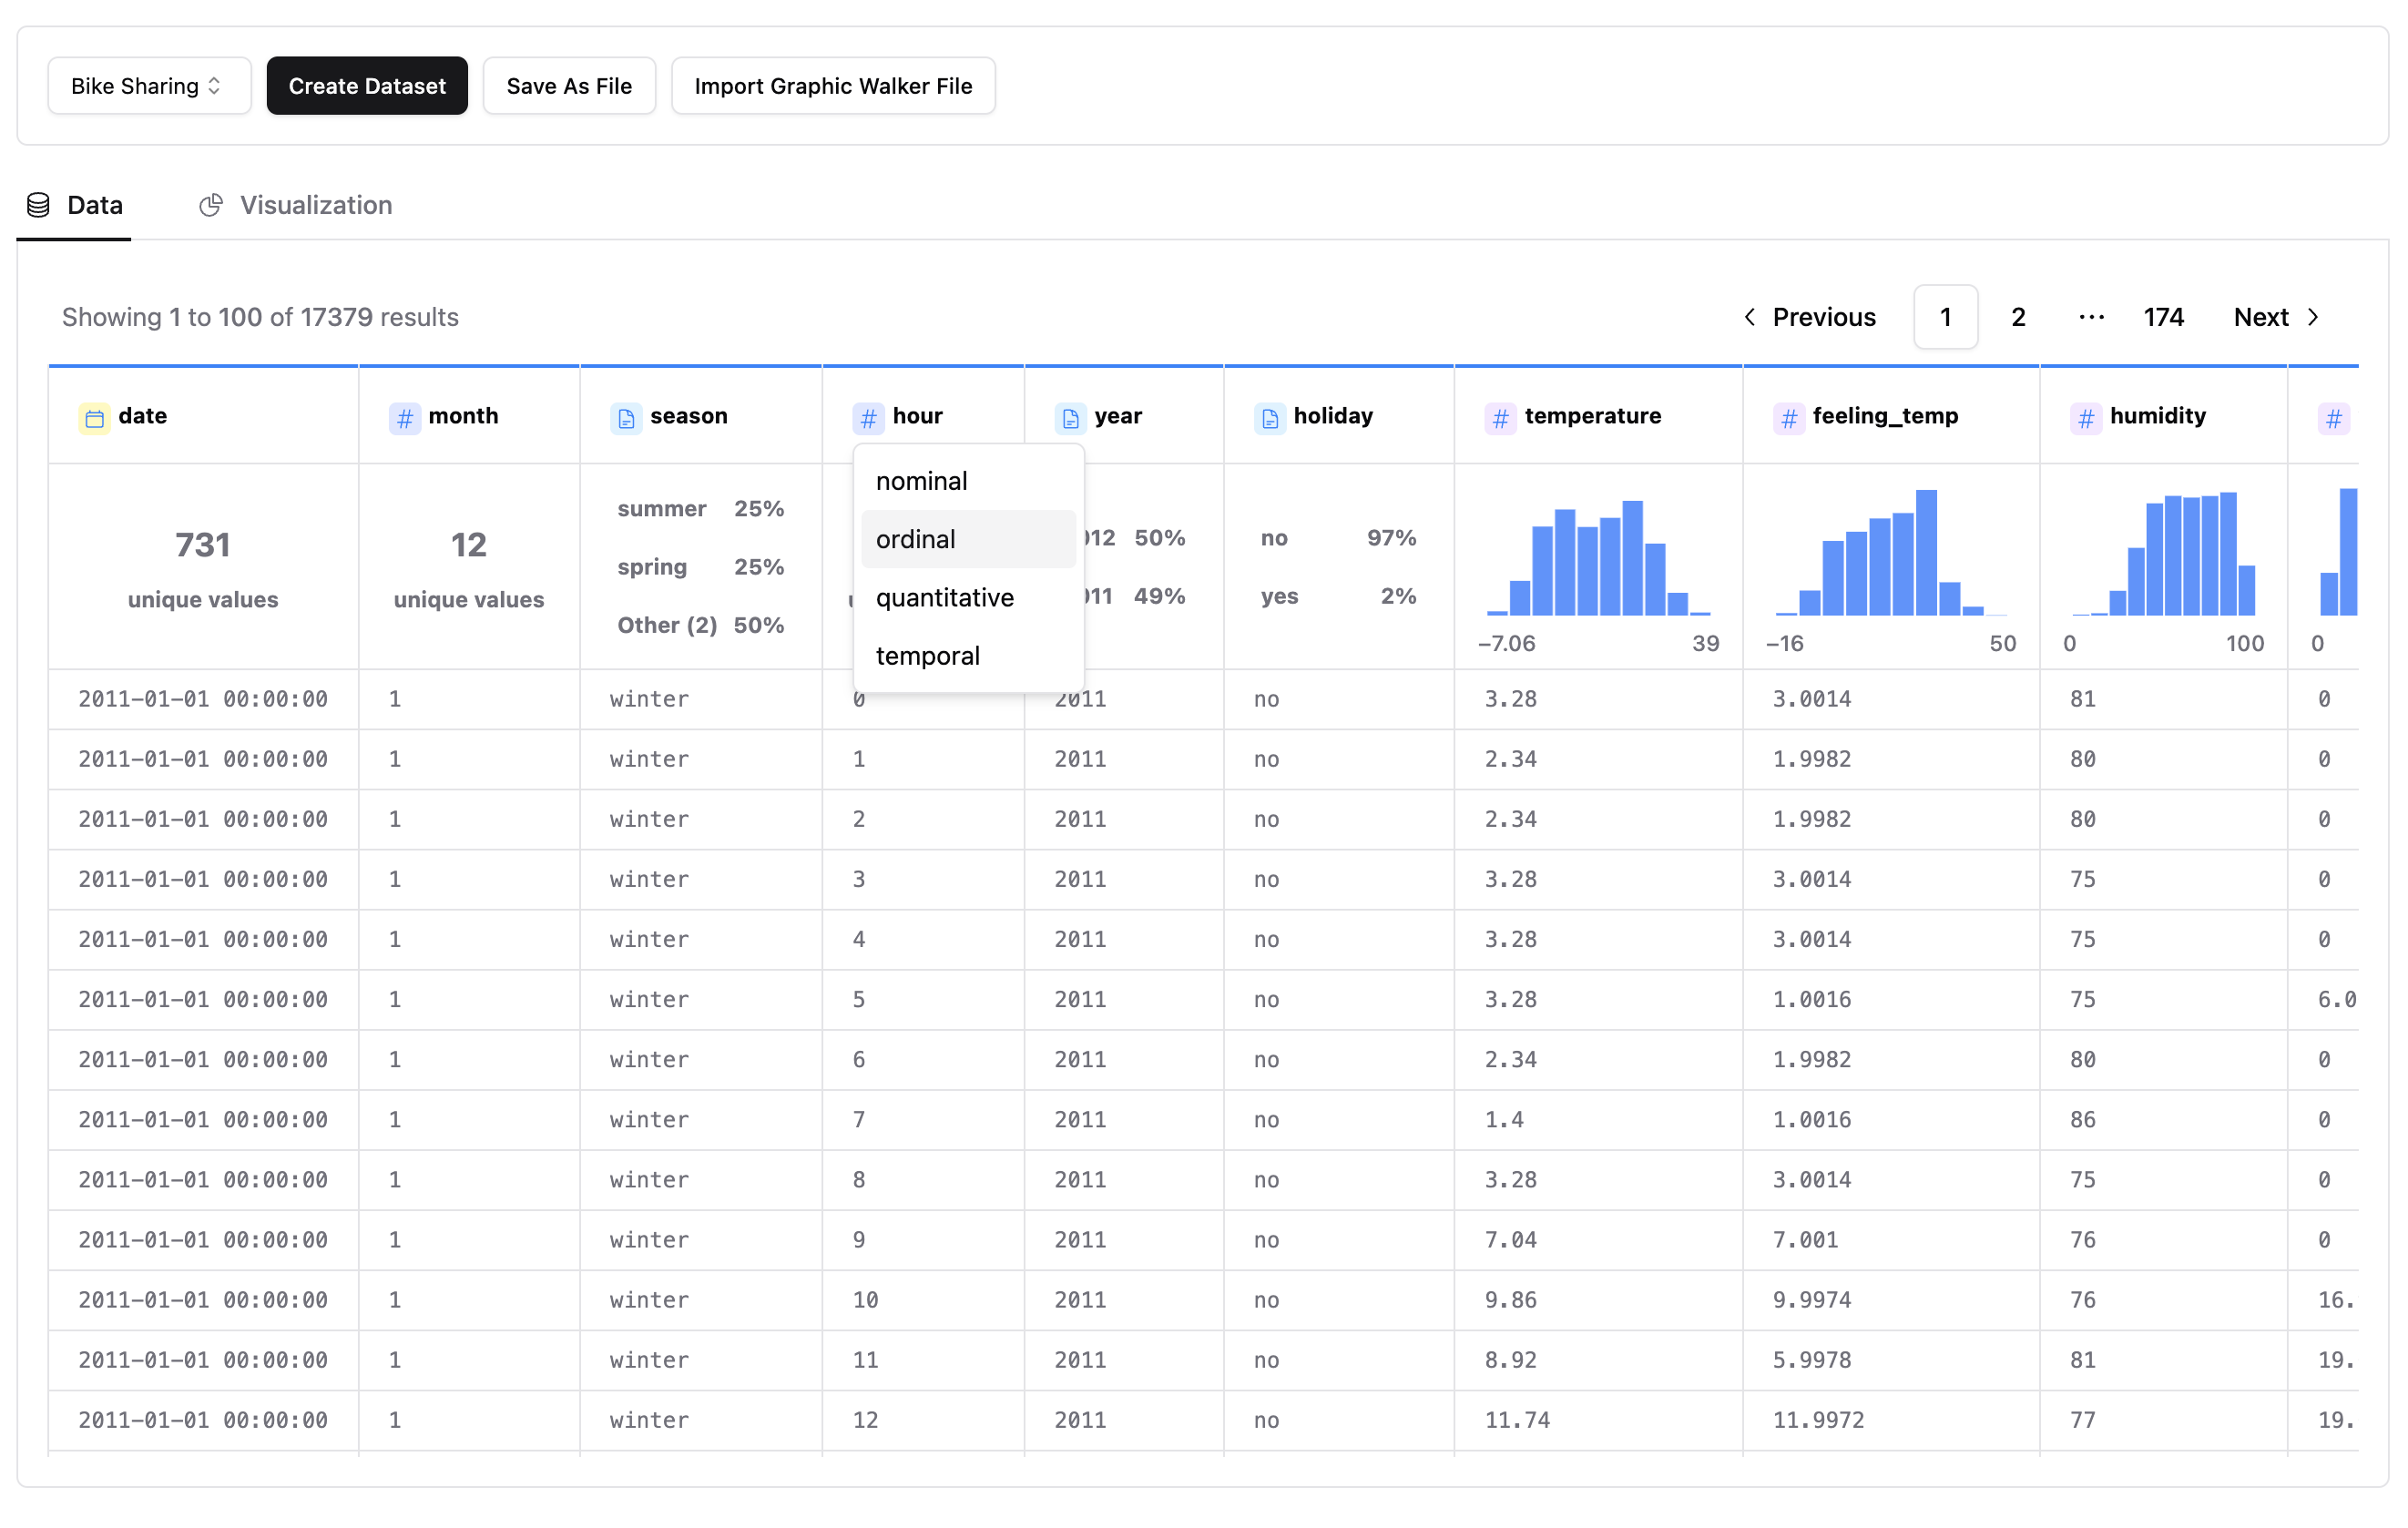
First, upload your Data(csv/json) file, preview your data, and define the analytic type of columns (dimension or measure).

We are developing more types of data sources. You are welcome to raise an issue telling us the types of sources you are using. If you are a developer, graphic-walker can be used as an embedding component, and you can pass your parsed data source to it. For example, Rath uses graphic-walker as an embedded component, and it supports many common data sources. You can load your data in Rath and bring the data into graphic-walker. In this way, users can also benefit from data cleaning and transformation features in Rath.

graphic walker dataset upload

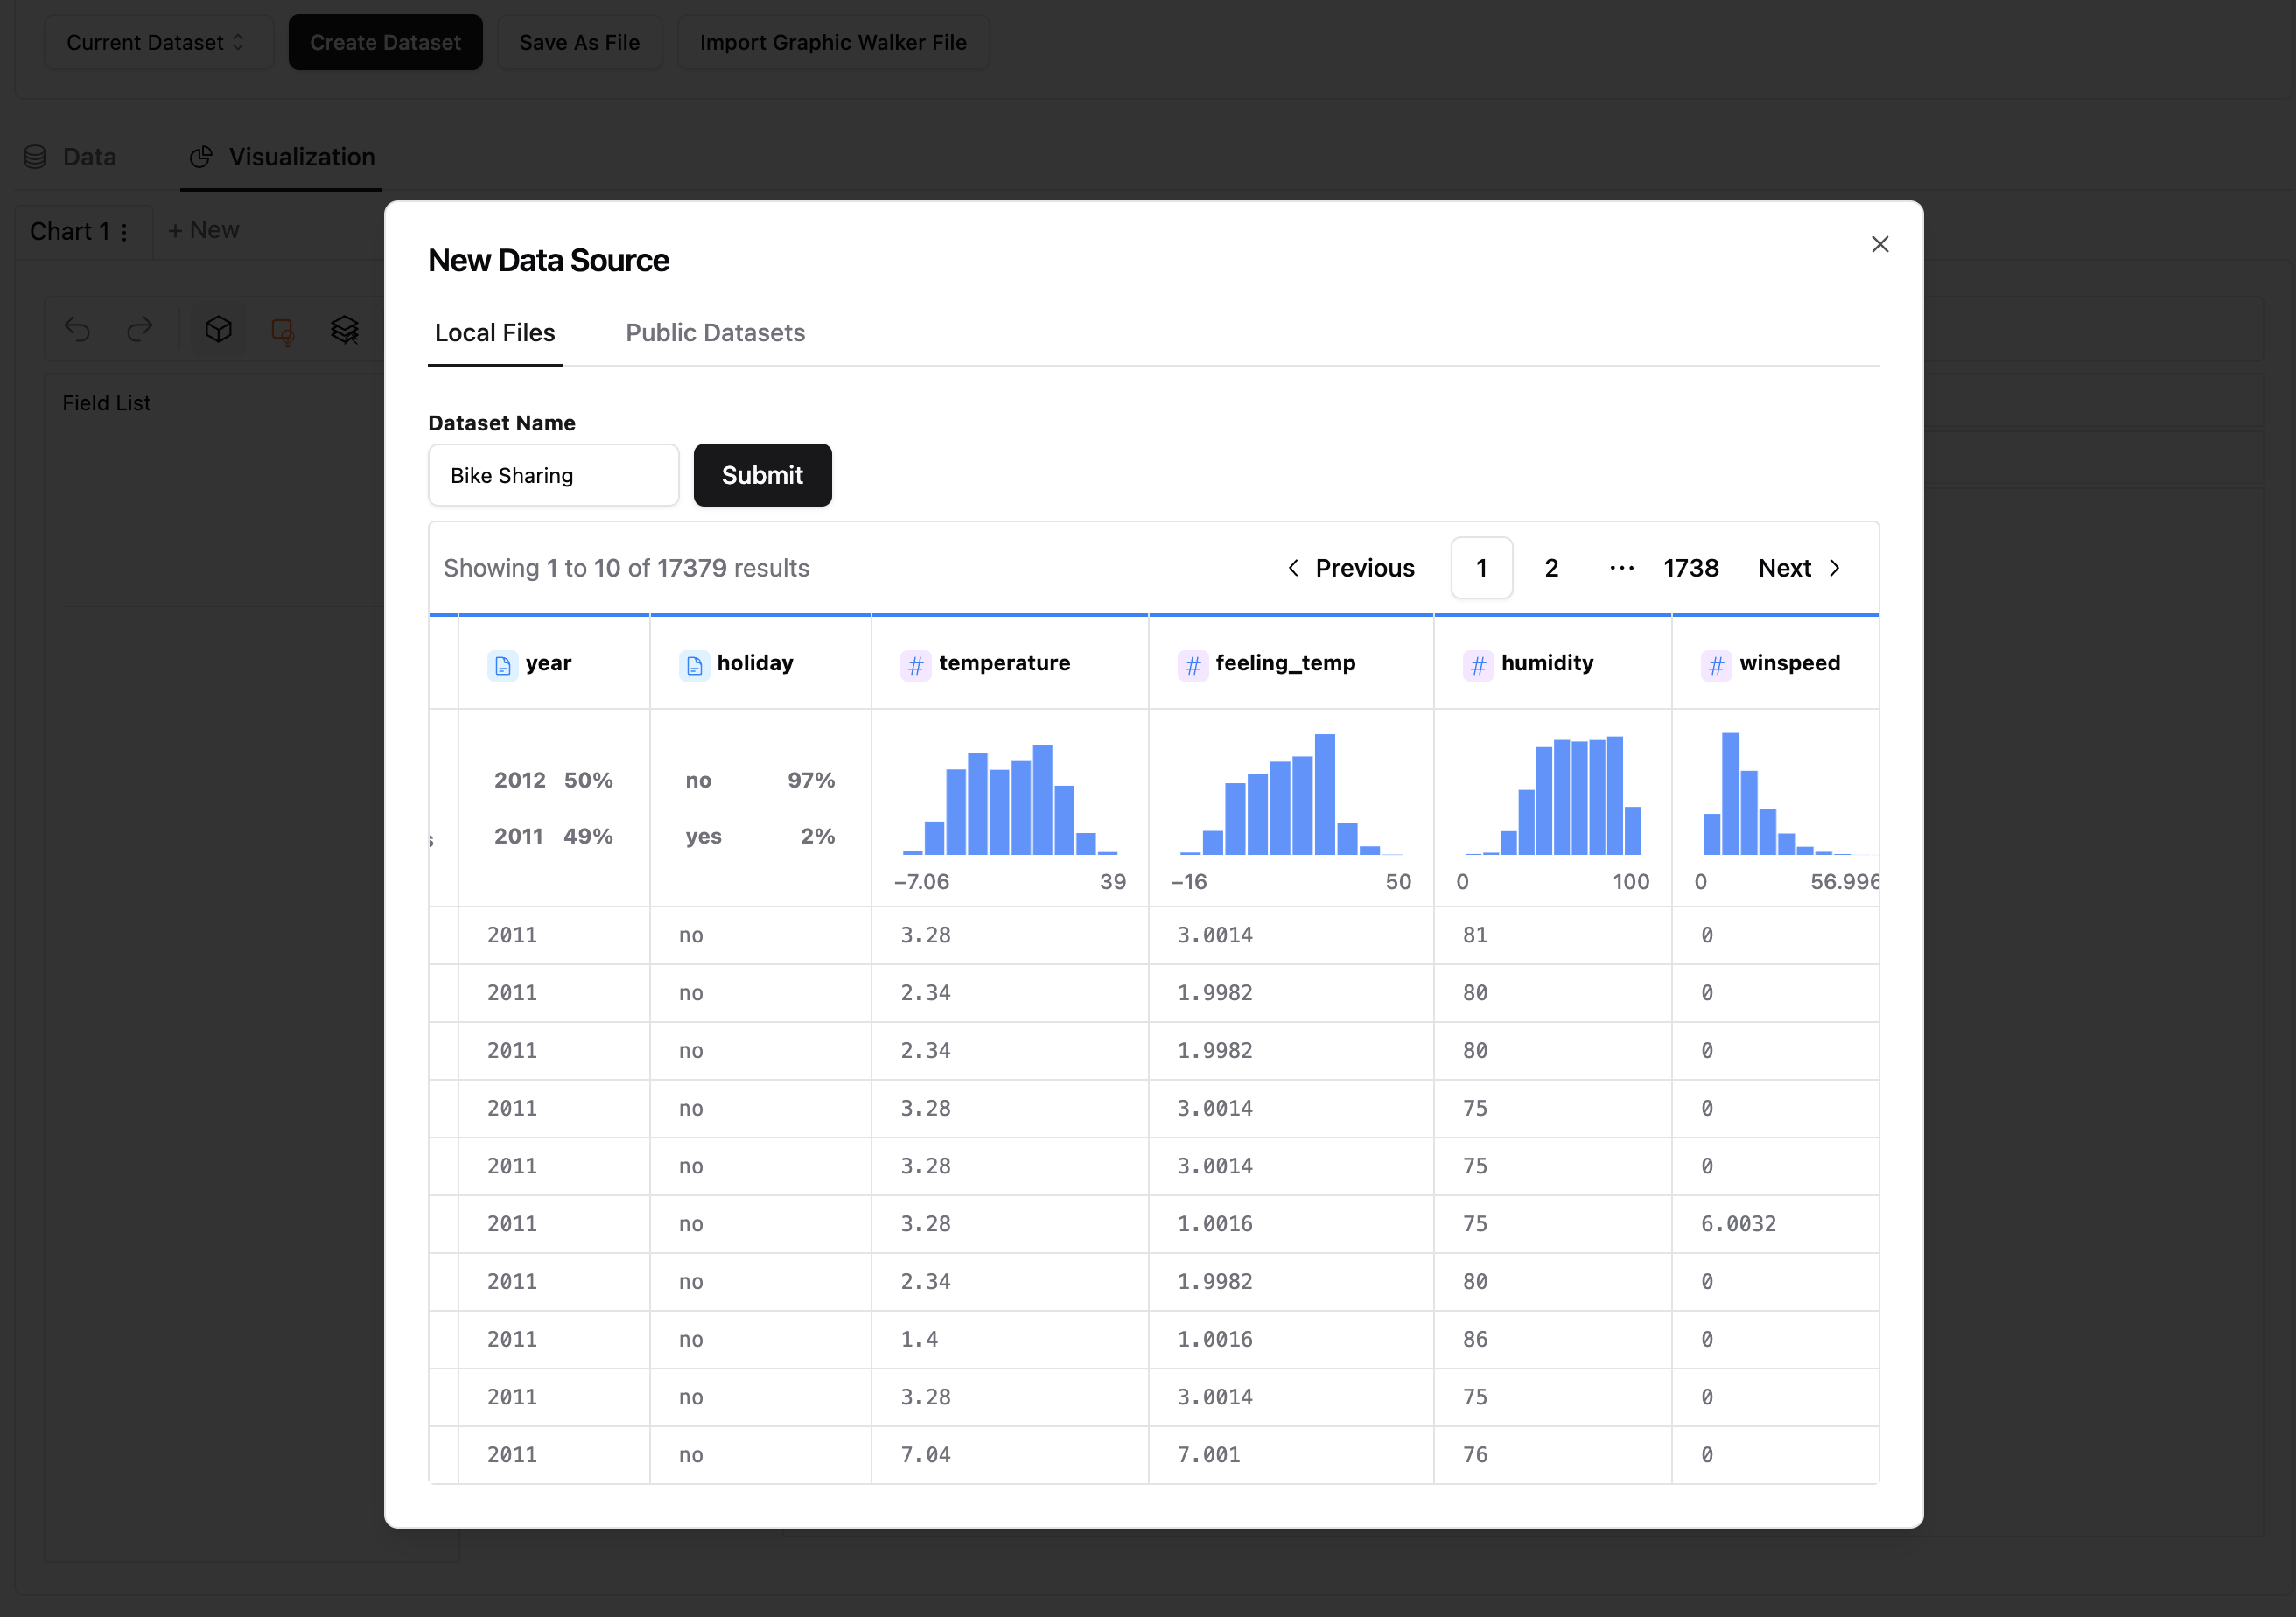
When the data is ready, click the 'Submit' button to use the data. On the left-hand side, Field List is all of your original columns in the table. You can drag them into visual channels (rows, columns, color, opacity, etc.) and make visualizations.

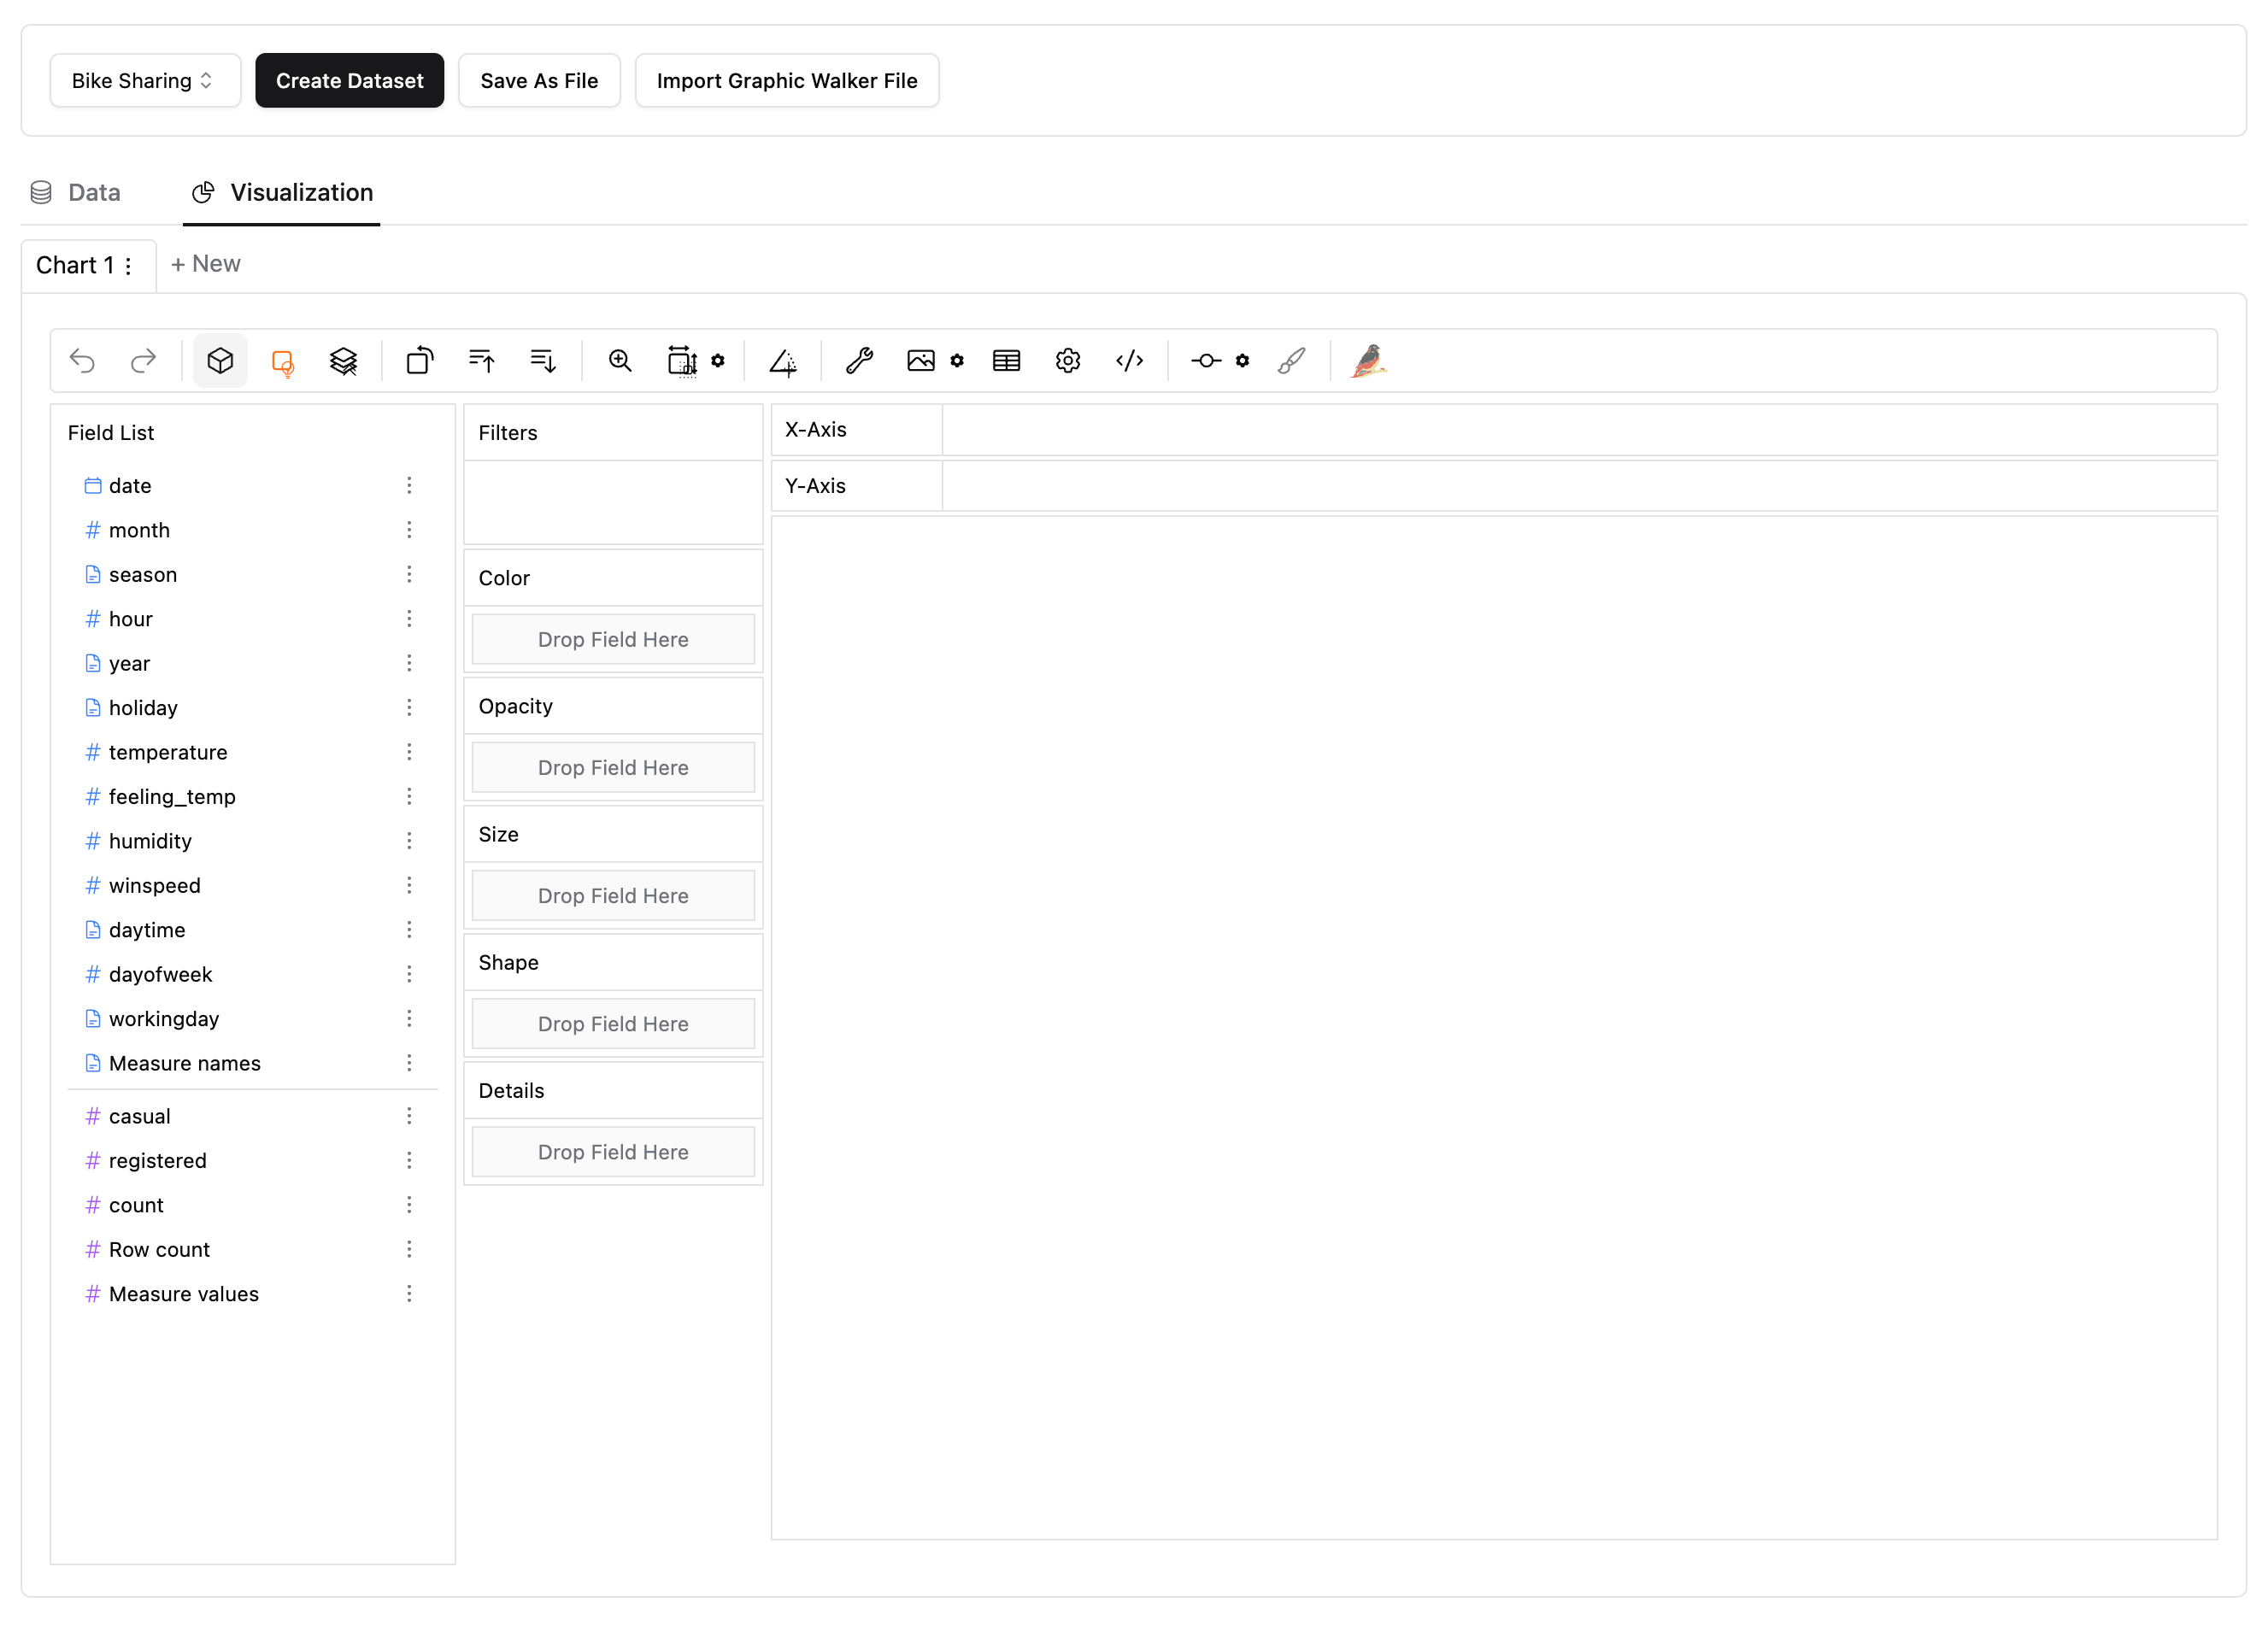
You can also view raw data any time or edit the meta data.

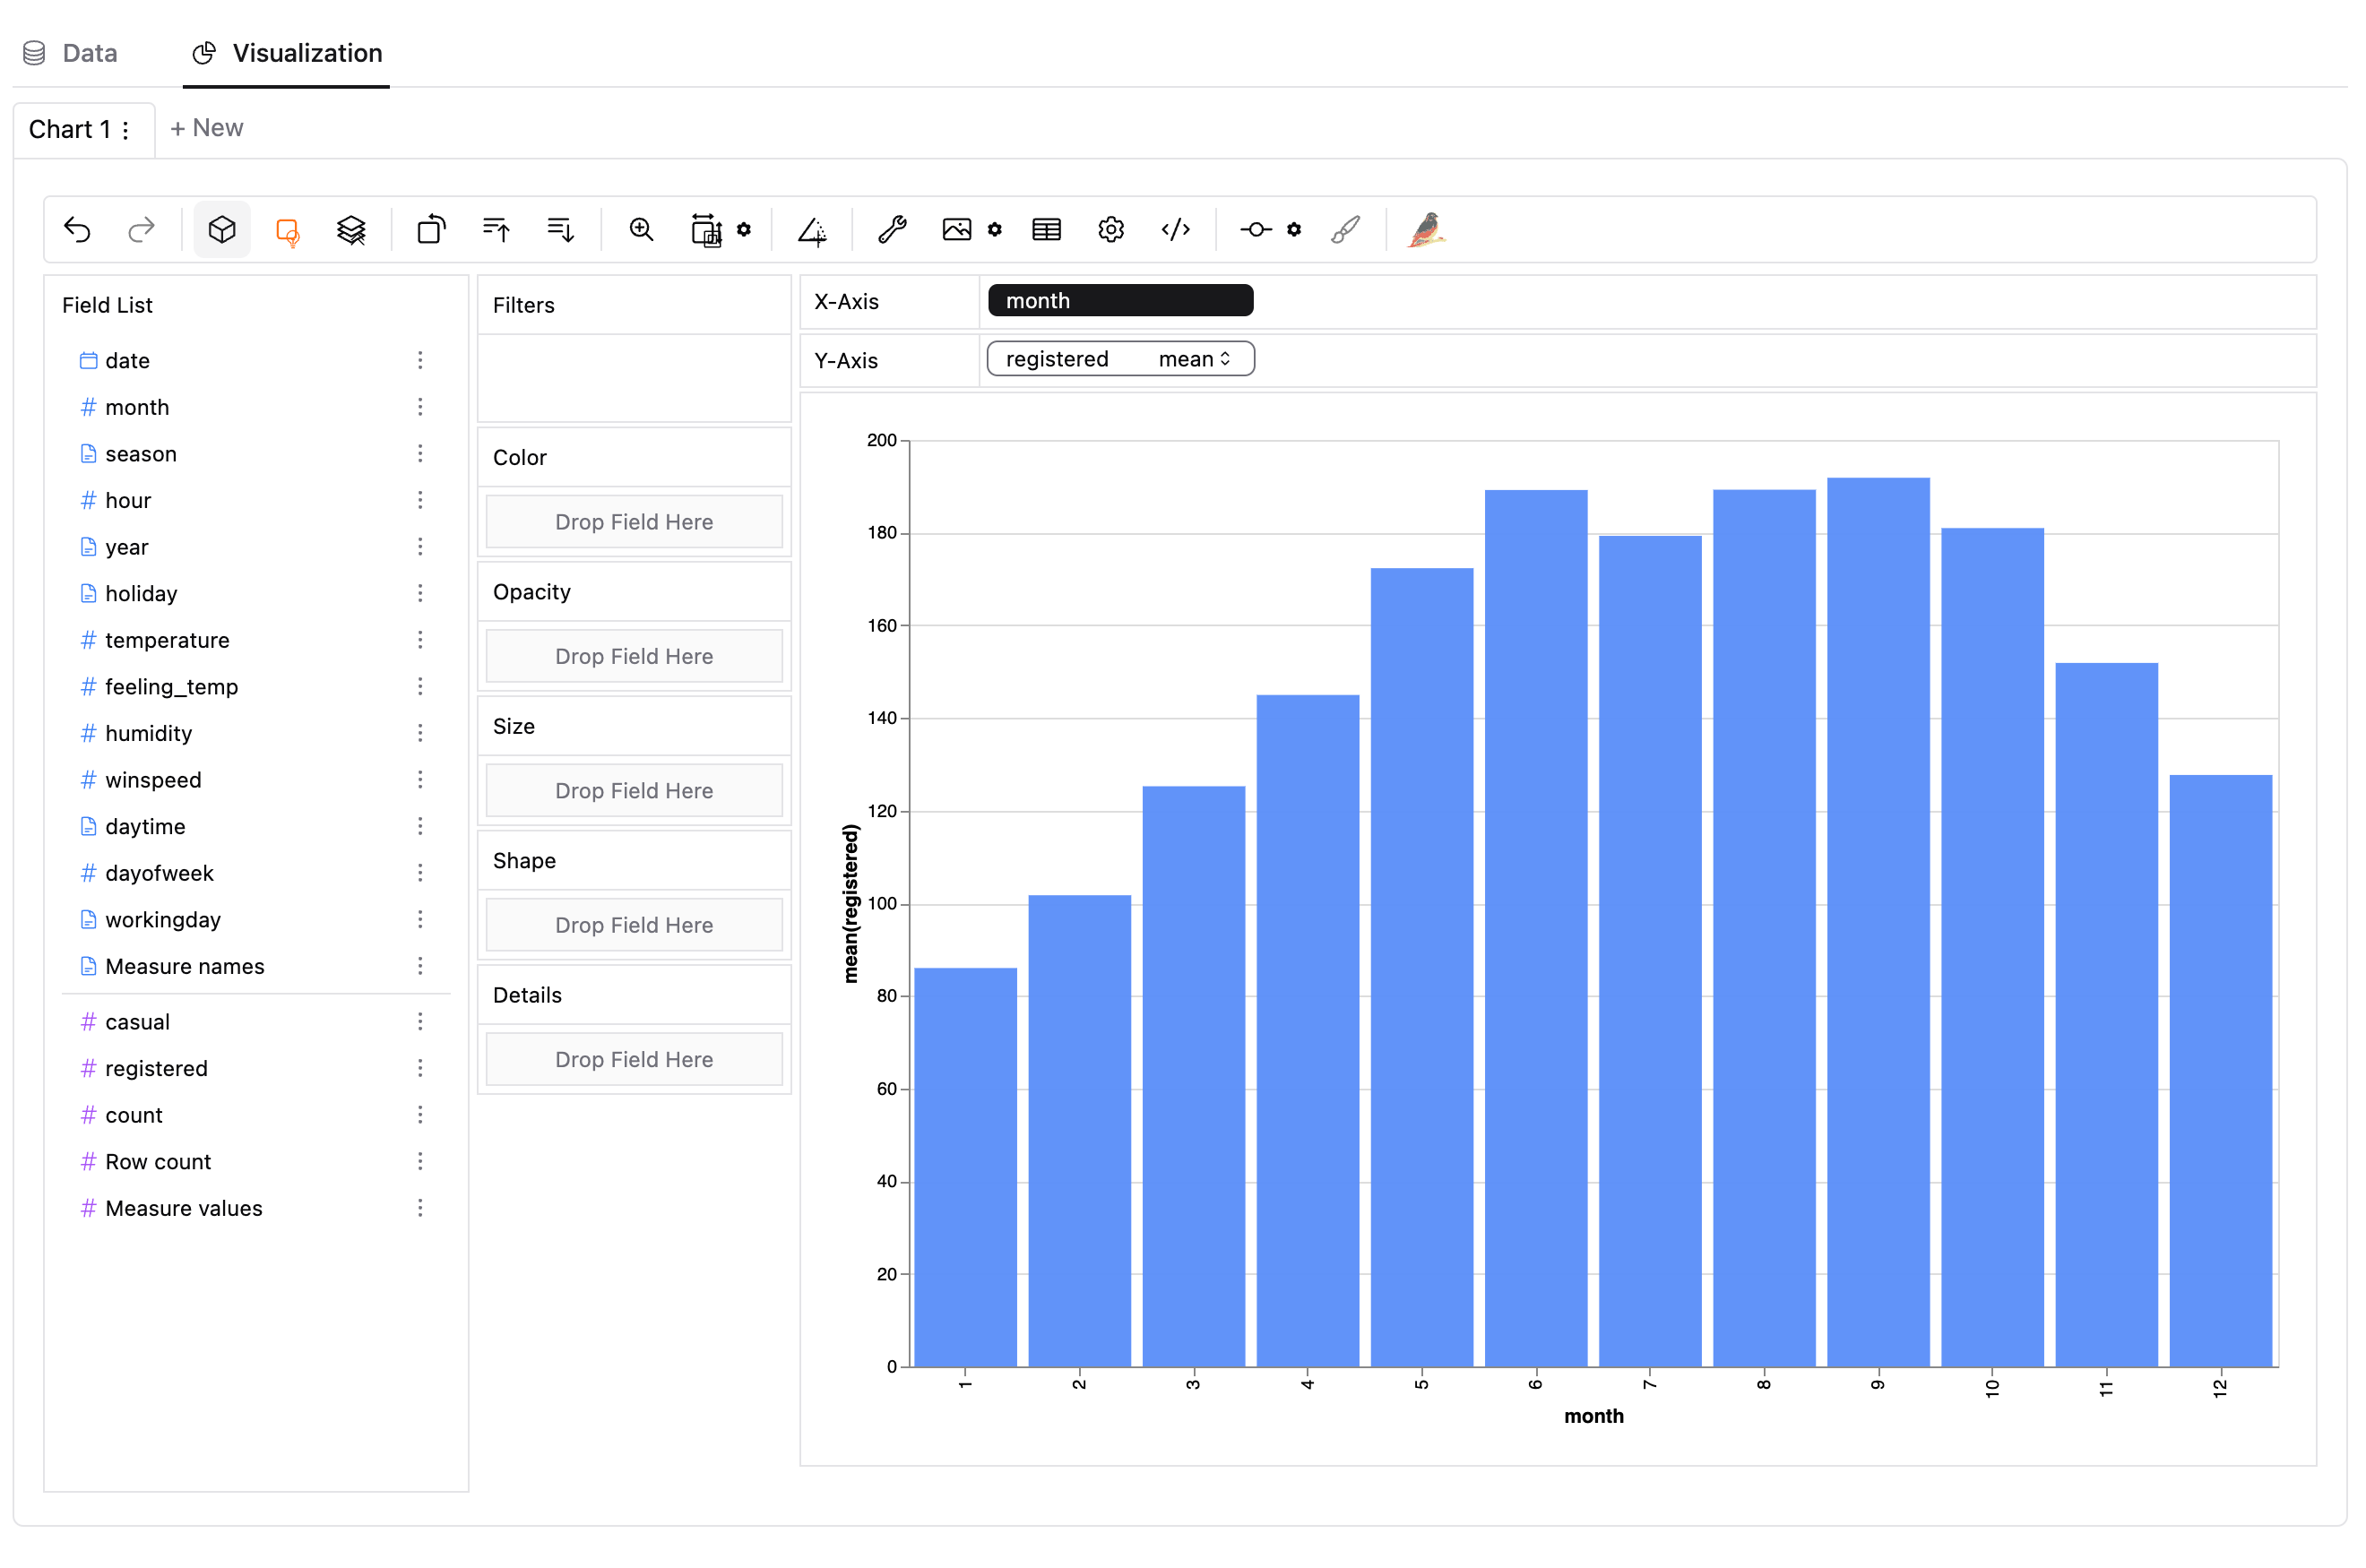
Visualize your data with drag and drop operation. For measures, you can define the aggregation methods (sum, mean, count etc.)

graphic walker bar chart

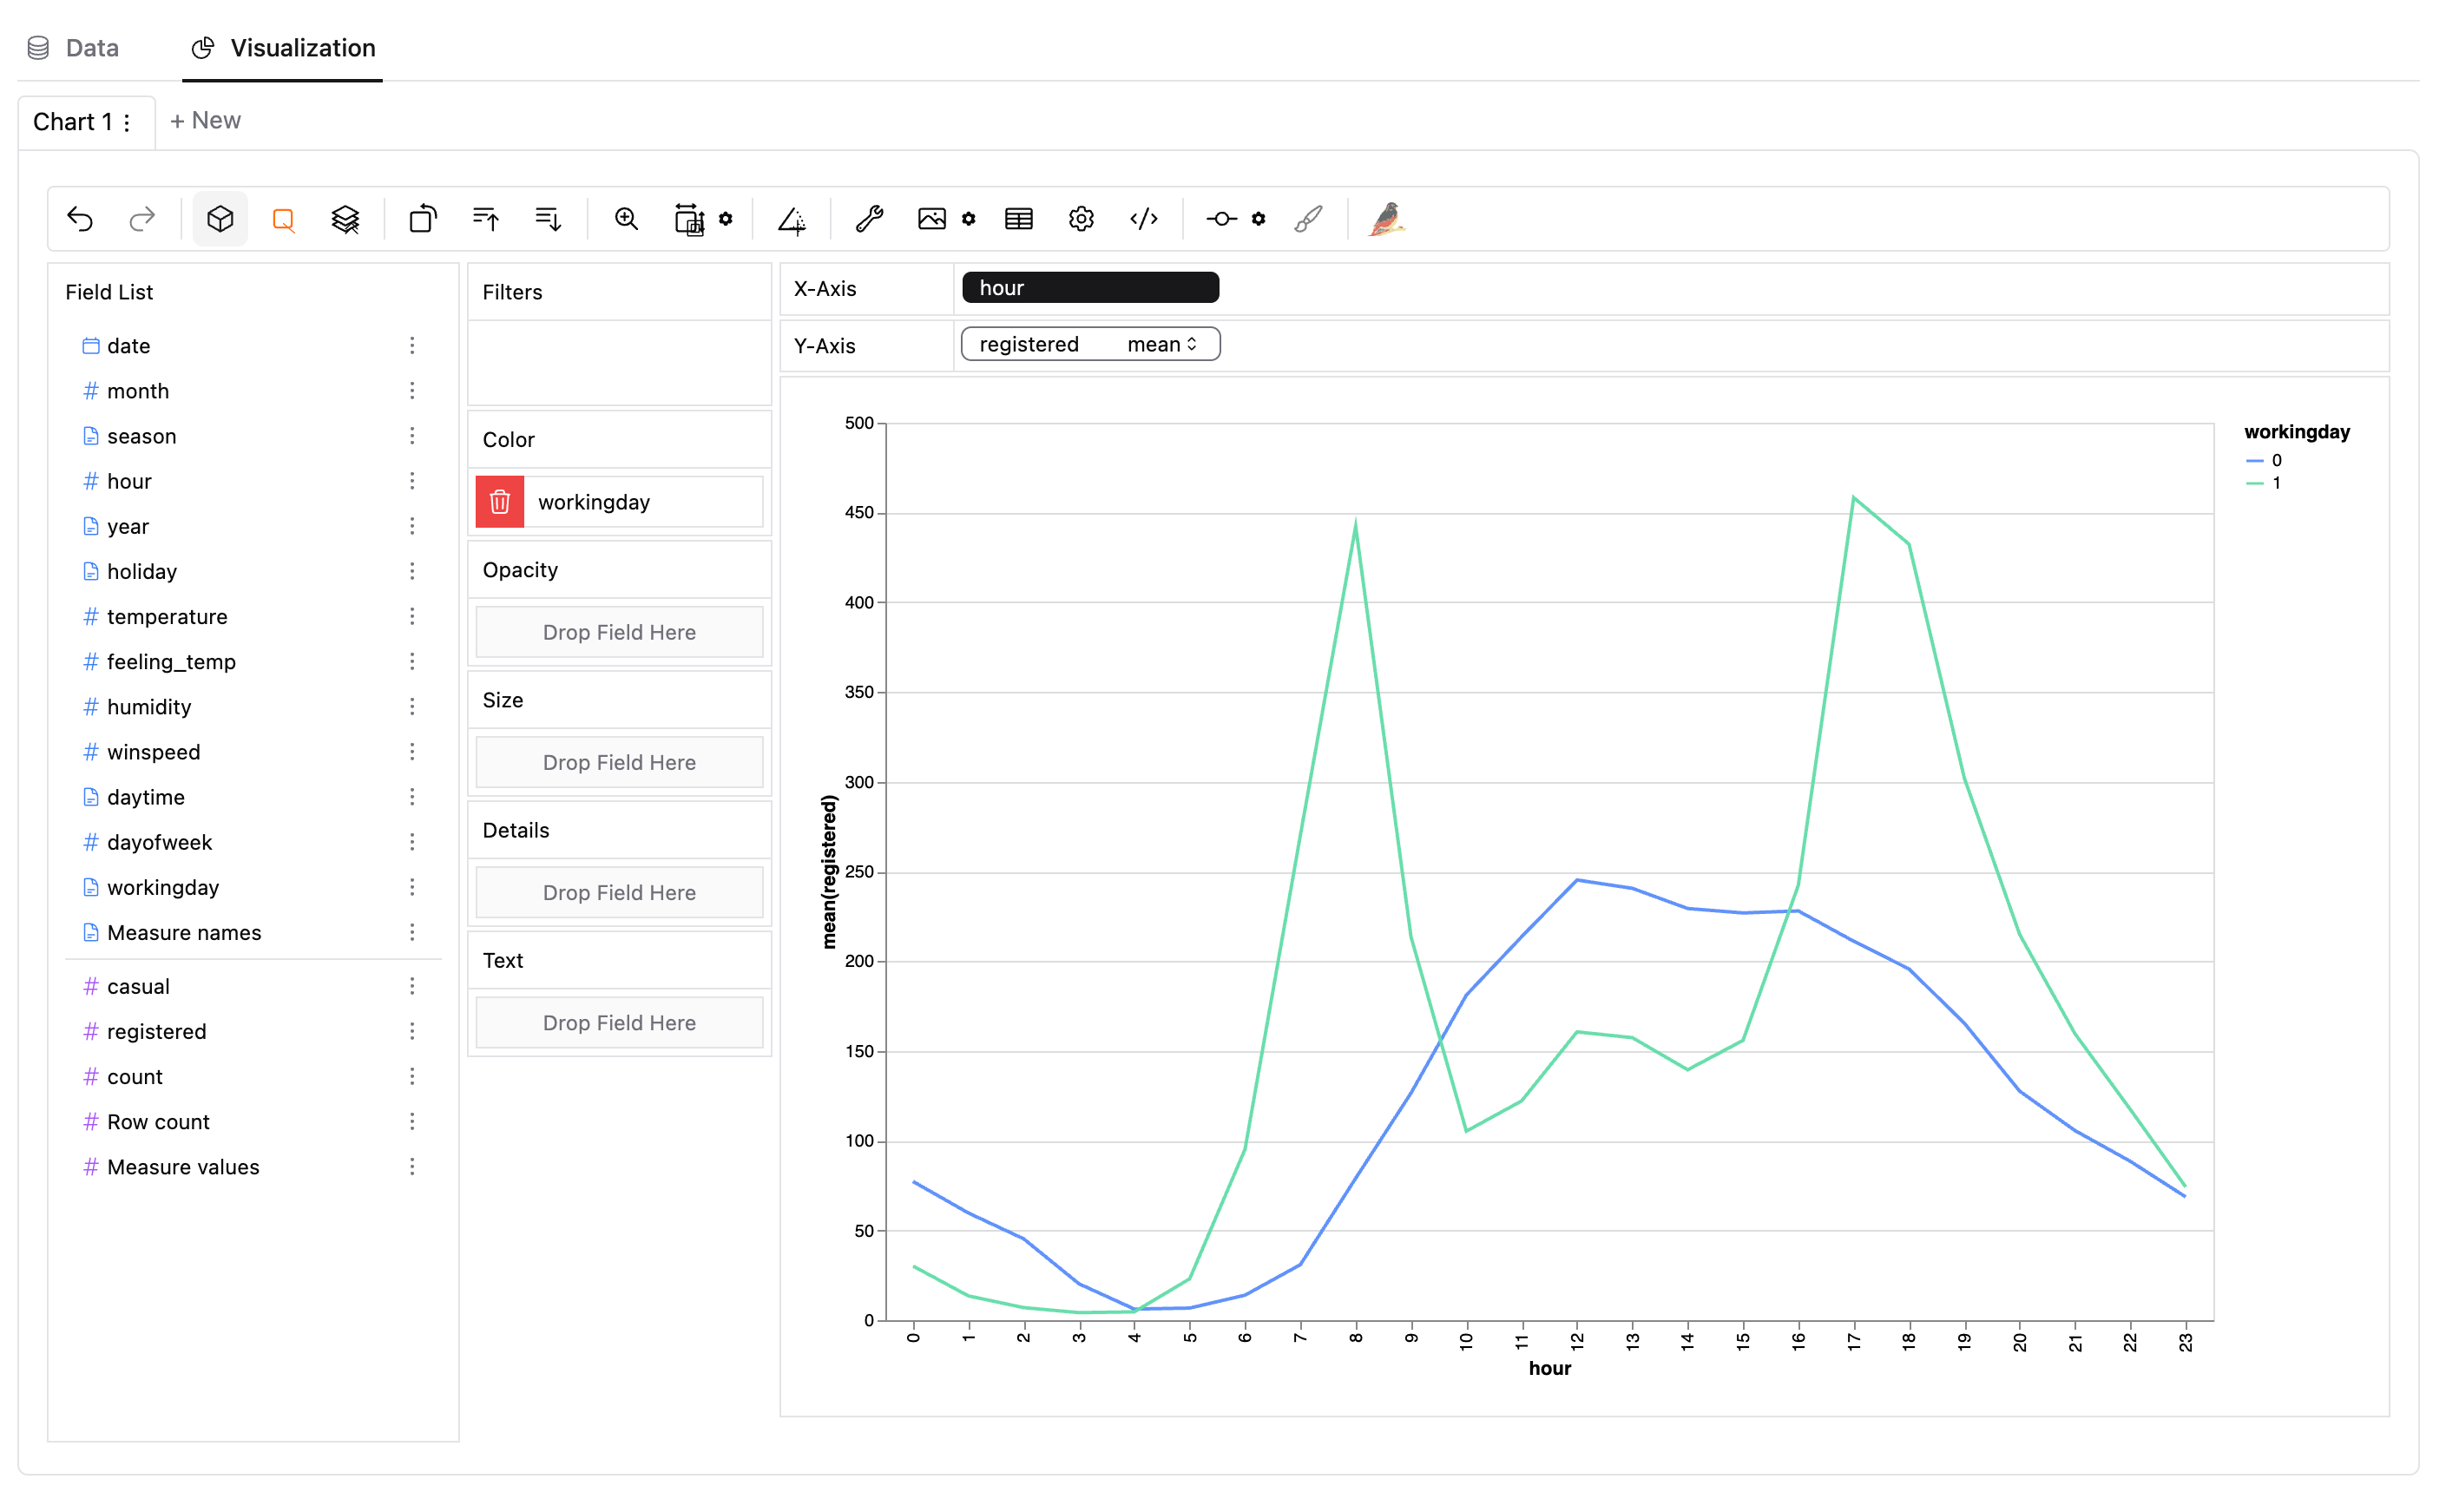
You can change the mark type into others to make different charts, for example a line chart.

graphic walker line chart

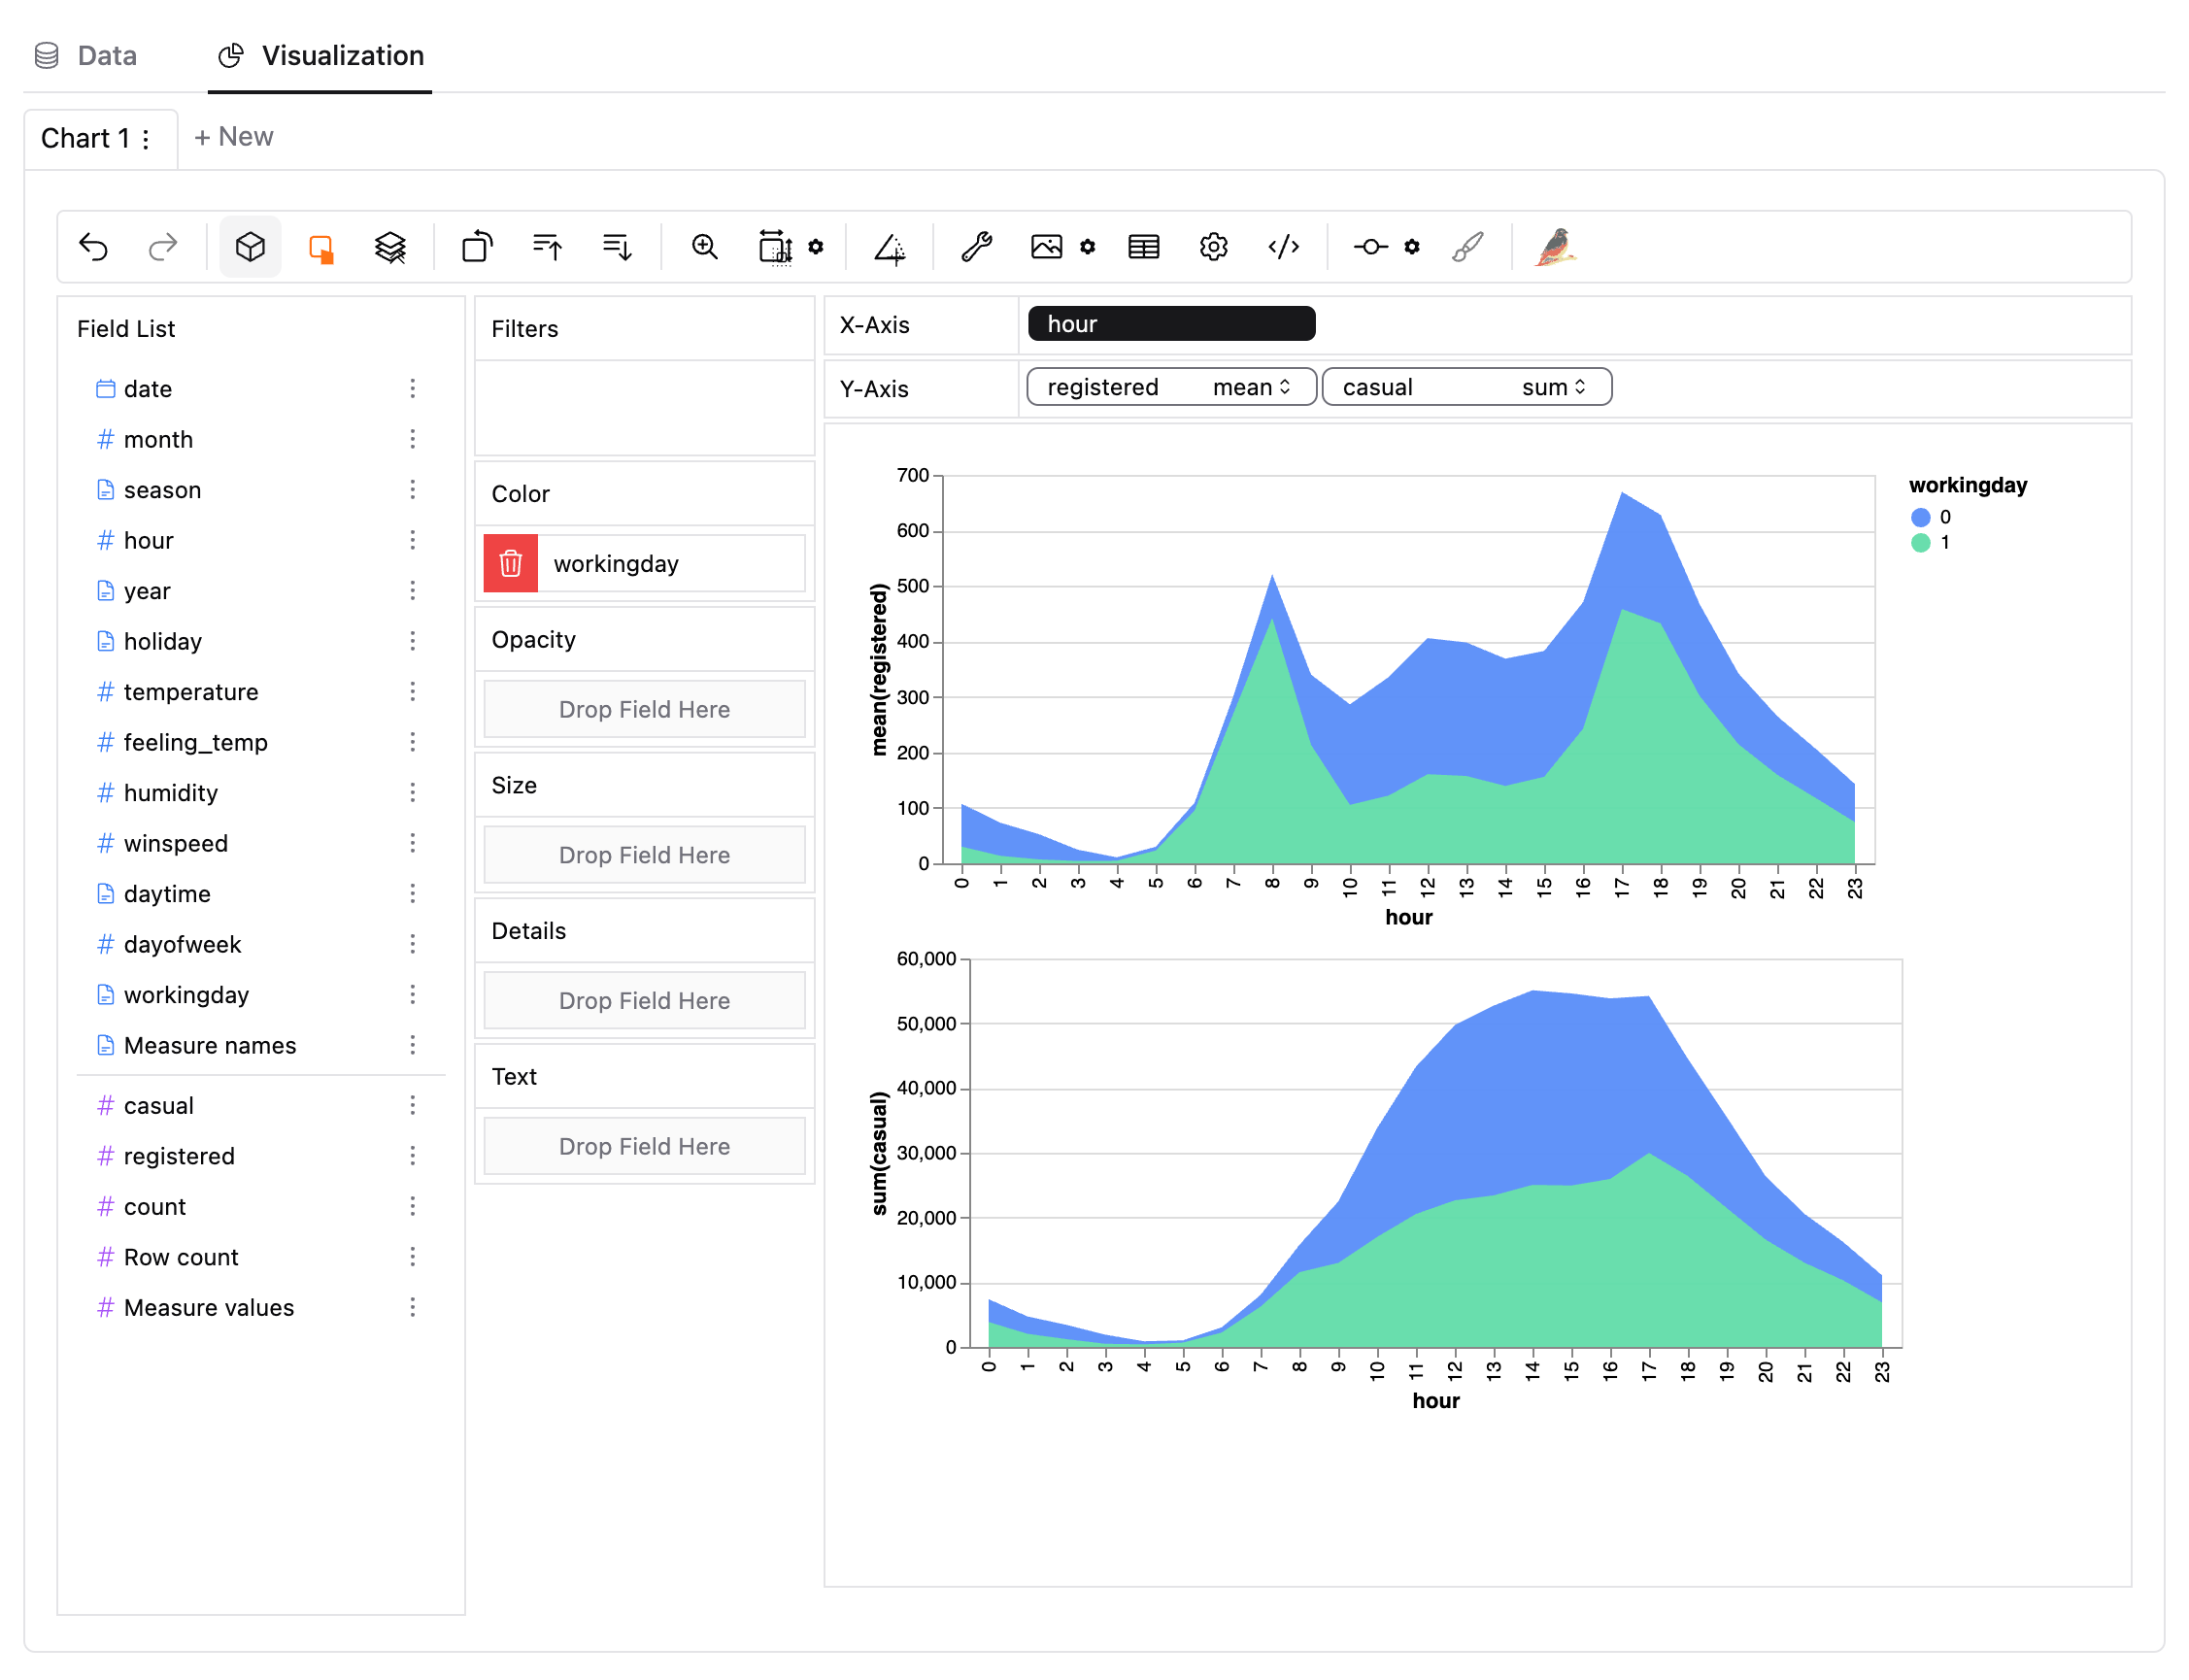
To compare different measures, you can create a concat view by adding more than one measure into rows/columns.

graphic walker area chart

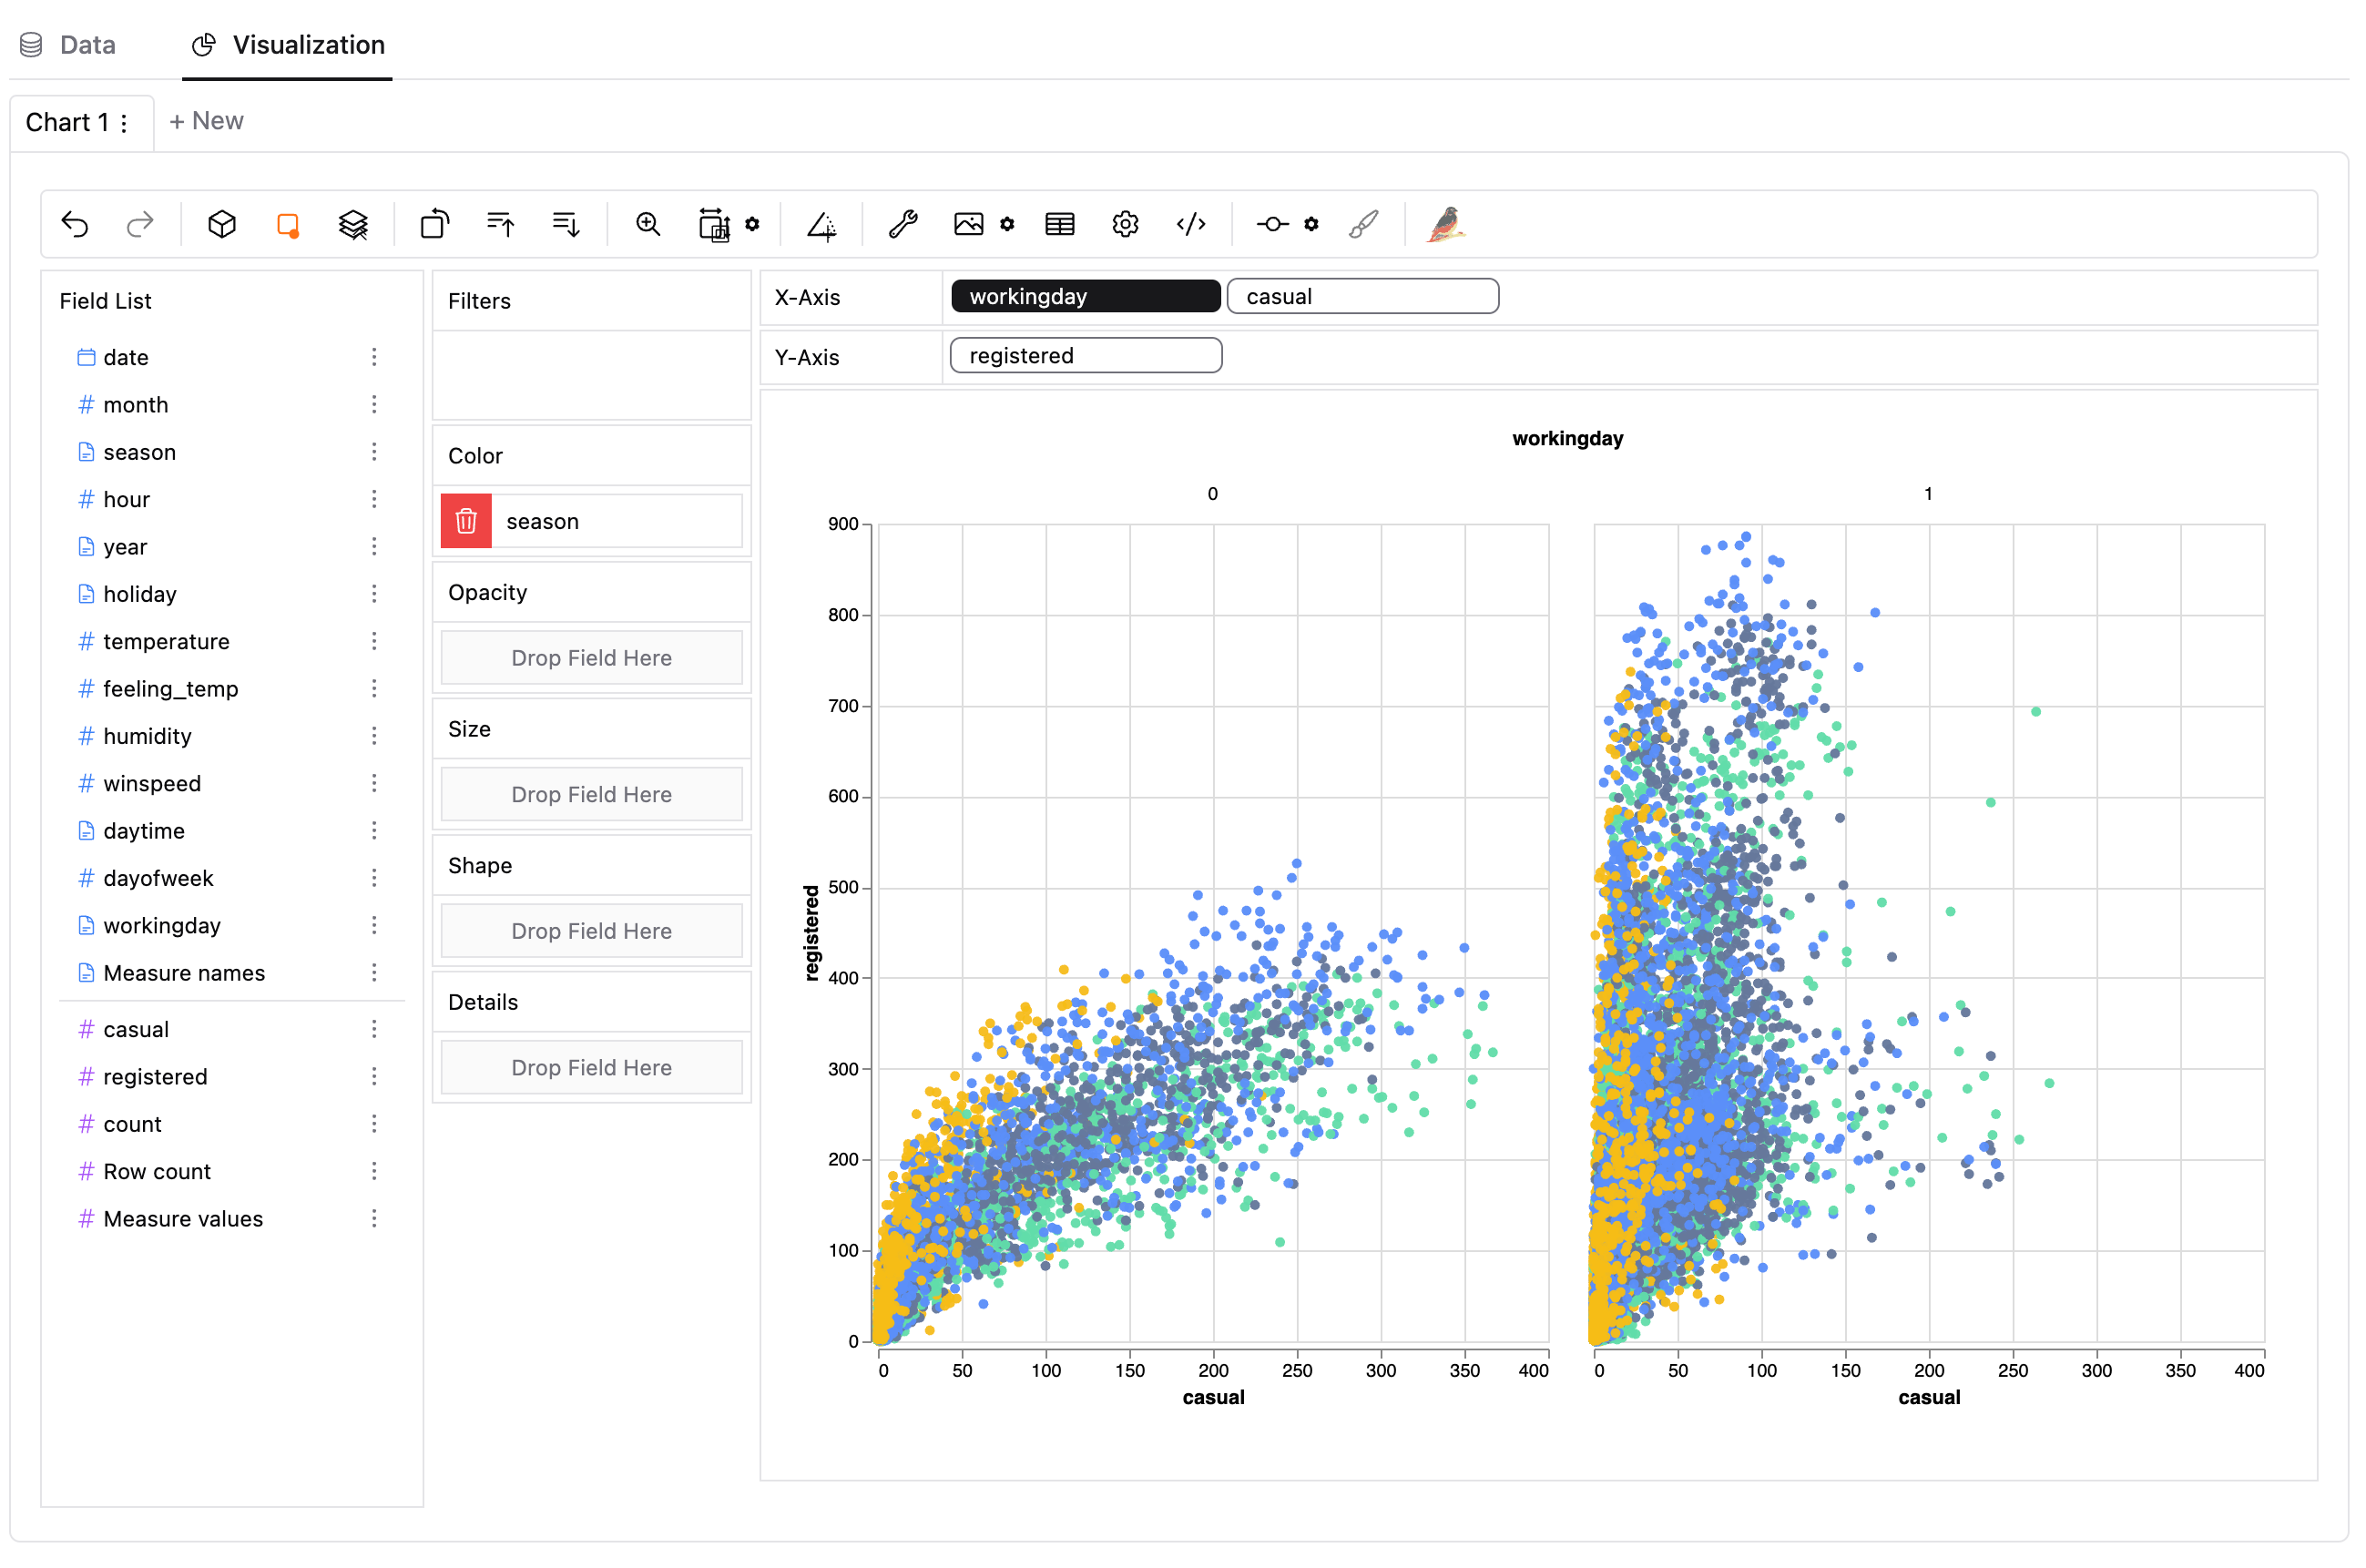
To make a facet view of several subviews divided by the value in dimension, put dimensions into rows or columns to make a facets view. The rules are similar to Tableau.

graphic walker scatter chart

When you finish exploration, you can save the result into a local file, which can be imported next time.

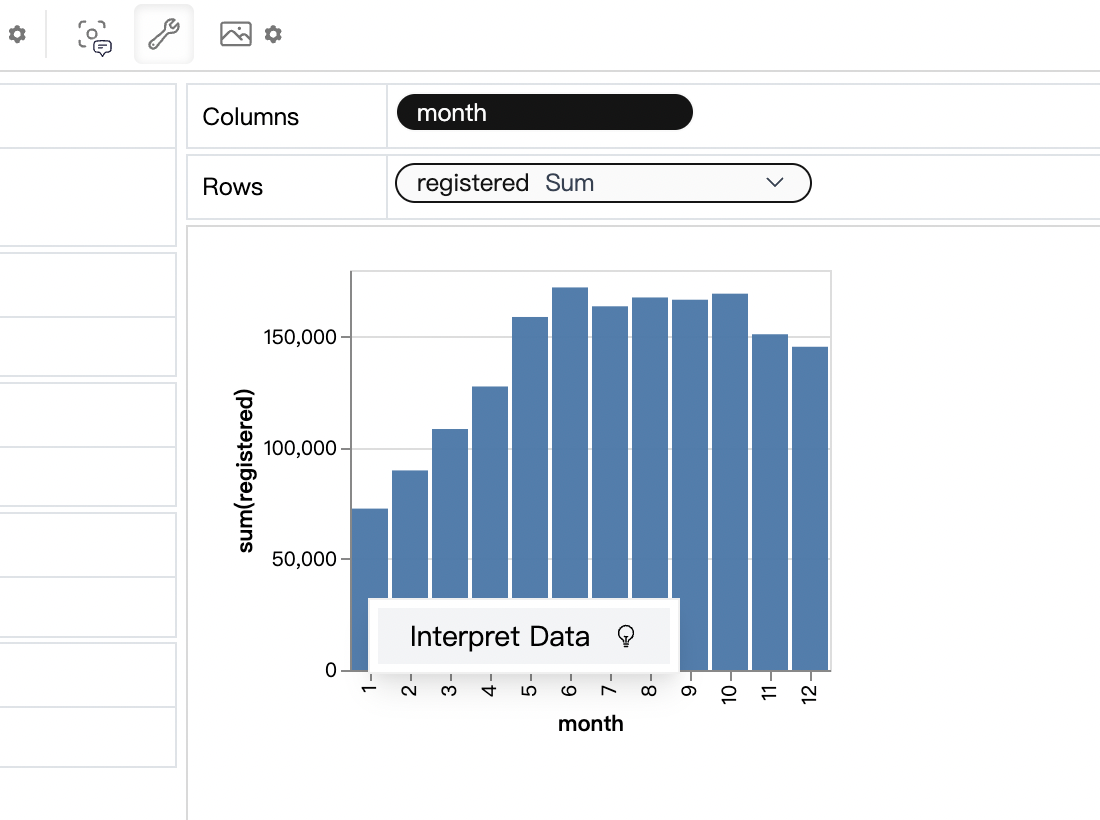
Sometimes you may have further questions, such as why sales in Dec. is high. Graphic Walker provides a data explainer for these cases.

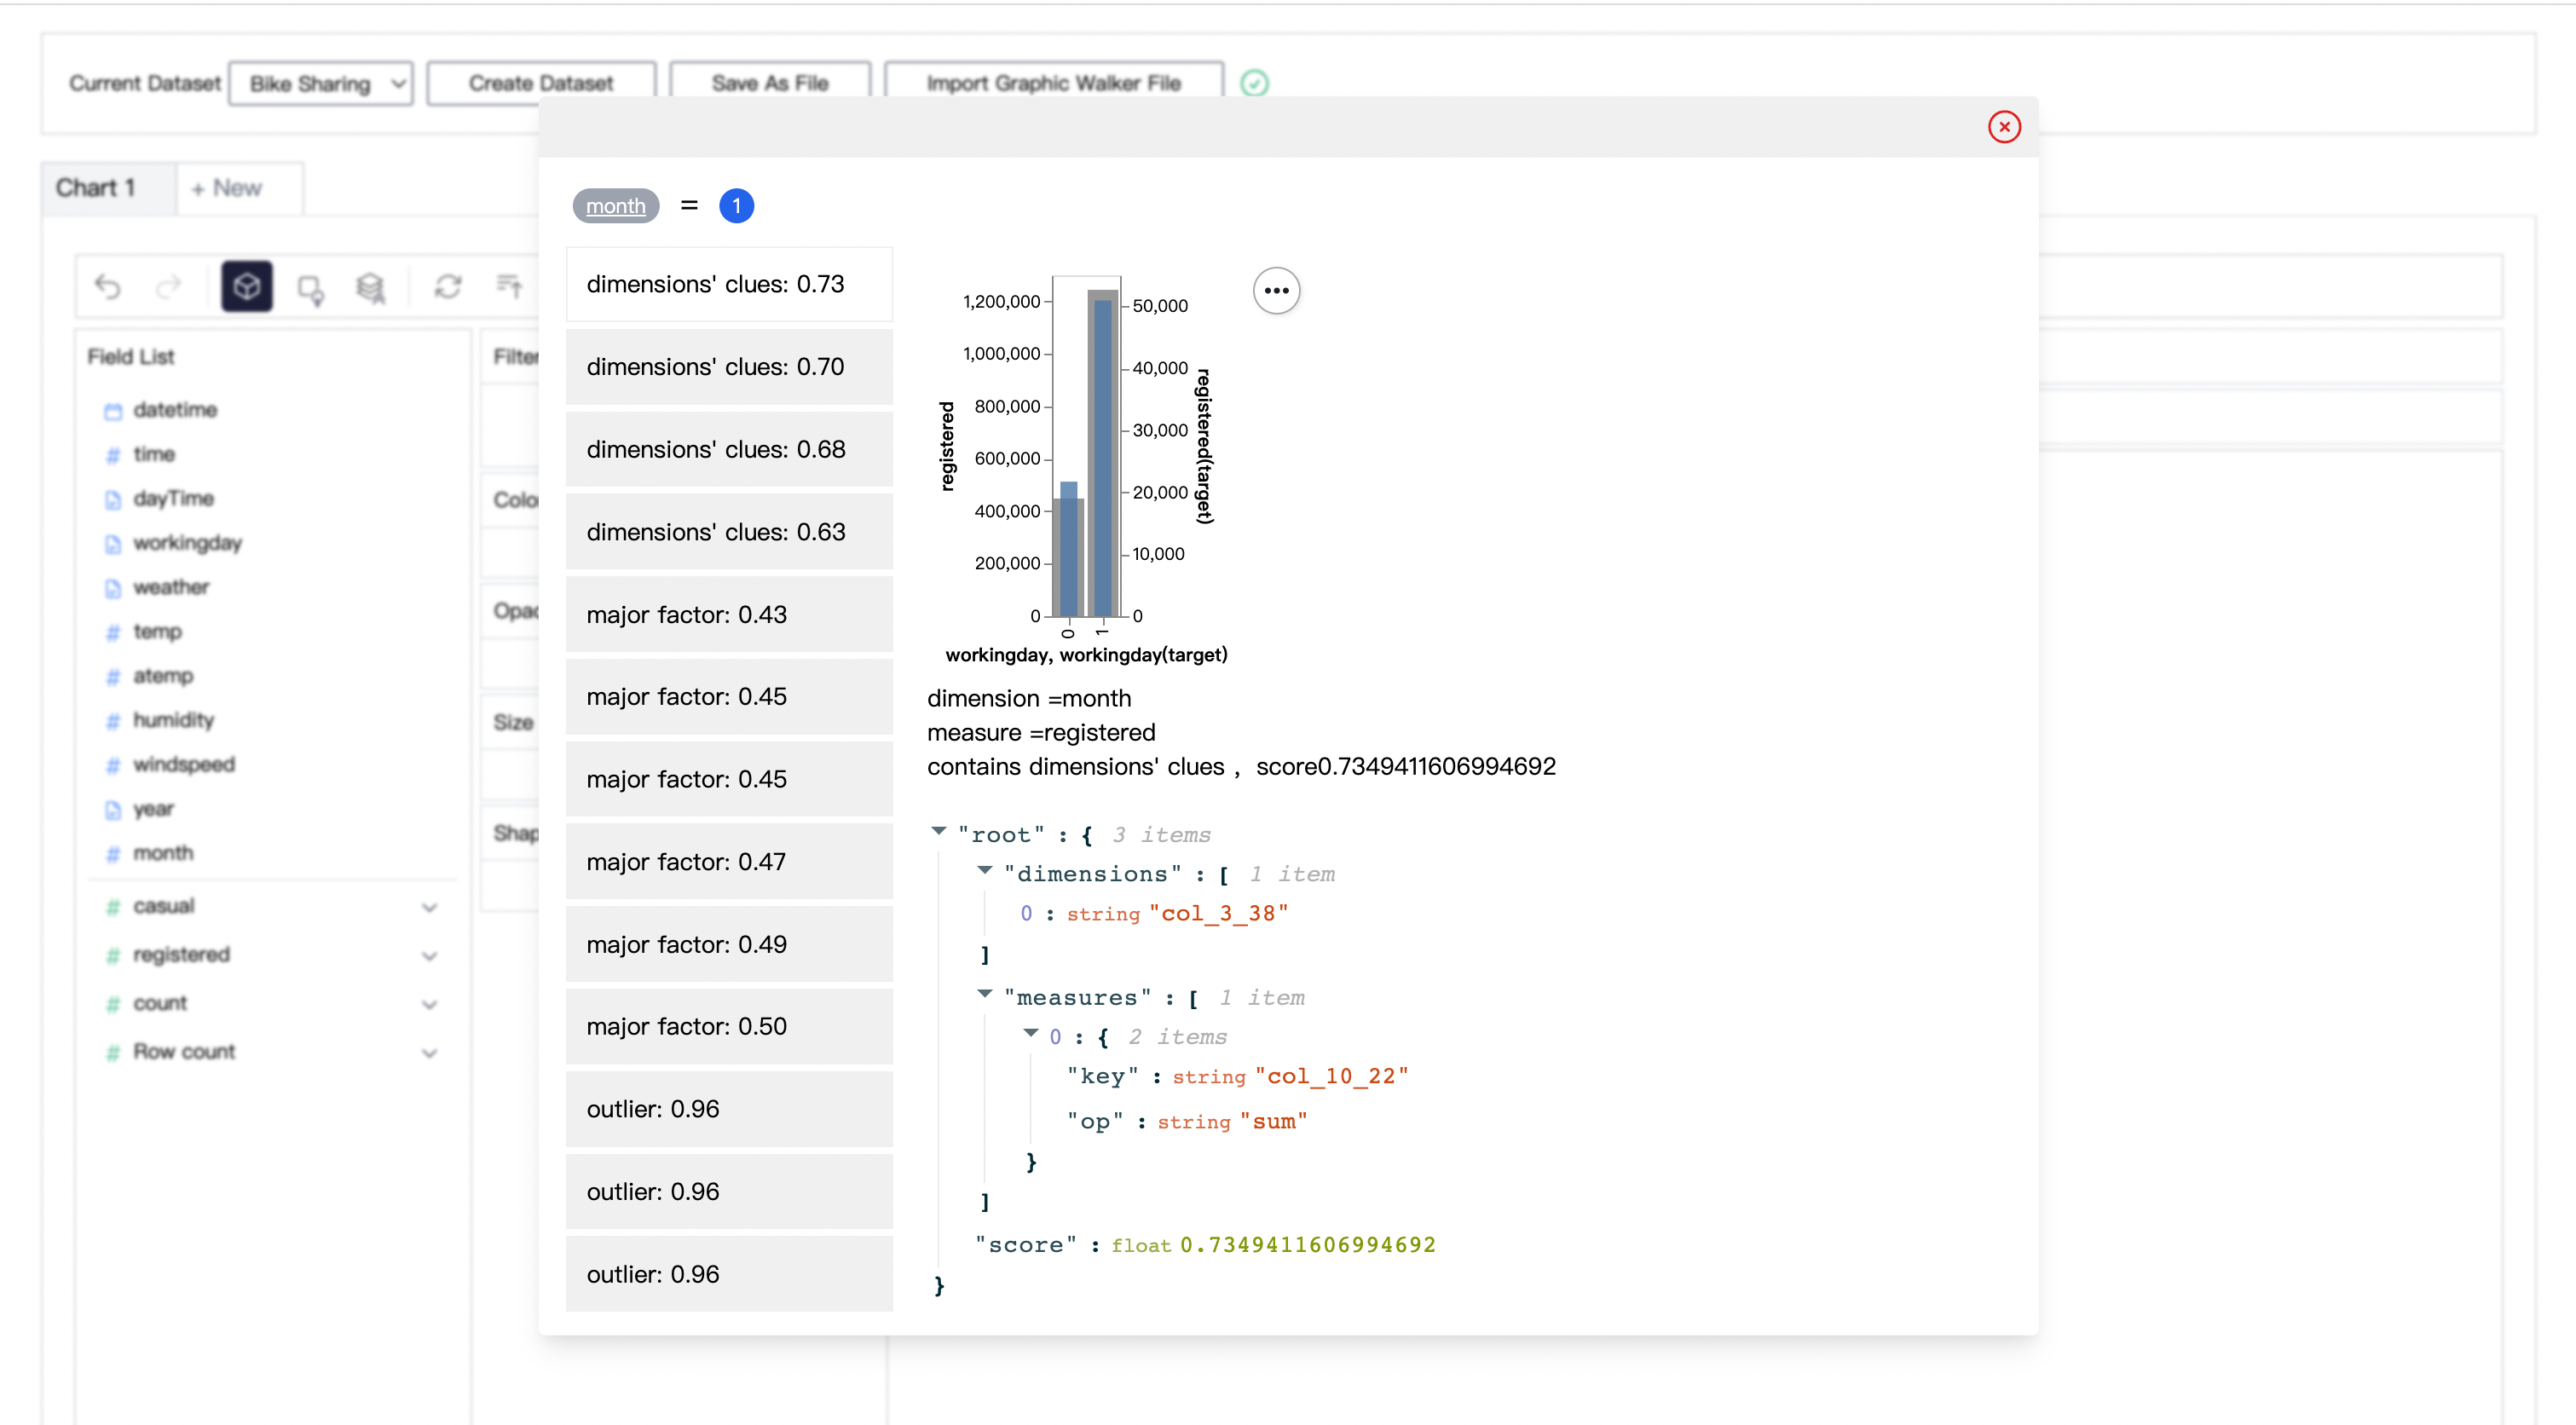
For example, in bike sharing dataset, ask why registered rents in Jan. is lower than expectation, the explainer will try to find some potential explanations:

graphic walker explain data button

(percent of number of working days is less than average)

graphic walker explain data result

Deploy, Usage for Developers

If you want to use Graphic Walker as a data exploration tool without thinking about deployment details, you can use our online out-of-the-box version.

Use it here: Graphic Walker Online

Examples here: Graphic Walker Examples

Method 1: use as an independent app.

yarn install

yarn workspace @kanaries/graphic-walker build

Method 2: Use as an embedding component module 🔥

Using graphic walker can be extremely easy. It provides a single React component which allows you to easily embed it in your app.

yarn add @kanaries/graphic-walker

# or

npm i --save @kanaries/graphic-walker

In your app:

import { GraphicWalker } from '@kanaries/graphic-walker';

const YourEmbeddingApp: React.FC<IYourEmbeddingAppProps> = props => {
    const { data, fields } = props;
    return <GraphicWalker
        data={data}
        fields={fields}
        chart={graphicWalkerSpec}
        i18nLang={langStore.lang}
    />;
}

export default YourEmbeddingApp;

If you have a configuration of GraphicWalker chart, you can use the PureRenderer or GraphicRenderer component to make a single chart without controls UI.

import { PureRenderer } from '@kanaries/graphic-walker';

const YourChart: React.FC<IYourChartProps> = props => {
    const { rawData, visualState, visualConfig, visualLayout } = props;
    return <PureRenderer
        rawData={rawData}
        visualState={visualState}
        visualConfig={visualConfig}
        visualLayout={visualLayout}
    />;
}

export default YourChart;

The GraphicRenderer component accepts same props as GraphicWalker, and would display the chart and the filters of the chart to change.

import { GraphicRenderer } from '@kanaries/graphic-walker';

const YourChart: React.FC<IYourChartProps> = props => {
    const { data, fields, spec } = props;
    return <GraphicRenderer
        data={data}
        fields={fields}
        chart={spec}
    />;
}

export default YourChart;

You can use TableWalker component to make a single table view with your data. it accepts same props as GraphicWalker, but you don't need to pass the chart prop, and you can control the page size by pageSize prop(default value is 20).

import { TableWalker } from '@kanaries/graphic-walker';

const YourChart: React.FC<IYourChartProps> = props => {
    const { data, fields, spec } = props;
    return <TableWalker
        data={data}
        fields={fields}
        pageSize={50}
    />;
}

export default YourChart;

try local (dev mode)

# packages/graphic-walker
npm run dev

Share with Open Source Community

Please consider sharing your experience or thoughts about graphic walker with the border Open Source community If you like this project.

GitHub Repo stars GitHub Repo stars GitHub Repo stars GitHub Repo stars GitHub Repo stars

I18n Support

Graphic Walker now support English (as "en" or "en-US") , Japanese (as "ja" or "ja-JP") , Chinese (as "zh" or "zh-CN") with built-in locale resources. You can simply provide a valid string value (enumerated above) as props.i18nLang to set a language or synchronize your global i18n language with the component like the following example:

const YourApp = props => {
    // ...

    const curLang = /* get your i18n language */;

    return <GraphicWalker
        data={data}
        fields={fields}
        i18nLang={curLang}
    />
}

Customize I18n

If you need i18n support to cover languages not supported currently, or to totally rewrite the content of any built-in resource(s), you can also provide your resource(s) as props.i18nResources to Graphic Walker like this.

const yourResources = {
    'de-DE': {
        'key': 'value',
        ...
    },
    'fr-FR': {
        ...
    },
};

const YourApp = props => {
    // ...

    const curLang = /* get your i18n language */;

    return <GraphicWalker
        data={data}
        fields={fields}
        i18nLang={curLang}
        i18nResources={yourResources}
    />
}

Graphic Walker uses react-i18next to support i18n, which is based on i18next, so your translation resources should follow this format. You can simply fork and edit /locales/en-US.json to start your translation.

It is recommended to use chatGPT-i18n to translate to your target languages.

API

Graphic Walker Props & Ref interface

Props

export interface IGWProps {
	data?: IRow[];
	fields?: IMutField[];
	spec?: Specification;
	i18nLang?: string;
	i18nResources?: { [lang: string]: Record<string, string | any> };
	keepAlive?: boolean | string;
    fieldKeyGuard?: boolean;
    vizThemeConfig?: IThemeKey;
    apperence?: IDarkMode;
    storeRef?: React.MutableRefObject<IGlobalStore | null>;
    computation?: IComputationConfig;
    toolbar?: {
        extra?: ToolbarItemProps[];
        exclude?: string[];
    };
    uiTheme?: IUIThemeConfig;
}

data: optional { Array<{[key: string]: any}> }

Array of key-value object data. Provide this prop with fields prop together.

fields: optional { IMutField }

Array of fields(columns) of the data. Provide this prop with data prop together.

spec: optional { Specification }

Visualization specification. This is an internal prop, you should not provide this prop directly. If you want to control the visualization specification, you can use storeRef prop.

i18nLang: optional { string = 'en-US' }

Graphic Walker support i18n, you can set the language of the component by this prop. Currently, we support en-US, zh-CN, ja-JP with built-in locale resources. If you want to use other languages, you can provide your own locale resources by i18nResources prop.

i18nResources: optional { { [lang: string]: Record<string, string | any> } }

Customize locale resources. See Customize I18n for more details.

keepAlive: optional { boolean | string = false }

Whether to keep the component state when it is unmounted. If provided, after you unmount the graphic-walker component, the state will still be stored, and will be restored when the component is mount again. If you need to enable keepAlive for multiple graphic-walker components, you can provide a unique string value for each component to distinguish them.

vizThemeConfig: optional { IThemeKey = "vega" }

Specify the chart theme to use.

appearance: optional { IDarkMode = "media" }

Specify the dark mode preference. There're three valid values:

  • "media": Use the system dark mode preference.
  • "dark": Always use dark mode.
  • "light": Always use light mode.

storeRef: optional { React.MutableRefObject<IGlobalStore | null> }

If you want to control the visualization specification, you can provide a React.MutableRefObject<IGlobalStore | null> to this prop. The IGlobalStore is the combined store context of Graphic Walker, you can use it to control the visualization specification.

computation: optional { IComputationFunction }

Specify the computation configuration. See Computation for more details.

  1. Client-side computation (default)

Provide noting to use client-side computation. In this mode, the computation will be done in the browser (mainly use WebWorker).

  1. Server-side computation

Graphic Walker will call given computation function with IDataQueryPayload as parameter. The function should returns a IRow[] as result. When you are using Server-side computation, you should provide fields together.

toolbar: optional { ToolbarProps }

Customize the toolbar.

scales: optional { IChannelScales }

Customize the scale of color, opacity, and size channel. see Vega Docs for available color schemes.

Here are some examples:

// use a another color pattren
const channelScales = {
    color: {
        scheme: "tableau10"
    }
}
// use a diffrent color pattren in dark mode and light mode
const channelScales = {
    color({theme}) {
        if(theme === 'dark') {
            return {
                scheme: 'darkblue'
            }
        }else {
            return {
                scheme: 'lightmulti'
            }
        }
    }
}
// use a custom color palette
const channelScales = {
    color: {
        range: ['red', 'blue', '#000000']
    }
}
// customing opacity
const channelScales = {
    // map value of 0 - 255 to opacity 0 - 1
    opacity: {
        range: [0, 1],
        domain: [0, 255],
    }
}
// set min radius for arc chart
const channelScales = {
    radius: {
        rangeMin: 20
    }
}

uiTheme: optional { IUIThemeConfig } (beta stage)

Specify the color that graphic walker use, so the background of Graphic Walker will match to your website.

currently in beta stage, the parameter may change in the future.

You can pass either css color name (such as cyan), tailwind color name (such as zinc-900), hex color (e.g. #ff0000), hsl color (e.g. hsl(217.2 91.2% 59.8%)), or hwb color(e.g. hwb(60, 3%, 60%)).

you can also use helpers to help you create a color config.

Here are some examples:

import { getColorConfigFromPalette, getPaletteFromColor } from '@kanaries/graphic-walker'

const uiTheme: IUIThemeConfig = {
    light: {
        background: 'amber-100',
        foreground: 'amber-950',
        primary: 'amber-950',
        'primary-foreground': 'amber-50',
        muted: 'amber-200',
        'muted-foreground': 'amber-500',
        border: 'amber-300',
        ring: 'amber-950',
    },
    dark: {
        background: 'amber-900',
        foreground: 'amber-50',
        primary: 'amber-50',
        'primary-foreground': 'amber-800',
        muted: 'amber-700',
        'muted-foreground': 'amber-400',
        border: 'amber-700',
        ring: 'amber-300',
    },
};

import colors from 'tailwindcss/colors';
const uiTheme = getColorConfigFromPalette(colors.zinc);

const uiTheme = getColorConfigFromPalette(getPaletteFromColor('#6366f1'));

<GraphicWalker uiTheme={uiTheme} />

Ref

export interface IGWHandler {
    chartCount: number;
    chartIndex: number;
    openChart: (index: number) => void;
    get renderStatus(): IRenderStatus;
    onRenderStatusChange: (cb: (renderStatus: IRenderStatus) => void) => (() => void);
    exportChart: IExportChart;
    exportChartList: IExportChartList;
}

chartCount: { number }

Length of the "chart" tab list.

chartIndex: { number }

Current selected chart index.

openChart: { (index: number) => void }

Switches to the specified chart.

renderStatus: { IRenderStatus }

Returns the status of the current chart. It may be one of the following values:

  • "computing": GraphicWalker is computing the data view.
  • "rendering": GraphicWalker is rendering the chart.
  • "idle": Rendering is finished.
  • "error": An error occurs during the process above.

onRenderStatusChange: { (cb: (renderStatus: IRenderStatus) => void) => (() => void) }

Registers a callback function to listen to the status change of the current chart. It returns a dispose function to remove this callback.

exportChart: { IExportChart }

Exports the current chart.

exportChartList: { IExportChartList }

Exports all charts. It returns an async generator to iterate over all charts. For example:

for await (const chart of gwRef.current.exportChartList()) {
    console.log(chart);
}

Server integration

For those who need to integrate graphic-walker with their own databases/OLAP, you can develop based on our SDK gw-dsl-parser

which translate graphic-walker specification to SQL

What's next

Graphic Walker is basically manual data exploration software. When facing more complex datasets, manual exploration can cost a lot of time, Rath is software providing a different data analysis experience with automation enhancement.

LICENSE

Please refer to LICENSE and LICENSE2 for Kanaries logos file.

graphic-walker's People

Contributors

antoineyang avatar basscoder2808 avatar bhznjns avatar bilalmirza74 avatar bruceyyu avatar cijiugechu avatar fengyxz avatar gehbt avatar github-actions[bot] avatar imyuanx avatar islxyqwe avatar jojocys avatar k6sdevbob avatar kainblake avatar kushie0 avatar leko avatar levinotik avatar longxiaofei avatar observedobserver avatar sudhanshu-77 avatar unimu-cic avatar

Stargazers

 avatar  avatar  avatar  avatar  avatar  avatar  avatar  avatar  avatar  avatar  avatar  avatar  avatar  avatar  avatar  avatar  avatar  avatar  avatar  avatar  avatar  avatar  avatar  avatar  avatar  avatar  avatar  avatar  avatar  avatar  avatar  avatar  avatar  avatar  avatar  avatar  avatar  avatar  avatar  avatar  avatar  avatar  avatar  avatar  avatar  avatar  avatar  avatar  avatar  avatar  avatar  avatar  avatar  avatar  avatar  avatar  avatar  avatar  avatar  avatar  avatar  avatar  avatar  avatar  avatar  avatar  avatar  avatar  avatar  avatar  avatar  avatar  avatar  avatar  avatar  avatar  avatar  avatar  avatar  avatar  avatar  avatar  avatar  avatar  avatar  avatar  avatar  avatar  avatar  avatar  avatar  avatar  avatar  avatar  avatar  avatar  avatar  avatar  avatar  avatar

Watchers

 avatar  avatar  avatar  avatar  avatar  avatar  avatar  avatar  avatar  avatar

graphic-walker's Issues

Date filtering feature does not work

Dear Maintainers,

I have posted this issue here, double posting for visibility: Kanaries/pygwalker#256

I have also found that when using derived data points (like create a Year field from timestamp), then it cannot be placed into the filter and the entire app hangs. So it's impossible to select any date range at the moment.

Could you please fix the date filtering functionality? Thank you very much in advance.

[discuss] extra field for measurements in pivot table

I found the new pivot table feature very powerful, but it forces me to put my measurement to either x-axis or y-axis, which is not intuitive.
As shown in the pic, I can put my measurements to either x or y axis. Sounds flexible but not intuitive for an excel user because in excel there is a field dedicated for measurements. Also, when the number of dimensions in the field list increases, it is easy to make the field list messy.
image

I looked into the pivot table feature in Tableau and Excel, and seems they are using different strategies.

  • Tableau: user define the measurement in the "label" field of the "mark" panel, and only one measurement is allowed in each table. However, it allows user to further take advantage of the visual channels (color, size, etc.)
image
  • Excel: user define the measurements in the "values" field and multiple measurements are allowed, but there is no such visual channel in a table.
image

In one word, they both use an extra field for measures, so I believe it would be better if KG does it in the same manner

Any idea / suggestion is appreciated 😊

Fully offline

In the code, there are some url links to point to many locations, that is making the product require a connection to the internet.

When we deploy it in a closed network environment, or as a desktop app in a bad network, the user will have bad experience or no experience at all(if he dosen't have a connection).

Thus we would like to compile the package with resolved links as assets, or some other method.

Thank you!

[BUG] (unreproducible yet) Filter channel locked after inserting one filter

The filter channel got locked so that no more pills could be appended into filter channel and the one in filter channel could not be removed whatever either.

Reproduction

No stable reproduction found yet.

Drag a field into the filter channel, then try to (1) drag another into it or (2) remove the existed one.

Expected Behavior

  1. A new filter rule will be appended.
  2. The filter rule will be removed wherever you drop it outside the filter channel.

Actual Behavior

Nothing actually happened.

The valid value of opacity

image

I have some questions about the opacity

  • I set column "weight" as opacity, there are 2 values in this col, 1 and 255.
  • A sample line in my df is {'name':'some name', 'month':'2022-02', 'weight':255}, name as Y and month as X, and weight means the opacity of the cell such as a heatmap.
  • If this col is "dimension", then drag on opacity, it looks fine. But if set as "measure", it looks been calculated for the whole column.
  • And even if I set the weight from 10 to 100, or 1 to 255, or 0.1 to 1, the opacities look the same, is it some normalization happened? Can I set a specific value for the opacity?

Using graphic-walker in angular application

Hi

I want to use this library in an angular application. But I am unable to find any helpful implementation. I am also trying to use react component in angular but am still unable to use it properly, it gives errors for the library

Does anyone have any idea regarding this how can i implement this library in an angular application and start using this for different feature development purposes?

feature request: text mark and channel

Hi,

graphic-walker features many marks but not text.

I find text mark critical for some key visuals, starting with the 'grid of formulae' "picture" here:

https://observablehq.com/@declann/some-cashflows

image

Would there be a difficulty supporting a text mark?

+Creating a separate issue for facets.

Thanks for the epic tool and really epic interface !
Very excited to discover this.

Regards,
Declan

VS Code

for vs code application does not work? what about the dark theme?

image

request: parquet source

Hello,

thank you for the very nice tool, do you plan to extend the data source formats with parquet?

feature requests: independent scales option, legend on/off option

Hi, an option to use independent scales in facets would be useful, e.g. in the following chart we can't see the employees marks because the scale for other formulae is too big.

image

This is chart 2 in https://gist.github.com/declann/3e973796671f81d332c2ce36e3471e27

In this chart it's also useful to be able to remove legend as the color channel is redundant.

Is there a wish for this level of flexibility into graphic walker?

If not, I can probably do vega lite spec patching, supposing I embed graphic walker.

Thanks
Declan

Pivot table: repeat labels

In pivot tables with multiple fields mapped to one axis, an option to repeat labels would help to make the table easier to scan.

e.g. in the following full adder truth table:

Screenshot from 2023-07-30 22-41-26

bug: undefined calculation for quantitative measures converted from dimension

When I converted a dimension variable to a measure one, its calculation will be "undefined". I think there should be a default calculation for it, may be sum?

I pasted an example below, where I used Bike Sharing dataset and tried to converted humidity from dimension to measure, and the x-axis turned out to be undefined(humidity)

image

[feat] Custom Bin Config

Issue: current bin transformation cannot be customized for bin number(which is defaulted by 10).
TODO:

  • Allow the user to customize the bin's config (bin number)
  • Default bin is still set as 10 in the field menu, the config panel is only for those who need customization (progressive design).

image

image

Axis zoom is very restrictive

Is there someway to manage my zoom in only on the y-axis? The variability of my data is in the 0.001% range and it just looks like a straight line no matter how much I zoom because the zoom appears to be locked on both the x and y axis.

Also it appears to default to have y=0 on the bottom, my values are in the 10^6 and again it makes things look like straight line.

mobile DND doesn't work / unusable on mobile/tablet

On mobile/tablet no DND works for me in GW so there is no way to interact with GW.

Developing mobile DND or else an additional interaction approach like dropdowns would make this usable on mobile/tablets.

Switching between measure and dimension

I'm experimenting with gwalker inside Jupyter notebook.

df = pd.read_csv('./bike_path.csv', parse_dates=['datetime'])
gwalker = pyg.walk(df, hideDataSourceConfig=False)

There doesn't seem to be a way in the UI to shift a field from it's current designation (as a measure) to the other designation(dimension) or vice versa.

How do I control how an arbitrary column is interpreted by Gwalker.

And in a related question, if my original dataframe has a 'datetime' column, but in a visualiization I might want to use datetime.month or datetime.year, is there anyway to specify that use in the UI, or do I need to specify new columns in the df (month, year, etc) ?

Thanks

datasets with only categorical variables didn't worked in `pygwalker`. It didn't generate any dashboard.

It's cool how fast it works to generate the UI. I have one doubt if anyone can explain. I tried loading a dataframe with categorical variables but this library didn't worked. It didn't generate any dashboard. I tried after selecting only those columns which are int or float then it was working fine. Let me know am i wrong somewhere? New to tableau though.

From reddit user's comment

It seems sometimes gw failed when there are only nominal fields.

[feat] Deletable charts?

Currently the charts are not deletable since created, so I wonder whether it is possible to allow users to discard the unwanted charts.

PureRednererApp component: limit can't work.

<PureRenderer
    name={spec.name}
    visualConfig={spec.config}
    visualState={spec.encodings}
    type='remote'
    computation={computationCallback!}
/>

set spec.config.limit to 30, it can't work.

Primary color setting bug

  1. open graphic walker
  2. click config button
  3. open color palette for primary color
    (sometimes you can find the color rgba is ull)
  4. click somewhere else

-> page crash

Support for React 18+

Hi! I came across this very nice package, and I would like to integrate it into a platform for neuroscience research. Unfortunately, the platform requires 18. Are there any plans to update graphic-walker to support React 18? Thank you.

Mouse delay and UI enhance request

But the interface is a little wonky inside of my Jupyter notebook. All the buttons on the side look kinda faint, and the GUI looks small with everything at a small font size. Also there is a mouse delay. I'm sure a lot of these problems could be solved on my end, but the package seems to work a lot better in the Google or Kaggle notebooks.

From Reddit user's comment

Workflow to Support Lazy Loading of Dataset?

I'm considering using the @kanaries/graphic-walker library for generic data visualisation, and I'm finding it extremely useful. However, I have a requirement where I need to handle large datasets efficiently. Currently, the library fetches the entire dataset upfront, which can be problematic when dealing with large amounts of data. I'm assuming that based on demos; please let me know if I'm wrong. We have a requirement to display spatial datasets which can go up to 50GB in size.

I wanted to inquire if it's possible to modify the workflow of the library to support the lazy loading of the dataset as a React Component. Here's the proposed workflow:

  • Initially, only fetch the measures and dimensions from the data source. JSON API is preferable, but direct SQL connection is also doable.
  • Allow the user to make chart selections such as the x-axis, y-axis, size, and color.
  • A button (e.g., "Generate Visualization") should be used to trigger the lazy loading of the dataset. It can either filter via the JSON API,or fetch the actual group/subset via SQL query, based on the selected measures and dimensions.
  • Once the dataset is fetched, generate the visualization using the selected chart options.

Please let me know if this is something that can be done using this library as an import without needing to customize the internals.

Example data for React component

Where can I find a good example to know how the dataSource, rawFields and spec properties of the GraphicWalker component need to be specified? I did not find a good example for different types of fields. Thank you.

Recommend Projects

  • React photo React

    A declarative, efficient, and flexible JavaScript library for building user interfaces.

  • Vue.js photo Vue.js

    🖖 Vue.js is a progressive, incrementally-adoptable JavaScript framework for building UI on the web.

  • Typescript photo Typescript

    TypeScript is a superset of JavaScript that compiles to clean JavaScript output.

  • TensorFlow photo TensorFlow

    An Open Source Machine Learning Framework for Everyone

  • Django photo Django

    The Web framework for perfectionists with deadlines.

  • D3 photo D3

    Bring data to life with SVG, Canvas and HTML. 📊📈🎉

Recommend Topics

  • javascript

    JavaScript (JS) is a lightweight interpreted programming language with first-class functions.

  • web

    Some thing interesting about web. New door for the world.

  • server

    A server is a program made to process requests and deliver data to clients.

  • Machine learning

    Machine learning is a way of modeling and interpreting data that allows a piece of software to respond intelligently.

  • Game

    Some thing interesting about game, make everyone happy.

Recommend Org

  • Facebook photo Facebook

    We are working to build community through open source technology. NB: members must have two-factor auth.

  • Microsoft photo Microsoft

    Open source projects and samples from Microsoft.

  • Google photo Google

    Google ❤️ Open Source for everyone.

  • D3 photo D3

    Data-Driven Documents codes.