GithubHelp home page GithubHelp logo

karolzak / ipyplot Goto Github PK

View Code? Open in Web Editor NEW
398.0 8.0 38.0 28.51 MB

IPyPlot is a small python package offering fast and efficient plotting of images inside Python Notebooks. It's using IPython with HTML for faster, richer and more interactive way of displaying big numbers of images.

License: MIT License

Python 100.00%
image-processing image-classification images plotting-in-python jupyter-notebook notebooks html machine-learning deep-learning visualization image-viewer notebook python

ipyplot's Introduction

Build PyPI - version Downloads Downloads/Month license

Share:
Twitter URL LinkedIn URL

IPyPlot is a small python package offering fast and efficient plotting of images inside Python Notebooks cells. It's using IPython with HTML for faster, richer and more interactive way of displaying big numbers of images.

Displaying big numbers of images with Python in Notebooks always was a big pain for me as I always used matplotlib for that task and never have I even considered if it can be done faster, easier or more efficiently.
Especially in one of my recent projects I had to work with a vast number of document images in a very interactive way which led me to forever rerunning notebook cells and waiting for countless seconds for matplotlib to do it's thing..
My frustration grew up to the point were I couldn't stand it anymore and started to look for other options..
Best solution I found involved using IPython package in connection with simple HTML. Using that approach I built this simple python package called IPyPlot which finally helped me cure my frustration and saved a lot of my time.

Features:

  • Easy, fast and efficient plotting of images in python within notebooks
  • Plotting functions (see examples section to learn more):
    • plot_images - simply plots all the images in a grid-like layout
    • plot_class_representations - similar to plot_images but displays only the first image for each label/class (based on provided labels collection)
    • plot_class_tabs - plots images in a grid-like manner in a separate tab for each label/class based on provided labels
  • Supported image formats:
    • Sequence of local storage URLs, e.g. [your/dir/img1.jpg]
    • Sequence of remote URLs, e.g. [http://yourimages.com/img1.jpg]
    • Sequence of PIL.Image objects
    • Sequence of images as numpy.ndarray objects
    • Supported sequence types: list, numpy.ndarray, pandas.Series
  • Misc features:
    • custom_texts param to display additional texts like confidence score or some other information for each image
    • force_b64 flag to force conversion of images from URLs to base64 format
    • click on image to enlarge
    • control number of displayed images and their width through max_images and img_width params
    • "show html" button which reveals the HTML code used to generate plots
    • option to set specific order of labels/tabs, filter them or ignore some of the labels
  • Supported notebook platforms:
    • Jupyter
    • Google Colab
    • Azure Notebooks
    • Kaggle Notebooks

Getting Started

To start using IPyPlot, see examples below or go to gear-images-examples.ipynb notebook which takes you through most of the scenarios and options possible with IPyPlot.

Installation

IPyPlot can be installed through PyPI:

pip install ipyplot

or directly from this repo using pip:

pip install git+https://github.com/karolzak/ipyplot

Usage examples

IPyPlot offers 3 main functions which can be used for displaying images in notebooks:

To start working with IPyPlot you need to simply import it like this:

import ipyplot

and use any of the available plotting functions shown below (notice execution times).

  • images - should be a sequence of either string (local or remote image file URLs), PIL.Image objects or numpy.ndarray objects representing images
  • labels - should be a sequence of string or int

Display a collection of images

images = [
    "docs/example1-tabs.jpg",
    "docs/example2-images.jpg",
    "docs/example3-classes.jpg",
]
ipyplot.plot_images(images, max_images=30, img_width=150)
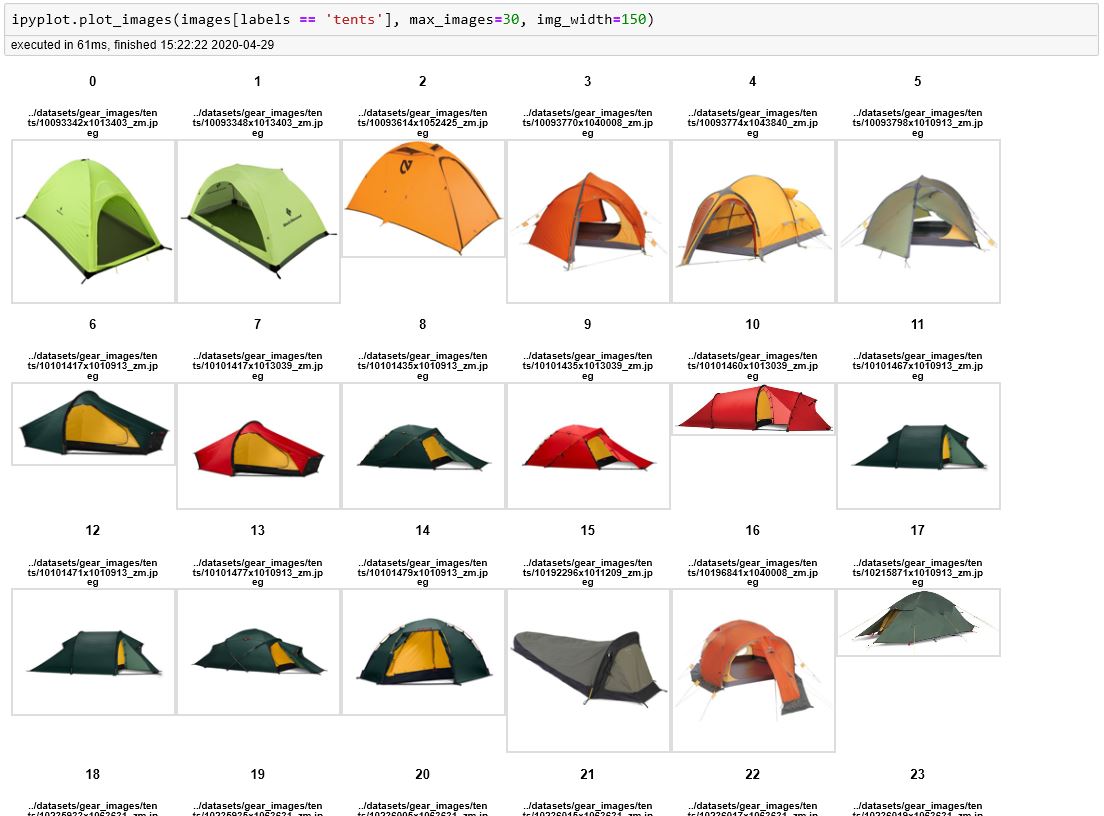
Display class representations (first image for each unique label)

images = [
    "docs/example1-tabs.jpg",
    "docs/example2-images.jpg",
    "docs/example3-classes.jpg",
]
labels = ['label1', 'label2', 'label3']
ipyplot.plot_class_representations(images, labels, img_width=150)
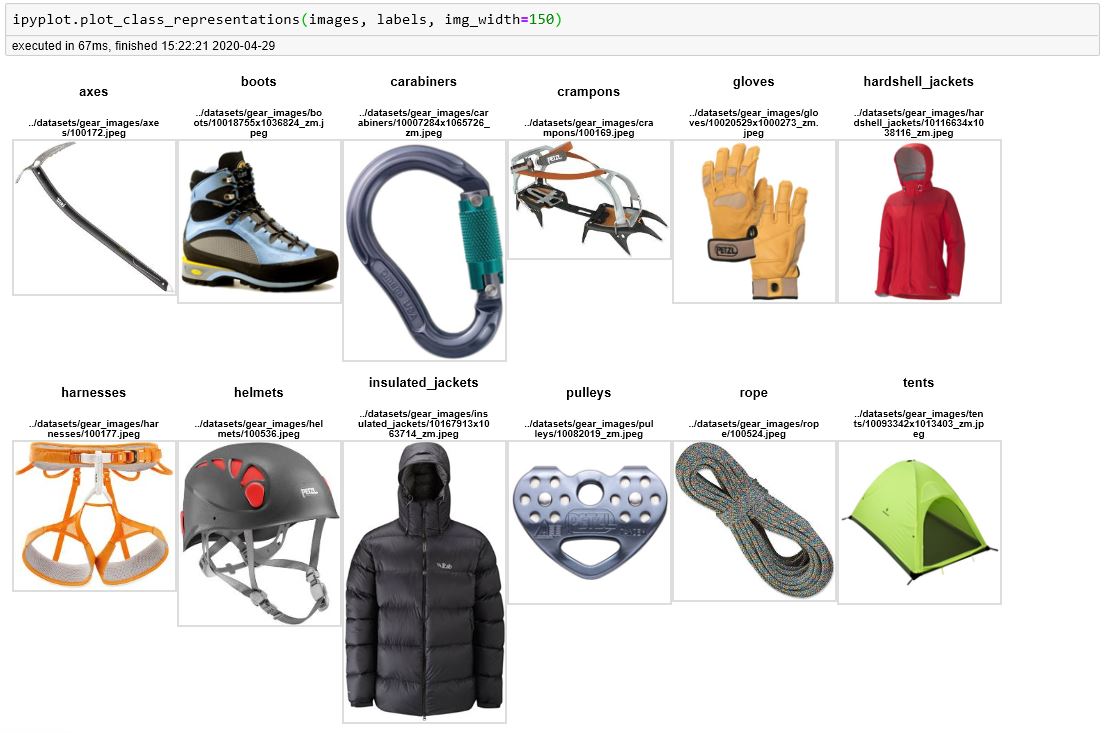
Display images in separate, interactive tabs for each unique class

images = [
    "docs/example1-tabs.jpg",
    "docs/example2-images.jpg",
    "docs/example3-classes.jpg",
]
labels = ['class1', 'class2', 'class3']
ipyplot.plot_class_tabs(images, labels, max_imgs_per_tab=10, img_width=150)

To learn more about what you can do with IPyPlot go to gear-images-examples.ipynb notebook for more complex examples.

ipyplot's People

Contributors

alyetama avatar davidefiocco avatar karolzak avatar maarten-vr avatar ricoms avatar

Stargazers

 avatar  avatar  avatar  avatar  avatar  avatar  avatar  avatar  avatar  avatar  avatar  avatar  avatar  avatar  avatar  avatar  avatar  avatar  avatar  avatar  avatar  avatar  avatar  avatar  avatar  avatar  avatar  avatar  avatar  avatar  avatar  avatar  avatar  avatar  avatar  avatar  avatar  avatar  avatar  avatar  avatar  avatar  avatar  avatar  avatar  avatar  avatar  avatar  avatar  avatar  avatar  avatar  avatar  avatar  avatar  avatar  avatar  avatar  avatar  avatar  avatar  avatar  avatar  avatar  avatar  avatar  avatar  avatar  avatar  avatar  avatar  avatar  avatar  avatar  avatar  avatar  avatar  avatar  avatar  avatar  avatar  avatar  avatar  avatar  avatar  avatar  avatar  avatar  avatar  avatar  avatar  avatar  avatar  avatar  avatar  avatar  avatar  avatar  avatar  avatar

Watchers

 avatar  avatar  avatar  avatar  avatar  avatar  avatar  avatar

ipyplot's Issues

Sort images in plot_class_tabs

Hello there, thank you for your library !

Looking for a way to:
given a panda dataframe, where colums are [image_path, class, value] , display plot_class_tabs where labels is class column and images are visualized sorted based on value column

thank you

[Bug] "TypeError: Cannot handle this data type" when using numpy.ndarray with floats

Getting an error when trying to run IPyPlot with images in numpy.ndarray format with float data type.

KeyError                                  Traceback (most recent call last)
~\Anaconda3\envs\py36tf2gpu\lib\site-packages\PIL\Image.py in fromarray(obj, mode)
   2644             typekey = (1, 1) + shape[2:], arr["typestr"]
-> 2645             mode, rawmode = _fromarray_typemap[typekey]
   2646         except KeyError:

KeyError: ((1, 1, 3), '<f4')

During handling of the above exception, another exception occurred:

TypeError                                 Traceback (most recent call last)
<ipython-input-36-2d4541c259ee> in <module>
      4 imgs = np.random.rand(3,128,128,3).astype(np.float32)
      5 
----> 6 ipyplot.plot_images(imgs)

d:\git\ipyplot\ipyplot\plotting.py in plot_images(images, labels, max_images, img_width, force_b64)
     90         labels = list(range(0, len(images)))
     91     html = _create_imgs_list_html(
---> 92         images, labels, max_images, img_width, force_b64=force_b64)
     93 
     94     _display(html)

d:\git\ipyplot\ipyplot\plotting.py in _create_imgs_list_html(images, labels, max_images, img_width, force_b64)
    238     html = ''.join([
    239         _create_img_html(x, img_width, label=y, force_b64=force_b64)
--> 240         for x, y in zip(images[:max_images], labels[:max_images])
    241     ])
    242     return html

d:\git\ipyplot\ipyplot\plotting.py in <listcomp>(.0)
    238     html = ''.join([
    239         _create_img_html(x, img_width, label=y, force_b64=force_b64)
--> 240         for x, y in zip(images[:max_images], labels[:max_images])
    241     ])
    242     return html

d:\git\ipyplot\ipyplot\plotting.py in _create_img_html(image, width, label, force_b64)
    230     if use_b64:
    231         html += '<img src="data:image/png;base64,%s" style="margin: 1px; width: %spx; border: 2px solid #ddd;"/>' % (
--> 232             _img_to_base64(image, width*2), width)  # NOQA E501
    233 
    234     return html + '</div>'

d:\git\ipyplot\ipyplot\plotting.py in _img_to_base64(image, max_size)
    206 def _img_to_base64(image, max_size):
    207     if type(image) is np.ndarray:
--> 208         image = Image.fromarray(image)
    209     elif type(image) is str or type(image) is str_:
    210         image = Image.open(image)

~\Anaconda3\envs\py36tf2gpu\lib\site-packages\PIL\Image.py in fromarray(obj, mode)
   2645             mode, rawmode = _fromarray_typemap[typekey]
   2646         except KeyError:
-> 2647             raise TypeError("Cannot handle this data type")
   2648     else:
   2649         rawmode = mode

TypeError: Cannot handle this data type

Minimum repro:

import ipyplot
import numpy as np

# this will fail:
imgs = np.random.rand(3,128,128,3).astype(np.float32)
ipyplot.plot_images(imgs)

# this will work:
ipyplot.plot_images((imgs * 255).astype(np.uint8))

[Feature Request] Save the output of the plot

My blog is written using fastpages so the output of ipyplot does not render on the website.

As a workaround, I would like to save the output as a png file and then add it to my blog via markdown.

Unfortunately, I can't figure out how to save the output and I don't see it written anywhere in the documentation for how to save the output.

Once again, greatly appreciate the work you do.

It would be nice if the return_html option is present

Currently, the plot functions only generate HTML and do not return any images. This behavior makes it difficult (if not impossible) to download plotted images, especially if the plot is generated from a NumPy array. However, since the HTML contains the base64-encoded image information (or the URI to the image), downloading the image can be done easily with the BeautifulSoup library if the return_html option is present.

[Feature Request] Set the order for the labels

It would be insanely useful to be able to tel ipyplot the order of the categories.

For example, I have attempting to print a list of books ordered by age. Unfortunately, even after sorting both the array of file paths and the array of labels, the pictures still come out in the wrong order.

To be clear, what I'm asking for is this:
2, 3, 4, 5, 6, 7 8, 9, 10, 11, 12, 13, 14, 15, 16, 17

instead of this:
10, 11, 12, 13, 14, 15, 16, 17, 2, 3, 4, 5, 6, 7, 8, 9

Screenshot from 2020-08-12 23-09-50

Thank you once again for this amazing tool ๐Ÿ˜„

pypi version not working with latest numpy. master partly fixes but fails with PIL images.

Latest numpy does not allow np.float and I see that is fixed in master but not on pypi. However master version does not work with PIL images. For some reason the tests pass but in practice I get errors.

----> 8 plot_images(images)

File ~\anaconda3\Lib\site-packages\ipyplot_plotting.py:144, in plot_images(images, labels, custom_texts, max_images, img_width, zoom_scale, show_url, force_b64)
140 labels = _np.asarray(labels)
142 custom_texts = _np.asarray(custom_texts) if custom_texts is not None else custom_texts # NOQA E501
--> 144 html = _create_imgs_grid(
145 images=images,
146 labels=labels,
147 custom_texts=custom_texts,
148 max_images=max_images,
149 img_width=img_width,
150 zoom_scale=zoom_scale,
151 show_url=show_url,
152 force_b64=force_b64)
154 _display_html(html)

File ~\anaconda3\Lib\site-packages\ipyplot_html_helpers.py:394, in _create_imgs_grid(images, labels, custom_texts, max_images, img_width, zoom_scale, show_url, force_b64, resize_image)
391 html, grid_style_uuid = _get_default_style(img_width, zoom_scale)
393 html += '

' % grid_style_uuid
--> 394 html += ''.join([
395 _create_img(
396 x, width=img_width, label=y,
397 grid_style_uuid=grid_style_uuid,
398 custom_text=text, show_url=show_url,
399 force_b64=force_b64,
400 resize_image=resize_image
401 )
402 for x, y, text in zip(
403 images[:max_images], labels[:max_images],
404 custom_texts[:max_images])
405 ])
406 html += '
'
407 return html

File ~\anaconda3\Lib\site-packages\ipyplot_html_helpers.py:395, in (.0)
391 html, grid_style_uuid = _get_default_style(img_width, zoom_scale)
393 html += '

' % grid_style_uuid
394 html += ''.join([
--> 395 _create_img(
396 x, width=img_width, label=y,
397 grid_style_uuid=grid_style_uuid,
398 custom_text=text, show_url=show_url,
399 force_b64=force_b64,
400 resize_image=resize_image
401 )
402 for x, y, text in zip(
403 images[:max_images], labels[:max_images],
404 custom_texts[:max_images])
405 ])
406 html += '
'
407 return html

File ~\anaconda3\Lib\site-packages\ipyplot_html_helpers.py:311, in _create_img(image, label, width, grid_style_uuid, custom_text, show_url, force_b64, resize_image)
308 # if image is not a string it means its either PIL.Image or np.ndarray
309 # that's why it's necessary to use conversion to b64
310 if use_b64:
--> 311 img_html += '' % _img_to_base64(
312 image,
313 width if resize_image else None)
315 html = """
316


317

(...)
327

328 """ % {'0': grid_style_uuid, '1': img_uuid, '2': label, '3': img_html} # NOQA E501
329 return html

File ~\anaconda3\Lib\site-packages\ipyplot_img_helpers.py:84, in img_to_base64(image, target_width)
82 image = PIL.Image.fromarray(image.astype(np.uint8))
83 else:
---> 84 image = PIL.Image.fromarray(image)
85 elif type(image) is str or type(image) is str
:
86 image = PIL.Image.open(image)

File ~\anaconda3\Lib\site-packages\PIL\Image.py:3073, in fromarray(obj, mode)
3071 except KeyError as e:
3072 msg = "Cannot handle this data type: %s, %s" % typekey
-> 3073 raise TypeError(msg) from e
3074 else:
3075 rawmode = mode

TypeError: Cannot handle this data type: (1, 1, 3), |O

would be better if images are resized

Really useful tool thanks.

If I pass 1500*1500 images with img_width=224 then it passes the whole image for display so runs out of memory rapidly. I expected that the images would be resized to the img_width. Perhaps some people may want to have access to orginal image but more often not.

[Feature Request] - image-specific labels

Hey @karolzak , just formalizing the feature request we discussed in issue #8

I think it would be great if functions like plot_class_tabs offered the ability to add image-specific text labels in place of the numeric indices that it defaults to. Ideally these could be any text, likely provided through an iterable alongside the labels and images. The labels could be any number of things, but the use case I'm imagining is having them be confidence scores from an image classification model.

Thanks!

Disable enlarge image

This feature doesn't work on Google Colabs, and similar to use b64, it would be nice to have this able to bedisabled, or somehow use a compatible method for Colabs.

Displaying GIFs

Hi there!

Thank you for the project, found it pretty helpful :)

Unfortunately, I didn't find any way to display a grid of GIFs (.gif files). Could you please help with setting the right arguments, or should It be [Feature Request] issue?

Thank you!

Is there any way to hide `show html` button?

I'm using nbdev and noticed that ipyplot is slowing down a critical html page generator (nbdev_preview) significantly (like 10X). I'm betting it is due to show html button. Is there any way to not display it? I've never had the need to expand it.

Version on PyPI is outdated

When I tried to install the package through PyPI the version was 1.1.0 and it didn't have the show_url option.
To install the latest update, I had to use pip install git+https://github.com/karolzak/ipyplot.

Just to let you know to update it also on https://pypi.org/project/ipyplot/

Thanks for the code!

plot_class_tabs function not displaying correctly in Google Colab environment

Noticed that there are 2 issues with using ipyplot inside Google Colab environment (probably in similar environments like Azure Notebooks or Kaggle as well?):

  1. HTML displays broken image file links when trying to plot images directly from local filesystem using string file paths - seems like there's some problem with relative paths for HTML under Google Colab notebooks
    Capturex

  2. plot_class_tabs styling is completely broken which means that bootstrap js package is missing
    Capturex2

Fix propositions:

  1. Add force_b64 param to all the functions which would load file from local file system to the memory and convert into base64 format and inject it directly into html

  2. Simplify HTML layout to get rid of any external JS libs and just use basic HTML + CSS

labels color issues

the image's label can not see, the font color is same as the background, have any settings to change font color?

[Bug] HTML wont display

Hi, thank's for this package - it looks like exactly what I was looking for.
I am struggling to find a way to use this in Databricks though which is where I want to use this. The package runs fine but instead of seeing the output as an image, I see
<IPython.core.display.HTML object> twice
when I try ipyplot.plot_images or ipyplot.plot_class_tabs
Is there a way to add a flag to return the html directly from the function call so I can use the built in function to display html? Because the html is hidden, I can't click the link that would display the html

Warning about using JpegImageFile under Python 3.11

When running this under Python 3.11.3 as ipyplot.plot_images(images) where images is an array of PIL.Image (actually JpegImageFile), I get the following warning:

.../lib/python3.11/site-packages/ipyplot/_utils.py:95: FutureWarning: The input object of type 'JpegImageFile' is an array-like implementing one of the corresponding protocols (`__array__`, `__array_interface__` or `__array_struct__`); but not a sequence (or 0-D). In the future, this object will be coerced as if it was first converted using `np.array(obj)`. To retain the old behaviour, you have to either modify the type 'JpegImageFile', or assign to an empty array created with `np.empty(correct_shape, dtype=object)`.
  return np.asarray(seq, dtype=type(seq[0]))

Is this already known?

ipyplot.plot_class_tabs not showing images

Hi there,
I am using ipyplot.plot_class_tabs where the images is a pd.Series of local paths
when running the line, it doesn't show the images, only the icon of the image as it's not able to load them. the paths are already relative paths in a folder in the same directory of the notebook I am running
Images are all jpg format

Am I missing something?

I also tried using the absolute path but still same issue
Thank you for the help

[Bug] Different type checking for same-size vs different size images in group

First of all - thanks for the lib, it is really nice and helpful!

I first came across a strange thing, which is a different working of the library when I pass data as imageIO images. Although they are numpy arrays - I think they aren't recognized correctly by the library, but this only affects the situation when the passed images are of diverse shapes.

See this reproducible example:

S1 = 300
S2 = 400
data1 = np.random.randint(0,255, (S1,S1,3))
imageio.imsave(img1_path := "/tmp/img1.png", data1)

data2 = np.random.randint(0,255, (S2,S2,3))
imageio.imsave(img2_path := "/tmp/img2.png", data2)

img = imageio.imread(img1_path)
img2 = imageio.imread(img2_path)

images = [img, img2]

for img in images:
    print(type(img), img.shape, img.size)

print(np.asarray(images).shape)
# images = [np.asarray(im) for im in images]

ipyplot.plot_class_tabs(images, ["t"]*2, max_imgs_per_tab=10, img_width=None, custom_texts=["d"]*2)

which just creates two random images and tries to display them with plot_class_tabs.
The error got is :

---------------------------------------------------------------------------
AttributeError                            Traceback (most recent call last)
Input In [73], in <module>
     17 print(np.asarray(images).shape)
     18 # images = [np.asarray(im) for im in images]
---> 20 ipyplot.plot_class_tabs(images, ["t"]*2, max_imgs_per_tab=10, img_width=None, custom_texts=["d"]*2)

File [...]/lib/python3.9/site-packages/ipyplot/_plotting.py:71, in plot_class_tabs(images, labels, custom_texts, max_imgs_per_tab, img_width, zoom_scale, force_b64, tabs_order)
     68 custom_texts = _np.asarray(custom_texts) if custom_texts is not None else custom_texts  # NOQA E501
     70 # run html helper function to generate html content
---> 71 html = _create_tabs(
     72     images=images,
     73     labels=labels,
     74     custom_texts=custom_texts,
     75     max_imgs_per_tab=max_imgs_per_tab,
     76     img_width=img_width,
     77     zoom_scale=zoom_scale,
     78     force_b64=force_b64,
     79     tabs_order=tabs_order)
     81 _display_html(html)

File [...]/lib/python3.9/site-packages/ipyplot/_html_helpers.py:130, in _create_tabs(images, labels, custom_texts, max_imgs_per_tab, img_width, zoom_scale, force_b64, tabs_order)
    127     active_tab = False
    129     tab_imgs_mask = labels == label
--> 130     html += _create_imgs_grid(
    131         images=images[tab_imgs_mask],
    132         labels=list(range(0, max_imgs_per_tab)),
    133         max_images=max_imgs_per_tab,
    134         img_width=img_width,
    135         zoom_scale=zoom_scale,
    136         custom_texts=custom_texts[tab_imgs_mask] if custom_texts is not None else None,  # NOQA E501
    137         force_b64=force_b64)
    139     html += '</div>'
    141 html += '</div>'

File [...]/lib/python3.9/site-packages/ipyplot/_html_helpers.py:359, in _create_imgs_grid(images, labels, custom_texts, max_images, img_width, zoom_scale, force_b64)
    356 html, grid_style_uuid = _get_default_style(img_width, zoom_scale)
    358 html += '<div id="ipyplot-imgs-container-div-%s">' % grid_style_uuid
--> 359 html += ''.join([
    360     _create_img(
    361         x, width=img_width, label=y,
    362         grid_style_uuid=grid_style_uuid,
    363         custom_text=text, force_b64=force_b64
    364     )
    365     for x, y, text in zip(
    366         images[:max_images], labels[:max_images],
    367         custom_texts[:max_images])
    368 ])
    369 html += '</div>'
    370 return html

File [...]/lib/python3.9/site-packages/ipyplot/_html_helpers.py:360, in <listcomp>(.0)
    356 html, grid_style_uuid = _get_default_style(img_width, zoom_scale)
    358 html += '<div id="ipyplot-imgs-container-div-%s">' % grid_style_uuid
    359 html += ''.join([
--> 360     _create_img(
    361         x, width=img_width, label=y,
    362         grid_style_uuid=grid_style_uuid,
    363         custom_text=text, force_b64=force_b64
    364     )
    365     for x, y, text in zip(
    366         images[:max_images], labels[:max_images],
    367         custom_texts[:max_images])
    368 ])
    369 html += '</div>'
    370 return html

File [...]/lib/python3.9/site-packages/ipyplot/_html_helpers.py:286, in _create_img(image, label, width, grid_style_uuid, custom_text, force_b64)
    283 # if image is not a string it means its either PIL.Image or np.ndarray
    284 # that's why it's necessary to use conversion to b64
    285 if use_b64:
--> 286     img_html += '<img src="data:image/png;base64,%s"/>' % _img_to_base64(image, width)  # NOQA E501
    288 html = """
    289 <div class="ipyplot-placeholder-div-%(0)s">
    290     <div id="ipyplot-content-div-%(0)s-%(1)s" class="ipyplot-content-div-%(0)s">
   (...)
    300 </div>
    301 """ % {'0': grid_style_uuid, '1': img_uuid, '2': label, '3': img_html}  # NOQA E501
    302 return html

File [...]/lib/python3.9/site-packages/ipyplot/_img_helpers.py:93, in _img_to_base64(image, target_width)
     91 # save image object to bytes stream
     92 output = io.BytesIO()
---> 93 image.save(output, format='PNG')
     94 # encode bytes as base64 string
     95 b64 = str(base64.b64encode(output.getvalue()).decode('utf-8'))

AttributeError: 'Array' object has no attribute 'save'

The reason for that is that I pass imageIO Arrays and not numpy arrays.
IF any of those is changed in the example:

  • set the same shape of all images (here set S1 = S2)
  • convert all the arrays to native numpys (here - uncomment # images = [np.asarray(im) for im in images])

Everything works.
I think the reason for that is that:

  1. There is a conversion of all the images to a single numpy array in
    return np.asarray(seq)
    that works differently for same-shape input - for same shape we get a nparray of [N,W,H,C], but for a different-shape we get a numpy array of [N,] with objects inside, and the objects aren't then converted to numpy arrays but remain imageIO Arrays.
  2. Some later code isn't checking the type in the right way:
    if type(image) is np.ndarray:
    - if we change type(img) == np.ndarray into isinstance(img, np.ndarray) - the subclass should be handled appropriately.

numpy 1.20+ does't have `np.float`

When trying basic: ipyplot.plot_images([np.array([1,2])]) I get:

AttributeError: module 'numpy' has no attribute 'float'

This is due to this depreciation.

Change background color

3 features that I wish you could implement so that I could stop forking your project:

  • For people like me using Jupyterlab in Dark mode the background color of the pics should be changed ideally automatically: -> 2 lines below to modify
div.ipyplot-content-div-%(0)s { (...) background: rgb(17, 17, 17); (...)}
#ipyplot-html-viewer-toggle-%(1)s:checked + #ipyplot-html-viewer-label-%(1)s:after {(...) background: rgb(17, 17, 17); (...)}
  • Option to not show the "Show HTML" link -> I just delete this line
    <label id="ipyplot-html-viewer-label-%(1)s" for="ipyplot-html-viewer-toggle-%(1)s">show html</label>

  • Option not to show Numbers on top of each pic -> I just delete this line
    <h4 style="font-size: 12px; word-wrap: break-word;">%(2)s</h4>

[Bug] Image resolution vs image width - blurry images when zoomed in

nice little program, but what I don't understand is whether it is intentional that the images become blurry/compressed when selecting small img_width. for instance, see here (all the way to the bottom): https://www.phenopype.org/gallery/example_1/

I would want the thumbnails to be small enough to display in a grid inside the cell, but when people click on them I'd expect the original resolution, not the specified display width of 300. am I misunderstanding something here?

Unable to open local image using url (local path).

I work on a shared GPU server (ubuntu). It seems I'm not able to open an image if it's in a folder like /data, or my colleague's workspace. I've tried converting the absolute path to relative paths, and it also doesn't work.

[Bug] Can't select text from a text field

This is a really useful tool - thanks for this @karolzak.
I'm currently using this to quickly visually review whether or not images are correctly categorised in my dataset, and need some way to note images that are incorrectly categorised.
At the moment I do this by manually typing in the label into an external application.
Is there a way to display the label as a text field, so that it can be easily copied and pasted? At the moment it's embedded as part of the image in the grid, and there's no way to isolate and copy the data as text.

Cannot display images from a full Windows path

Running in Windows 10
Jupyter in Chrome, launched from miniconda prompt
Code is in c:/eaf llc/aa-analytics and bi/ipyplot and that is where Jupyter is launched from
There is a subdirectory "samples" in the code directory, which contains images

If I specify the path like:

images = \
['c:/eaf llc/aa-analytics and bi/ipyplot/samples/cosine_loss.jpg',
 'c:/eaf llc/aa-analytics and bi/ipyplot/samples/crane_w_bucket.jpg',
 'c:/eaf llc/aa-analytics and bi/ipyplot/samples/CRISP-DM on Trello Example.jpg',
 'c:/eaf llc/aa-analytics and bi/ipyplot/samples/gans_for_good.jpg',
 'c:/eaf llc/aa-analytics and bi/ipyplot/samples/learned_optimizer.jpg',
 'c:/eaf llc/aa-analytics and bi/ipyplot/samples/LTC_half_cheetah_model.jpg',
 'c:/eaf llc/aa-analytics and bi/ipyplot/samples/MSI_algorithm.jpg',
 'c:/eaf llc/aa-analytics and bi/ipyplot/samples/neuroadaptation.jpg',
 'c:/eaf llc/aa-analytics and bi/ipyplot/samples/parametric_UMAP.jpg']

The images are not found by iplyplot

If I use:

images = \
['samples/cosine_loss.jpg',
 'samples/crane_w_bucket.jpg',
 'samples/CRISP-DM on Trello Example.jpg',
 'samples/gans_for_good.jpg',
 'samples/learned_optimizer.jpg',
 'samples/LTC_half_cheetah_model.jpg',
 'samples/MSI_algorithm.jpg',
 'samples/neuroadaptation.jpg',
 'samples/parametric_UMAP.jpg']

it works fine

[Bug] ipyplot breaks input() functionality in Jupyter Lab

Hey! First off I just wanted to thank you for building this tool, I've found it really useful for some exploratory work I've been doing.

That said, I just spent a few hours trying to solve an issue that ended up being due to something in the ipyplot implementation.

My Environment

Python 3.7.5
Jupyter Lab 2.2.4
Ubuntu 16.04 inside WSL 2 on Windows 10

The Issue

When running input() in a Jupyter cell, the text-entry box would fail to render, leaving the interpreter frozen waiting for a response and no place to enter it.

The Unexpected Solution

It seems this was tied in some way to how ipyplot modifies the HTML, as I found that simply deleting the cells in my notebook that had previously run ipyplot.plot_class_tabs() made the text entry box for input() suddenly appear. The impact of this was surprisingly expansive, as it would actually cause entirely separate notebooks to exhibit this issue. I figured it out when I saw that closing a notebook containing ipyplot code caused a separate, new notebook to all of a sudden work correctly.

Just wanted to post this here in case you know of a fix, and in case anybody else encounters this issue.

[Feature request] Inlining svg files

Hi,

Thanks for your work, your package is just super convenient to work with.

I wanted to suggest the possibility to authorize svg inlining inside the html. SVG is convenient for scientific visualization (as most figures created with matplotlib or Tickz are vectorized) and a good alternative to f_64 conversion that induced a loss of resolution in my case when resizing. Usual inclusion with relative or absolute path was also not convenient as i needed to share the notebook with collaborators, and sending them the figures separately created more problems than solutions.

It took me a few lines to add the functionality locally but i figured other people could have the same needs. I'd be happy to it send to you if you'd like.

Cheers,

Mikael

Google Colab Zoom in/out not working.

I am plotting an image grid of files from my google drive. However, when I double click an image to enlage (zoom) it, the Ipyplot tries to open it on https://localhost:8080/#ipyplot-content-div-gxxhDYw6uZPAFysCBXxHRa-KQknA24YyNKi4us9tmHekN but this page does not exist, then If I want to see the images, I have to run the cell again...

images_pil = [Image.open(image) for image in images]
ipyplot.plot_images(images_pil, labels, img_width=256, max_images=10, force_b64=True)

I even tried to solve it by making a refresh button like this:

import ipywidgets as widgets
from IPython.display import display
button = widgets.Button(description="Refresh Images")
output = widgets.Output()

def on_button_clicked(b):
  # Display the message within the output widget.
  with output:
    ipyplot.plot_images(images_pil, labels, img_width=256, max_images=10, force_b64=True)

button.on_click(on_button_clicked)
display(button, output)

Even though, after the link is open, the button disappears ๐Ÿ˜ข

Recommend Projects

  • React photo React

    A declarative, efficient, and flexible JavaScript library for building user interfaces.

  • Vue.js photo Vue.js

    ๐Ÿ–– Vue.js is a progressive, incrementally-adoptable JavaScript framework for building UI on the web.

  • Typescript photo Typescript

    TypeScript is a superset of JavaScript that compiles to clean JavaScript output.

  • TensorFlow photo TensorFlow

    An Open Source Machine Learning Framework for Everyone

  • Django photo Django

    The Web framework for perfectionists with deadlines.

  • D3 photo D3

    Bring data to life with SVG, Canvas and HTML. ๐Ÿ“Š๐Ÿ“ˆ๐ŸŽ‰

Recommend Topics

  • javascript

    JavaScript (JS) is a lightweight interpreted programming language with first-class functions.

  • web

    Some thing interesting about web. New door for the world.

  • server

    A server is a program made to process requests and deliver data to clients.

  • Machine learning

    Machine learning is a way of modeling and interpreting data that allows a piece of software to respond intelligently.

  • Game

    Some thing interesting about game, make everyone happy.

Recommend Org

  • Facebook photo Facebook

    We are working to build community through open source technology. NB: members must have two-factor auth.

  • Microsoft photo Microsoft

    Open source projects and samples from Microsoft.

  • Google photo Google

    Google โค๏ธ Open Source for everyone.

  • D3 photo D3

    Data-Driven Documents codes.