We’re right 50.75 percent of the time... but we’re 100 percent right 50.75 percent of the time, you can make billions that way.
--- Robert Mercer, co-CEO of Renaissance Technologies
If you trade a lot, you only need to be right 51 percent of the time, we need a smaller edge on each trade.
--- Elwyn Berlekamp, co-Founder of Combinatorial Game Theory
The quotes above come from a book by Gregory Zuckerman, a book every quant must read, THE MAN WHO SOLVED THE MARKET.
Most scripts inside this repository are technical indicator automated trading. These scripts include various types of momentum trading, opening range breakout and statistical arbitrage strategies. Yet, quantitative trading is not only about technical analysis. It can refer to computational finance to exploit derivative price mismatch, pattern recognition on alternative datasets to generate alphas or low latency order execution in the market microstructure. Hence, there are a few ongoing projects inside this repository. These projects are mostly quantamental analysis on some strange ideas I come up with to beat the market (or so I thought). There is no HFT strategy simply because ultra high frequency data are very expensive to acquire (even consider platforms like Quantopian or Quandl). Additionally, please note that, all scripts are historical data backtesting/forward testing (basically via Python, not C++, maybe Julia in the near future). The assumption is that all trades are frictionless. No slippage, no surcharge, no illiquidity.
-
Bloomberg/Eikon
MACD oscillator is trading strategy 101. MACD refers to Moving Average Convergence/Divergence. It is a momentum trading strategy which holds the belief that upward/downward momentum has more impact on short term moving average than long term moving average. It only takes 5 minutes for any bloke with no background in finance to trade with MACD signals. Regarding the simplicity of MACD oscillator, it is the most common strategy among the non-professionals in the market. In behavioral economics, the more people believe in the strategy, the more effective the strategy becomes (not always true, e.g. 2008). Therefore, we should not underestimate the power of MACD oscillator.
For the strategy itself, we compute long term moving average and short term moving average on the close price of a given stock. To generate the trading signal, we implement a comparison between the moving averages of different time horizons. When short term moving average is above long term moving average, we long the given stock accordingly. Vice versa.


Pair trading is the basic form of statistics arbitrage. It relies on the assumption that two cointegrated stocks would not drift too far away from each other. First step, we select two stocks and run Engle-Granger two step analysis. Once the criteria of cointegration is met, we standardize the residual and set one sigma away (two tailed) as the threshold. After that, we compute the current standardized residual of the selected stocks accordingly. When the standardized residual exceeds the threshold, it generates the trading signal. The simple rule is we always long the cheap stock and short the expensive stock.
The core idea of pair trading is cointegration. Metaphorically speaking, cointegration is like a couple in a clingy relationship where two parties are crazy-glued together. Yet, most relationships break sooner or later, and only the very few can make it to the marriage (from a statistics perspective, not being pessimistic). Hence, it is important to frequently check on the status quo of cointegration before any pair trading order execution (the same applies to relationships).


Heikin-Ashi, the exotic name actually referring to 'Average Bar' in Japanese, is an alternative style of candlestick chart. The sophisticated rules of Heiki-Ashi are designed to filter out the noise for momentum trading. Hence, Heikin-Ashi shows more consecutive bars in contrast to the standard candlestick, which makes price momentum and reverse points more distinguishable in figures. Arguably it should outperform the standard candlestick in sideways and choppy markets.
For the strategy itself, initially we make a few transformations on four vital benchmarks - Open, Close, High, Low. The next step is to apply unique Heikin-Ashi rules on Heikin-Ashi Open, Close, High, Low to generate trading signals. The downside of Heikin-Ashi (or any momentum trading strategies) is the slow response. Thus, we should set up the stop loss position accordingly so that we don't get caught up in any flash crash.
The rules of Heikin-Ashi can be found in Quantiacs.


To one of my favourite cities in the world! Proud to be a Londoner!
London Breakout is an intra daily opening range breakout strategy. Basically, it is a fascinating information arbitrage across different markets in different time zones. FX market runs 24/7 globally. For instance, you cannot long the stock of Ford in ASX simply because Ford is listed in NYSE. As FX market is decentralised, you can long any currency pair in any market as long as the market is open. That leaves a door to take a peek at the activity in a closed foreign FX market before the opening of domestic FX market.
Back to London Breakout, London and Tokyo are two of the largest FX markets in the world. Tokyo FX trading hour is GMT 0:00 a.m. - GMT 8:59am. London FX trading hour (no summer daylight saving) begins at GMT 8:00 a.m. Even though there is an hour of overlap, the crucial timeframe of London Breakout is GMT 7:00 a.m. - GMT 7:59 a.m. a.k.a. the last trading hour before the opening of London market. The price movement of the crucial timeframe incorporates the information of all the overnight activities of financial market (from the perspective of the current time zone).
For the strategy itself, we establish upper and lower thresholds prior to the high and low of the crucial timeframe. Once London FX market opens, we spend the first couple of minutes to check if the price would breach the preset boundaries. If it is above threshold, we long the currency pair accordingly. Vice versa. Nevertheless, we should set up a limit to prevent us from trading in the case of abnormal opening volatility. Normally, we clear our positions based on our target stop loss or stop profit respectively. By the end of the trading hour (still from the perspective of the current time zone), if there are any open positions, we clear them out.


Awesome oscillator is an upgraded version of MACD oscillator. It is one of those momentum strategies focusing on the game of moving average. Instead of taking simple moving average on close price, awesome moving average is derived from the mean of high and low price. Similar to MACD oscillator, it takes both short term and long term moving averages to construct the oscillator.
There are various strategies for awesome oscillator to generate signals, such as traditional moving average divergence, twin peaks and saucer. Twin peaks is just one of the many names of bottom W pattern. The pattern recognition will be covered in another chapter so the main focus of this chapter is saucer. Saucer is slightly more complex to implement than the traditional divergence. In return, saucer has the power to beat the slow response of the traditional divergence. Generally speaking, a faster response may sound awesome, but it does not guarantee a less risky outcome or a more profitable outcome. Hence, we will take MACD oscillator as a control group, to test if awesome oscillator can actually outperform MACD oscillator.
The rules of awesome oscillator could be found in TradingView.


This project is inspired by an article on oil-backed foreign exchange. Amid the bullish outlook for crude oil, the currency exchange of oil producing countries would also bounce back. Does this statement really hold?
According to the article by Bloomberg (or many other similar research), researchers examine the correlation between petrocurrency and oil price, instead of the causality. But correlation does not equal to causality. Correlation could be a coincidence of a math game. We simply cannot draw the conclusion that oil price moves the currency. Some researchers even use bootstrapping which greatly destroys the autocorrelation of a time series. Thus, it is vital to apply academic analysis and computer simulation on some petrocurrencies to test the causality of oil.
For more details, please refer to the read me page of a separate directory or quant trading section on my personal blog.

If you search dual thrust on google, you will end up with results of rocket engine. Don't panic yet, you can rest assured that dual thrust strategy is nowhere near rocket science. It is just an opening range breakout strategy developed by the founder of Universal Technical Systems. The mathematics involved in this strategy is merely primary school level.
Initially we establish upper and lower thresholds based on previous days' open, close, high and low. When the market opens and the price exceeds certain thresholds, we would take long/short positions prior to upper/lower thresholds. The strategy is quite useful in intra daily trading. However, there is no stop loss/profit position in this strategy. We reverse our positions when the price goes from one threshold to the other. We need to clear all positions by the end of the day.
Rules of dual thrust can be found in QuantConnect.

Parabolic SAR is an indicator to identify stop and reverse of a trend. Usually, Parabolic SAR is presented as dotted line either above or below the price in charts. When the price is an uptrend, SAR curve would sit below the price. When the price is downtrend, SAR curve would rise above the price. Parabolic SAR is always considered as a symbol of resistance to the price momentum. When SAR curve and the price curve cross over, it is when trade orders are supposed to be executed.
The building of this strategy seems very simple, but the construction of the indicator is extremely painful due to the involvement of recursive calculation. Illustration on how to compute Parabolic SAR can be found in Wikipedia but it is not very well explained. To get a clear idea of the calculation, my personal recommendation is to take a look at the spreadsheet made by joeu2004.
It is worth mentioning that SAR and RSI (which will be featured in a later chapter) shares the same founder, Welles Wilder. The guy is a real legend who used to work as mechanical engineer and real estate developer and later became a technical analyst. His book on technical trading system is a must-read for anyone that wants to elevate quant trading system to the next level.

Bollinger Bands is a very simple but powerful indicator. There are three bands of this indicator. The mid band is the moving average on the price series (usually takes 20 lags). The upper and lower bands are two moving standard deviations away from the mid band. Bollinger Bands can be used to test for various types of strategies.
For volatility trading, contraction and expansion of the band width are crucial elements. Any distinct momentum clustering (it can take form of either upward or downward) would result in a Bollinger Bands expansion. And the oscillation in a horizontal channel would result in a Bollinger Bands contraction.
For momentum trading, the phenomenon of 'walking the band' indicates the resistance and support level of the underlying asset. In a strong trend, the price constantly attempts to touch or break through the upper/lower band along with Bollinger Bands moving towards the same direction.
For pattern recognition, Bollinger Bands has the capability of testing bottom W, top M, head-shoulder patterns, etc. With upper and lower bands served as an interval, it is easier to identify the hidden pattern in the historical data.
More details of Bollinger Bands can be found in TradingView.

RSI (Relative Strength Index) is also a popular indicator. It reflects the current strength/weakness of the stock price momentum. The calculation is pretty straight forward. We use 14 days of smoothed moving average (or other moving average methods) to separately calculate the intra daily uptrend and downtrend. We denote uptrend moving average divided by downtrend moving average as the relative strength. We normalize the relative strength by 100 which becomes an index called RSI. It is commonly believed that RSI above 70 is overbought and RSI below 30 is oversold. This is the simplest way to trade on RSI (as shown in the pictures below). Nonetheless, there could be divergence between RSI momentum and price momentum which will not be covered in the script. The effectiveness of any divergence strategy on RSI is rather debatable.


If you are looking for something slightly more complex, well, we can apply pattern recognition technique to RSI as well. Unlike strategy No.9 Bollinger Bands, we can directly look at the patterns of RSI itself instead of the price. Since we have tested double bottom pattern in Bollinger Bands, we would test head-shoulder pattern on RSI this time.
For details of head-shoulder pattern, please refer to Investopedia.


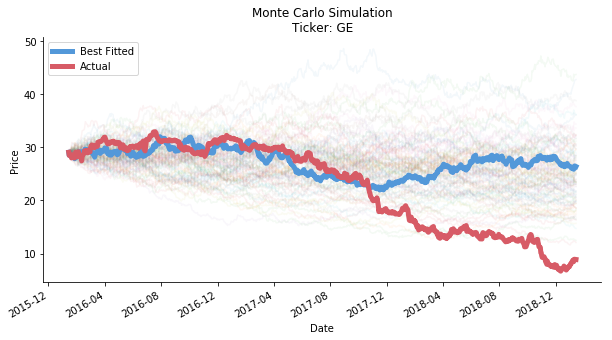
Monte Carlo, my first thought on these two words is the grand casino, where you meet Famke Janssen in tuxedo and introduce yourself, 'Bond, James Bond'. Indeed, the simulation is named after the infamous casino. It actually refers to the computer simulation of massive amount of random events. This unconventional mathematical method is extremely powerful in the study of stochastic process.
Here comes the argument on Linkedin that caught my eyes the other day. "Stock price can be seemed as a Wiener Process. Hence, we can use Monte Carlo simulation to predict the stock price." said a data science blog. Well, in order to be a Wiener Process, we have to assume the stock price is continuous in time. In reality, the market closes. The overnight volatility exists. But that is not the biggest issue here. The biggest issue is, can we really use Monte Carlo simulation to predict the stock price, even a range or its direction?
For more details, please refer to the read me page of a separate directory or quant trading section on my personal blog.
Here marks the debut of options strategy in this repository. Straddle refers to the shape of compasses in the payoff diagram of the strategy. A long straddle involves buying a call option and a put option at the same strike price, the same expiration date and preferably the same price. In reality, the same price is not always feasible (call options price higher implies higher upside risk, vice versa). It is recommended to trade when the price disparity between call and put options is converging.
Long straddle is commonly seen in event driven strategy, e.g. political referendum, company earning release. It profits from the uncertainty of both-side risk. For upside risk, the potential profit is unlimited. The potential loss does not come from the downside risk (there is limited gain from downside risk). Instead, it comes from the stagnant price due to insufficient volatility. In this case, short straddle is more suitable for sideways choppy market.
The crucial element of options straddle is the selection of the strike price. As the price of options contains the market consensus, the only way to maximize the profit is to find the optimal strike price to shrink the loss bandwidth. This is where the economists kick in and offer base case outlook plus best/worst scenarios. In contrast to the common misunderstanding of quantitative trading, Option Greeks are no silver bullet. Quantitative combined with fundamental in one, so-called quantamental, makes the portfolio impeccable.

Modern portfolio theory was introduced in 1952 by Nobel laureate Harry Markowitz. It is part of investment class 101. But I watched a video by Wolfram recently. It challenged the traditional approach and introduced graph theory to asset diversification. There are plenty of quant shops deploying fancy mathematic tools to solve the market. The real question for us is, as fancy as it sounds, does graph theory work on portfolio optimization?

This project is documented in the repository of Graph Theory. For more details, please refer to the read me page of a separate directory or graph theory section on my personal blog.


