GithubHelp home page GithubHelp logo

kubeshop / tracetest Goto Github PK

View Code? Open in Web Editor NEW
995.0 15.0 70.0 181.84 MB

🔭 Tracetest - Build integration and end-to-end tests in minutes, instead of days, using OpenTelemetry and trace-based testing.

Home Page: https://docs.tracetest.io/

License: Other

HTML 0.11% TypeScript 40.17% Makefile 0.28% Dockerfile 0.02% Go 57.92% JavaScript 0.33% Less 0.02% Shell 0.45% PLpgSQL 0.56% PowerShell 0.05% Smarty 0.06% CSS 0.03%
integration-testing microservices opentelemetry testing tracing tracetest

tracetest's Introduction

Tracetest Logo


Build integration and end-to-end tests in minutes, instead of days, using OpenTelemetry and trace-based testing.

Get Started!  👉 

Docs |  Tutorials |  Recipes |  Examples |  Slack |  Blog |  Website

Tracetest lets you build integration and end-to-end tests 98% faster with distributed traces.

No plumbing, no mocks, no fakes. Test against real data.

You can:

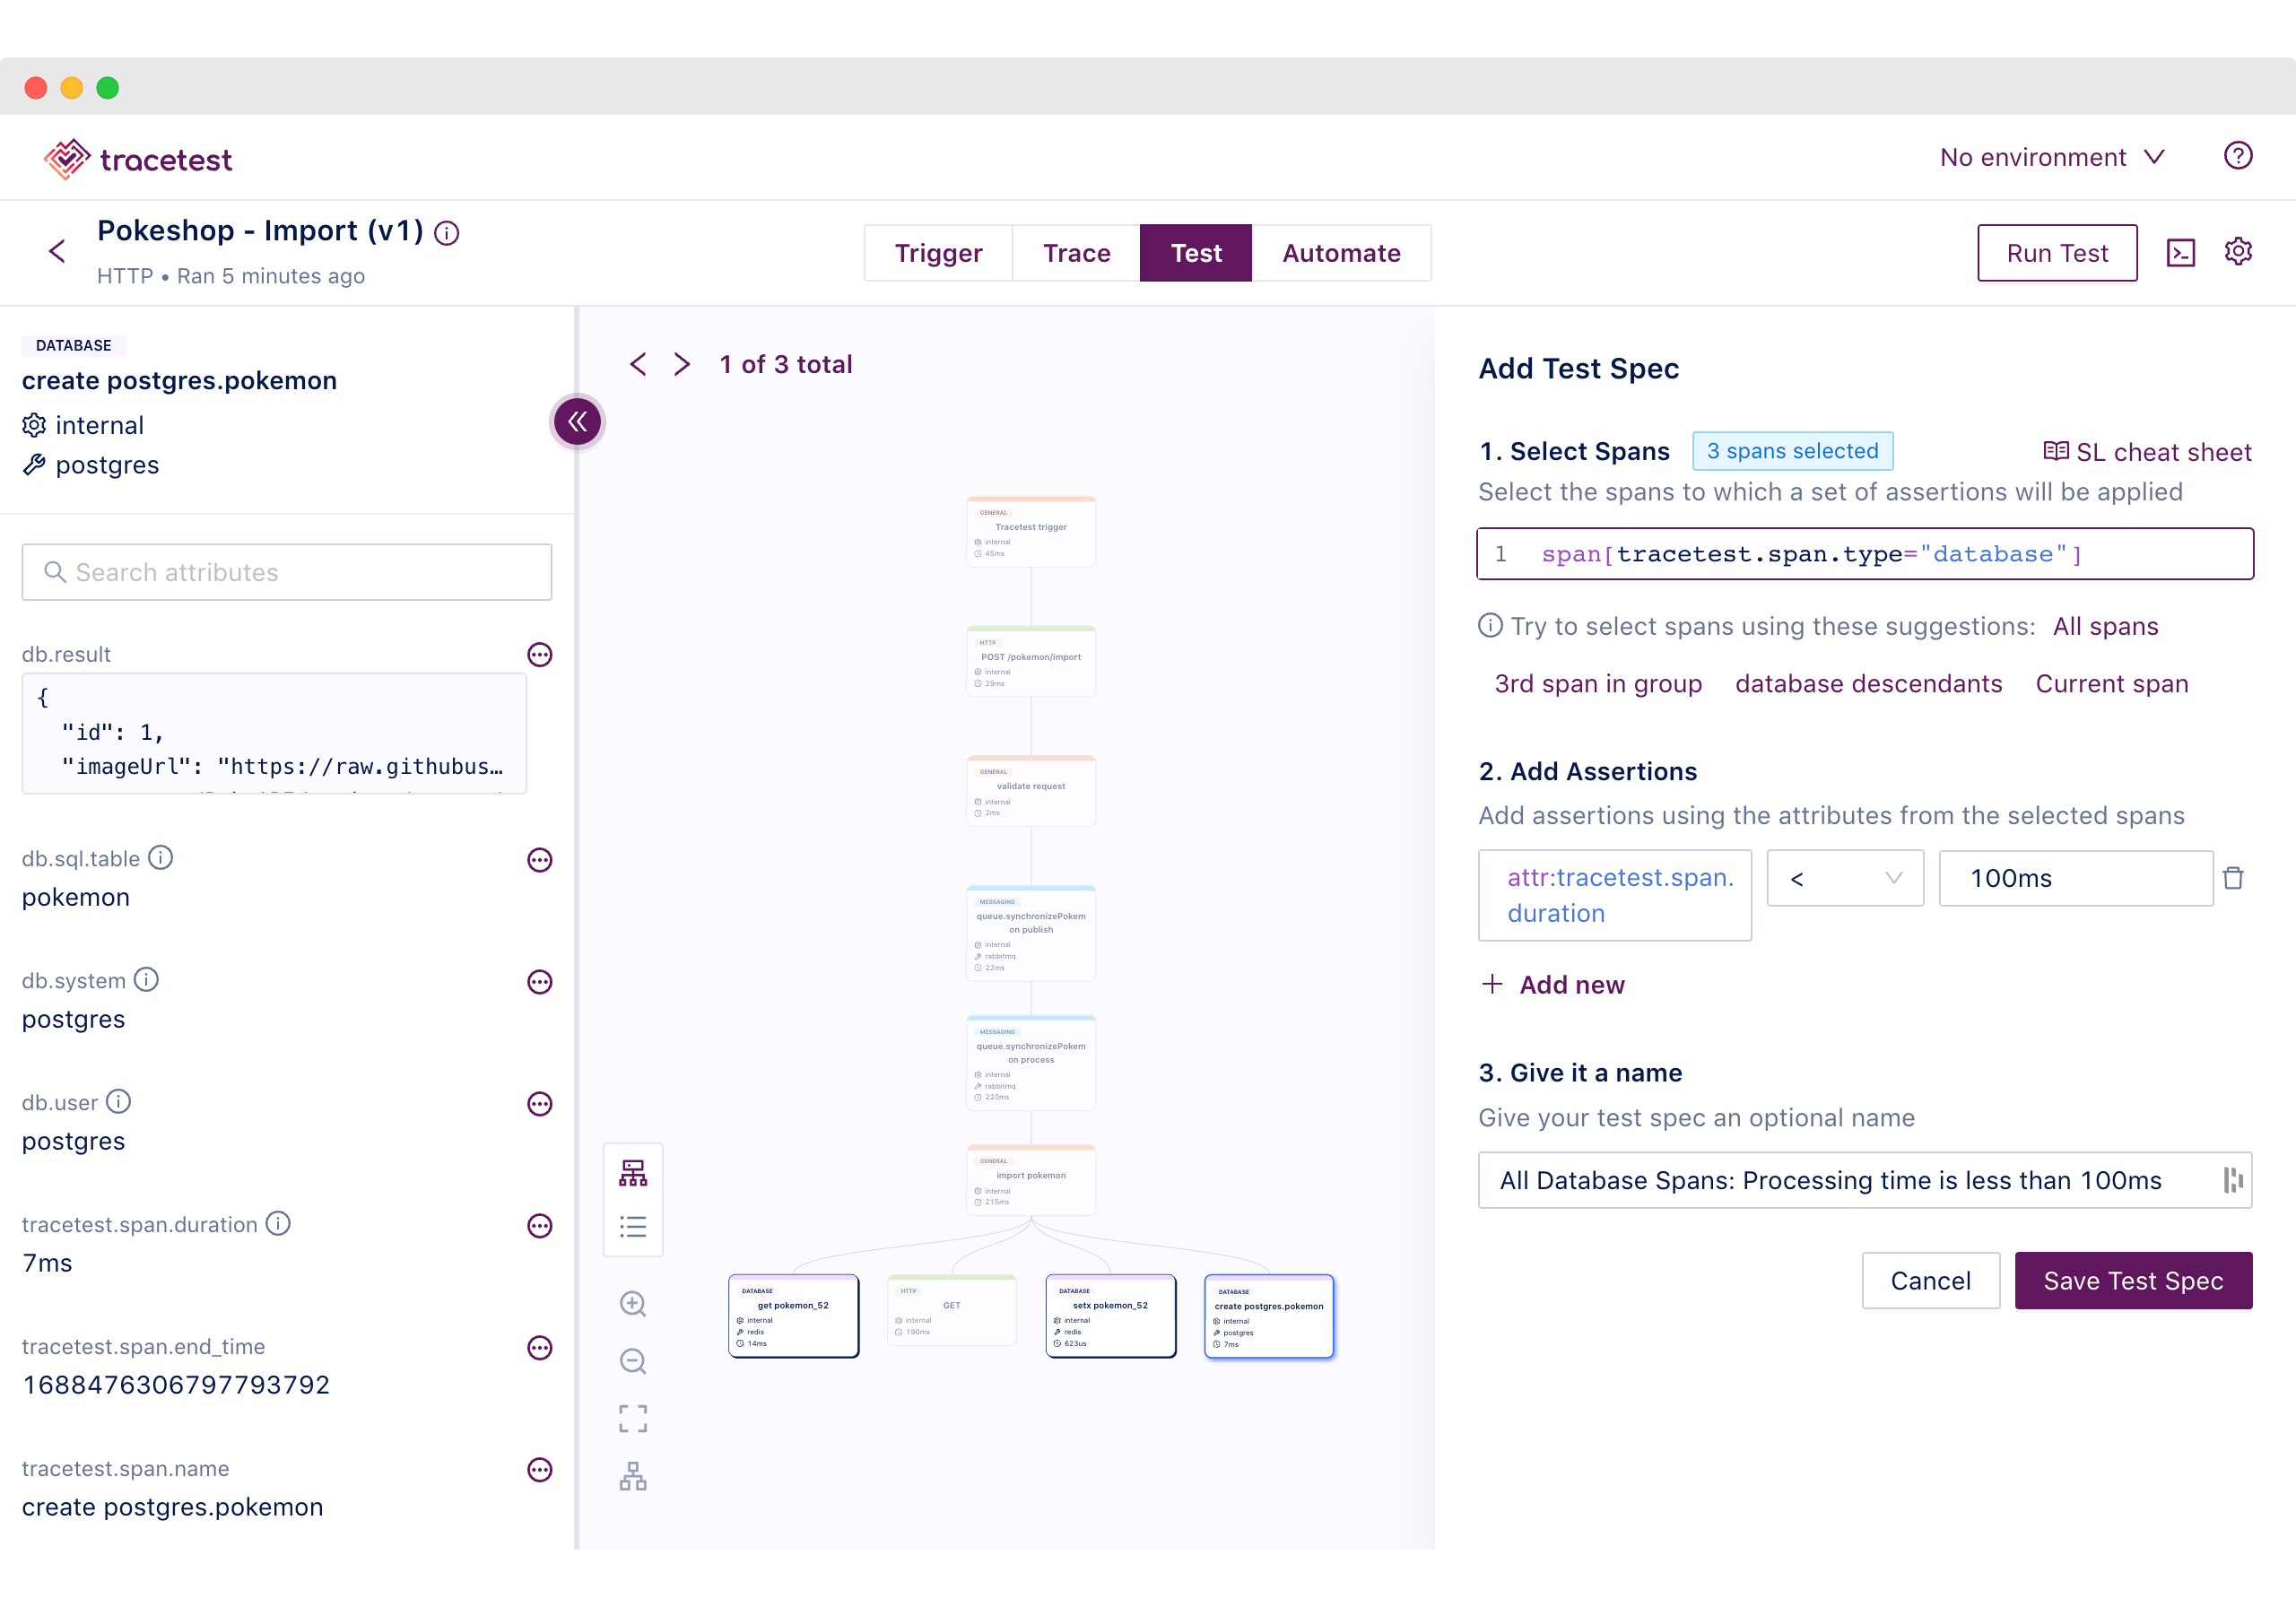
  • Assert against both the response and trace data at every point of a request transaction.
  • Assert on the timing of trace spans.
    • Eg. A database span executes within 100ms.
  • Wildcard assertions across common types of activities.
    • Eg. All gRPC return codes should be 0.
    • Eg. All database calls should happen in less than 100ms.
  • Assert against side-effects in your distributed system.
    • Eg. Message queues, async API calls, external APIs, etc.
  • Integrate with your existing distributed tracing solution.
  • Define multiple test triggers:
    • HTTP requests
    • gRPC requests
    • Trace IDs
    • and many more...
  • Save and run tests manually and via CI build jobs.
  • Verify and analyze the quality of your OpenTelemetry instrumentation to enforce rules and standards.
  • Test long-running processes.

Build tests in minutes.

  • Visually - in the Web UI

  • Programmatically - in YAML

    type: Test
    spec:
      id: Yg9sN-94g
      name: Pokeshop - Import
      description: Import a Pokemon
      trigger:
        type: http
        httpRequest:
          url: http://demo-api:8081/pokemon/import
          method: POST
          headers:
          - key: Content-Type
            value: application/json
          body: '{"id":52}'
      specs:
      - name: 'All Database Spans: Processing time is less than 100ms'
        selector: span[tracetest.span.type="database"]
        assertions:
        - attr:tracetest.span.duration < 100ms

🚀 Getting Started

Click on the image or this link to watch the "Tracetest Intro Video" video (< 2 minutes)

Cloud-based Managed Tracetest (Free to get started!)

The easiest and most reliable way to test microservices and distributed apps with OpenTelemetry distributed traces is signing up for free at app.tracetest.io. After creating an account, getting started is as easy as installing the Tracetest Agent.

Enterprise Self-hosted Tracetest (Coming soon...)

Get the same experience as with the Cloud-based Managed Tracetest but self-hosted in your own infrastructure. Book a call to get into early access.

Hobby Self-hosted Open-source Tracetest Core

Deploy a hobby self-hosted instance of Tracetest Core as a Docker container. It's not suitable for production, but a great way to start using Tracetest Core in local environments.

1️⃣ Install the Tracetest CLI

curl -L https://raw.githubusercontent.com/kubeshop/tracetest/main/install-cli.sh | bash -s

⚙️ Read the CLI installation docs for more options and instructions.

2️⃣ Install the Tracetest Server

tracetest server install

This command will launch an install wizard that automatically installs Tracetest and a sample Pokeshop Demo app into either Docker or Kubernetes based on your selection.

Or, install Tracetest with Helm. The Tracetest Helm charts are located here.

helm install tracetest kubeshop/tracetest --namespace=tracetest --create-namespace

⚙️ Read the Server installation docs for more options and instructions.

3️⃣ Open Tracetest

Once you've installed Tracetest Server, access the Tracetest Web UI on http://localhost:11633.

Check out the Opening Tracetest guide to start creating and running tests!

🔥 Features

  • Works out of the box with your existing OpenTelemetry instrumentation, supporting numerous trace data stores, including:
    • Jeager
    • Grafana Tempo
    • OpenSearch
    • Elastic
    • And, many more...
    • Tell us which other trace data stores you want supported!
  • Works out of the box by adding Tracetest as an additional pipeline via your OpenTelemetry Collector config.
  • Supporting multiple ways of creating a test, including HTTP, GRPC and Postman Collections.
  • Visualize the changes you are making to your trace as you develop, enabling Observability-Driven Development.
  • Add assertions based on response data from the trigger request and all trace data contained in the spans of your distributed trace.
  • Specify which spans to check in assertions via the selector language.
  • Define checks against the attributes in these spans, including properties, return status, or timing.
  • Create tests visually in the Tracetest Web UI or programatically via YAML-based test definition files.
  • Use test definition files and the Tracetest CLI to enable Gitops flows and CI/CD automation.
  • Tracetest CLI allows importing & exporting tests, running tests, and more.
  • Version tests as the definition of the test is altered.
  • The guided install can include an example "Pokeshop" microservice that is instrumented with OpenTelemetry to use as an example application under test.
  • Create environment variables to assert the same behavior across multiple environments (dev, staging, and production, for example)
  • Create test outputs by defining a variable based on the information contained in a particular span's attributes.
  • Run ad-hoc tests by using undefined variables to enable supplying variables at runtime.
  • Define test suites/transactions to chain tests together and use variables obtained from a test in a subsequent test. These variables can also be loaded from the environment.
  • Run comprehensive trace analysis and validation to adhere to OpenTelemetry rules and standards.
  • Configure test runner behavior with required gates used when executing your tests to determine whether to mark the test as passed or failed.

🤔 How does Tracetest work?

  1. Pick an endpoint to test.
  2. Run a test, and get the trace.
  3. The trace is the blueprint of your system under test. It shows all the steps the system has taken to execute the request.
  4. Use this blueprint to define assertions in the Tracetest Web UI.
  5. Add assertions on different services, checking return statuses, data, or even execution times of a system.
  6. Run the tests.

Once the test is built, it can be run automatically as part of a build process. Every test has a trace attached, allowing you to immediately see what worked, and what did not, reducing the need to reproduce the problem to see the underlying issue.

📂 What does the test definition file look like?

The Tracetest test definition files are written in a simple YAML format. You can write them directly or build them graphically via the UI. Here is an example of a test which:

  • Executes POST against the pokemon/import endpoint.
  • Verifies that the HTTP blocks return a 200 status code.
  • Verifies all database calls execute in less than 50ms.
type: Test
spec:
  id: 5dd03dda-fad2-49f0-b9d9-5143b746c1d0
  name: DEMO Pokemon - Import - Import a Pokemon
  description: "Import a pokemon"

  # Configure how tracetest triggers the operation on your application
  # triggers can be http, grpc, etc
  trigger:
      type: http
      httpRequest:
          method: POST
          url: http://demo-pokemon-api.demo.svc.cluster.local/pokemon/import
          headers:
              - key: Content-Type
                value: application/json
          body: '{"id":52}'

  # Definition of the test specs which is a combination of a selector
  # and an assertion
  specs:
      # the selector defines which spans will be targeted by the assertions
      selector: span[tracetest.span.type = "http"]
      # the assertions define the checks to be run. In this case, all
      # http spans will be checked for a status code = 200
      - assertions:
          - http.status_code = 200
      # this next test ensures all the database spans execute in less
      # than 50 ms
      selector: span[tracetest.span.type = "database"]
      - assertions:
          - tracetest.span.duration < "50ms"

🤖 How to run an automated test?

Save a test definition file above as pokeshop_import.yaml. Use the CLI to run a test.

tracetest run test --file /path/to/pokeshop_import.yaml

Check out the CI/CD docs to learn more about test automation.

🧪 Tests

We strive to produce quality code and improve Tracetest rapidly and safely. Therefore, we have a full suite of both front-end and back-end tests. Cypress tests are running against the front-end code and (surprise, surprise) Tracetest against the back-end code. You can see the test runs here, and a blog post describing our testing pipelines here.

🎤 Feedback

Have an idea to improve Tracetest?

You can:

🌱 Contributing & Community

Whether it's big or small, we love contributions.

Not sure where to get started? You can:

tracetest's People

Contributors

aabedraba avatar abangser avatar adnanrahic avatar agardnerit avatar alayshia avatar alexchadwickp avatar carehart avatar cescoferraro avatar danielbdias avatar dependabot[bot] avatar dimonlex avatar jasmingacic avatar javaducky avatar jfermi avatar jorgeepc avatar kdhamric avatar lokeshk307 avatar maheshkasabe avatar mathnogueira avatar michaelhyatt avatar mortada-codes avatar olange avatar povilasv avatar schoren avatar xoscar avatar yllek avatar

Stargazers

 avatar  avatar  avatar  avatar  avatar  avatar  avatar  avatar  avatar  avatar  avatar  avatar  avatar  avatar  avatar  avatar  avatar  avatar  avatar  avatar  avatar  avatar  avatar  avatar  avatar  avatar  avatar  avatar  avatar  avatar  avatar  avatar  avatar  avatar  avatar  avatar  avatar  avatar  avatar  avatar  avatar  avatar  avatar  avatar  avatar  avatar  avatar  avatar  avatar  avatar  avatar  avatar  avatar  avatar  avatar  avatar  avatar  avatar  avatar  avatar  avatar  avatar  avatar  avatar  avatar  avatar  avatar  avatar  avatar  avatar  avatar  avatar  avatar  avatar  avatar  avatar  avatar  avatar  avatar  avatar  avatar  avatar  avatar  avatar  avatar  avatar  avatar  avatar  avatar  avatar  avatar  avatar  avatar  avatar  avatar  avatar  avatar  avatar  avatar  avatar

Watchers

 avatar  avatar  avatar  avatar  avatar  avatar  avatar  avatar  avatar  avatar  avatar  avatar  avatar  avatar

tracetest's Issues

Missing trace error handling

Sometime system under test fails to produce a trace due to various reasons.

How do we handle this case?

Example, app failed to send trace to otel collector:


2022/03/01 10:07:50 http: panic serving 10.42.0.25:44246: rpc error: code = Unavailable desc = error reading from server: EOF
goroutine 188 [running]:
net/http.(*conn).serve.func1(0xc0005000a0)
        /usr/local/go/src/net/http/server.go:1801 +0x147
panic(0xa5e6a0, 0xc000010020)
        /usr/local/go/src/runtime/panic.go:975 +0x47a
go.opentelemetry.io/otel/sdk/trace.(*recordingSpan).End(0xc000702900, 0x0, 0x0, 0x0)
        /go/pkg/mod/go.opentelemetry.io/otel/[email protected]/trace/span.go:282 +0x345
panic(0xa5e6a0, 0xc000010020)
        /usr/local/go/src/runtime/panic.go:969 +0x1b9
go.opentelemetry.io/otel/sdk/trace.(*recordingSpan).End(0xc000280900, 0x0, 0x0, 0x0)
        /go/pkg/mod/go.opentelemetry.io/otel/[email protected]/trace/span.go:282 +0x345
panic(0xa5e6a0, 0xc000010020)
        /usr/local/go/src/runtime/panic.go:975 +0x47a
main.(*povService).httpHandler(0xc0001c9440, 0xbd23e0, 0xc00048b740, 0xc000594500)
        /src/main.go:85 +0xceb
net/http.HandlerFunc.ServeHTTP(0xc0003a0b90, 0xbd23e0, 0xc00048b740, 0xc000594500)
        /usr/local/go/src/net/http/server.go:2042 +0x44
go.opentelemetry.io/contrib/instrumentation/net/http/otelhttp.(*Handler).ServeHTTP(0xc0001ccdc0, 0xbd23e0, 0xc00048b740, 0xc000594000)
        /go/pkg/mod/go.opentelemetry.io/contrib/instrumentation/net/http/[email protected]/handler.go:189 +0x977
net/http.(*ServeMux).ServeHTTP(0xf8fc40, 0xbd15e0, 0xc00043c000, 0xc000594000)
        /usr/local/go/src/net/http/server.go:2417 +0x1ad
net/http.serverHandler.ServeHTTP(0xc0003e0000, 0xbd15e0, 0xc00043c000, 0xc000594000)
        /usr/local/go/src/net/http/server.go:2843 +0xa3
net/http.(*conn).serve(0xc0005000a0, 0xbd2ce0, 0xc000400040)
        /usr/local/go/src/net/http/server.go:1925 +0x8ad
created by net/http.(*Server).Serve
        /usr/local/go/src/net/http/server.go:2969 +0x36c

Add a state of the current test run to the test result screen next to any test result

As a User,
I want to be able to look at a test run either on the list of test runs or when viewing one single test run result and see the state of the system
so that I can tell if a test is still being executed, waiting on the trace, finished, errored out, etc.

The states are documented on #125, we need to update both the backend and front end to update the state at the appropriate time and to change the UI so it shows the current state next to any test run result.

@olha23 I added some user stories to our spreadsheet under 'List of test results' to state the information that should be displayed for this list.

Trace endpoints

  • GET - fetch all or single trace

From Miro MVP:

Backend to filter our traces from stream of traces, store the traces, and enable above UI functionality

@kdhamric can you chime on this. I remember we talked about this and we decided to get traces from Jeager

Polish UI for MVP release

Create mocks for changes we want to the UI for the MVP

  • Add header with text logo
  • match colors in DAG & timeline
  • add link to github, docs, discord

Add a table for test assertion definitions

@mortada-codes I cannot remember what this is for... can you help me by writing the description?
the defined test assertions table: contains a list of the created assertion. it shows the items selectors, property name, compare operator and compare value.
Also, it shows the effected spans count

UX defined in #128

[UI] Trace Diagram Tools

Adding zoom in/out buttons
Adding trace nodes search bar
Adding recenter camera projection button

Define the UI for the global assertion table

The assertion table showing all the assertions (ie selectorItems & checks against them) should be moved so it is not presented in the same screen as the 'span detail' as these assertions impact the entire test and are defined at the test level.

I would suggest possibly allowing this assertion table to be presented in both a collapsed and an expanded mode. The collapsed mode would show minimal summary information, perhaps:
The 3 assertions ran 49 checks, 30 passed, 19 failed.

Expanding the table would show the full list of assertions with summary of passed/failed tests for each verification under each assertion.

list test assertions

List the test assertion definitions showing the span selectors and the tests against them.

Results endpoints

Result object should contain

  • a particular test result
  • showing the calling transaction,
  • response,
  • trace,
  • and which assertions passed/failed

Need to define which resource attributes are needed and add them to the ItemSelectors

what is the item selector?

It is a group of attributes that has a constant values. its value is never change even if the service under test is working incorrectly.

how do we generate item selectors

currently, we use a list of defined attributes in tracerest/web/src/lib/SelectorDefaultAttributes.ts to generate the item selector by looking for span attributes that match the attributes in the SelectorDefaultAttributes.ts

what is the resource attribute?

https://github.com/open-telemetry/opentelemetry-specification/blob/main/specification/resource/semantic_conventions/README.md

what do we need?

we want to define a list of resource attributes that can be used as a part of item selector

Feature: Selector adapter

At the moment I'm adding implementation for JMESpath selector.
Thanks to @kdhamric we have a functional query to test with.

resourceSpans[?instrumentationLibrarySpans[?spans[?attributes[?key=='http.method'&& value.stringValue=='GET']]] && resource.attributes[?key=='service.name' && value.stringValue=='pov-client']]

The question is how in the UI section we are going to construct the query. To translate this into "english" I would describe the query as:

  1. find all resourceSpans resourceSpans[
  2. whose instrumentationLibrarySpans ?instrumentationLibrarySpans[
  3. contain spans ?spans[?attributes[?key=='http.method'&& value.stringValue=='GET']]]
  4. whose attributes have values key=='http.method'&& value.stringValue=='GET'
  5. and && instrumentationLibrarySpans' resources that have attributes with values ?key=='service.name' && value.stringValue=='pov-client'

//cc @mortada-codes does this make any sense?

Recommend Projects

  • React photo React

    A declarative, efficient, and flexible JavaScript library for building user interfaces.

  • Vue.js photo Vue.js

    🖖 Vue.js is a progressive, incrementally-adoptable JavaScript framework for building UI on the web.

  • Typescript photo Typescript

    TypeScript is a superset of JavaScript that compiles to clean JavaScript output.

  • TensorFlow photo TensorFlow

    An Open Source Machine Learning Framework for Everyone

  • Django photo Django

    The Web framework for perfectionists with deadlines.

  • D3 photo D3

    Bring data to life with SVG, Canvas and HTML. 📊📈🎉

Recommend Topics

  • javascript

    JavaScript (JS) is a lightweight interpreted programming language with first-class functions.

  • web

    Some thing interesting about web. New door for the world.

  • server

    A server is a program made to process requests and deliver data to clients.

  • Machine learning

    Machine learning is a way of modeling and interpreting data that allows a piece of software to respond intelligently.

  • Game

    Some thing interesting about game, make everyone happy.

Recommend Org

  • Facebook photo Facebook

    We are working to build community through open source technology. NB: members must have two-factor auth.

  • Microsoft photo Microsoft

    Open source projects and samples from Microsoft.

  • Google photo Google

    Google ❤️ Open Source for everyone.

  • D3 photo D3

    Data-Driven Documents codes.