Modified from hexo-charts
Modified from hexo-statistics-charts
- 页面文案调整回中文
- 删除类别统计图表的标题
将 hexo poats、类别和标签的统计数据呈现到图表中。
灵感来自 HEXO 主题 matery.
-
包含
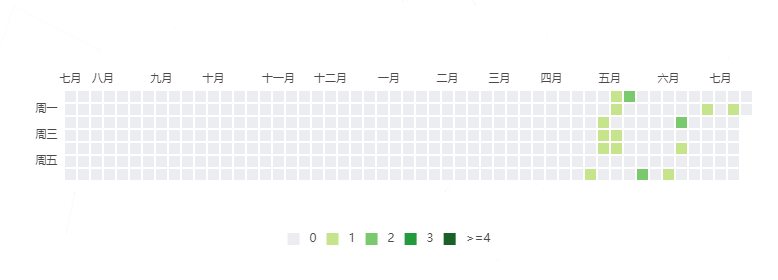
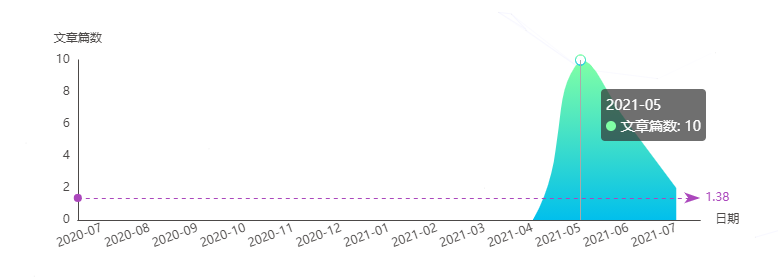
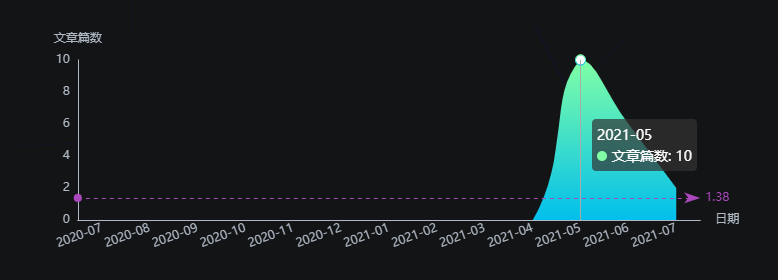
- 发布统计
- 发布日历
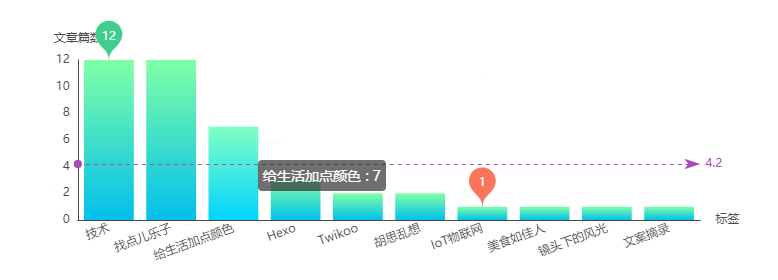
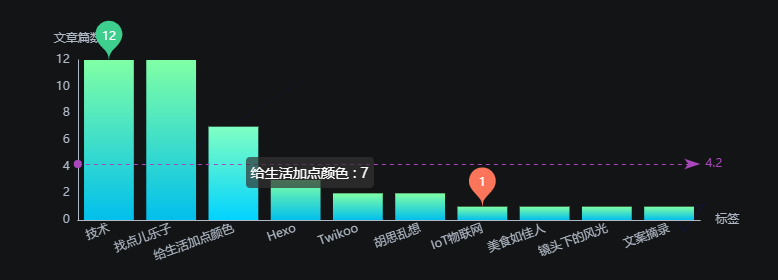
- 标签统计
- 分类统计
- 分类雷达图
-
更新日志
点击展开 v1.1.6
* 字体、标题与图表区域间隔等视觉样式微调;* 文章发布日历,绘图区域未居中修正;
点击展开 v1.1.5
* 插件默认 `echarts_CDN` 修改为:`https://lib.baomitu.com/echarts/4.7.0/echarts.min.js`* 新增配置项:`echarts_CDN` 解决原来使用的固定 CDN 资源失效问题。使用方法:
```yml # 统计图表,支持发布文章统计、发布日历、Top标签统计、分类统计、分类雷达。
# see https://www.npmjs.com/package/hexo-butterfly-charts
charts:
enable: true # 是否启用功能
postsChart:
title: 文章发布统计 # 设置文章发布统计的标题,默认为空
interval: 1 # 横坐标间隔
tagsChart:
title: Top 10 标签统计 # 设置标签统计的标题,默认为空
interval: 1 # 横坐标间隔
postsCalendar_title: 文章发布日历 # 设置发布日历的标题,默认为空
categoriesChart_title: # 设置分类统计的标题,默认为空
categoriesRadar_title: # 设置分类雷达的标题,默认为空
+ echarts_CDN: # https://lib.baomitu.com/echarts/4.7.0/echarts.min.js
```
点击展开 v1.1.4
* 更新 moment 到 2.29.4点击展开 v1.1.2
* 调整分类统计图中,“# 文章分类”为 “✒️文章篇数”点击展开 v1.1.1
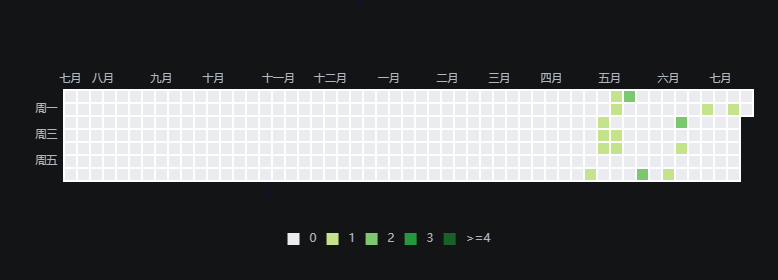
* 增加标签的横纵坐标轴名称* 适配butterfly暗色模式,自动切换
* 文章发布日历坐标也换成中文
* 各图表标题支持配置
* 标签/分类统计图支持配置横坐标显示的间隔数
* 解决分类雷达图未设置画布高度的bug
Bug:
* 解决雷达图上,鼠标hover时,超出内容被画布吞掉的问题
示例 Demo
- 发布日历
- 发布统计
- 标签统计
- 分类统计(无标题)/分类雷达图(无标题)

- 分类雷达图(无标题)

点击查看暗色模式截图
- 发布日历
- 发布统计
- 标签统计
- 分类统计(无标题)/分类雷达图(无标题)

- 分类雷达图(无标题)

npm install hexo-butterfly-charts --save![dependabot[bot] avatar](https://avatars.githubusercontent.com/in/29110?v=4 "dependabot[bot]")


