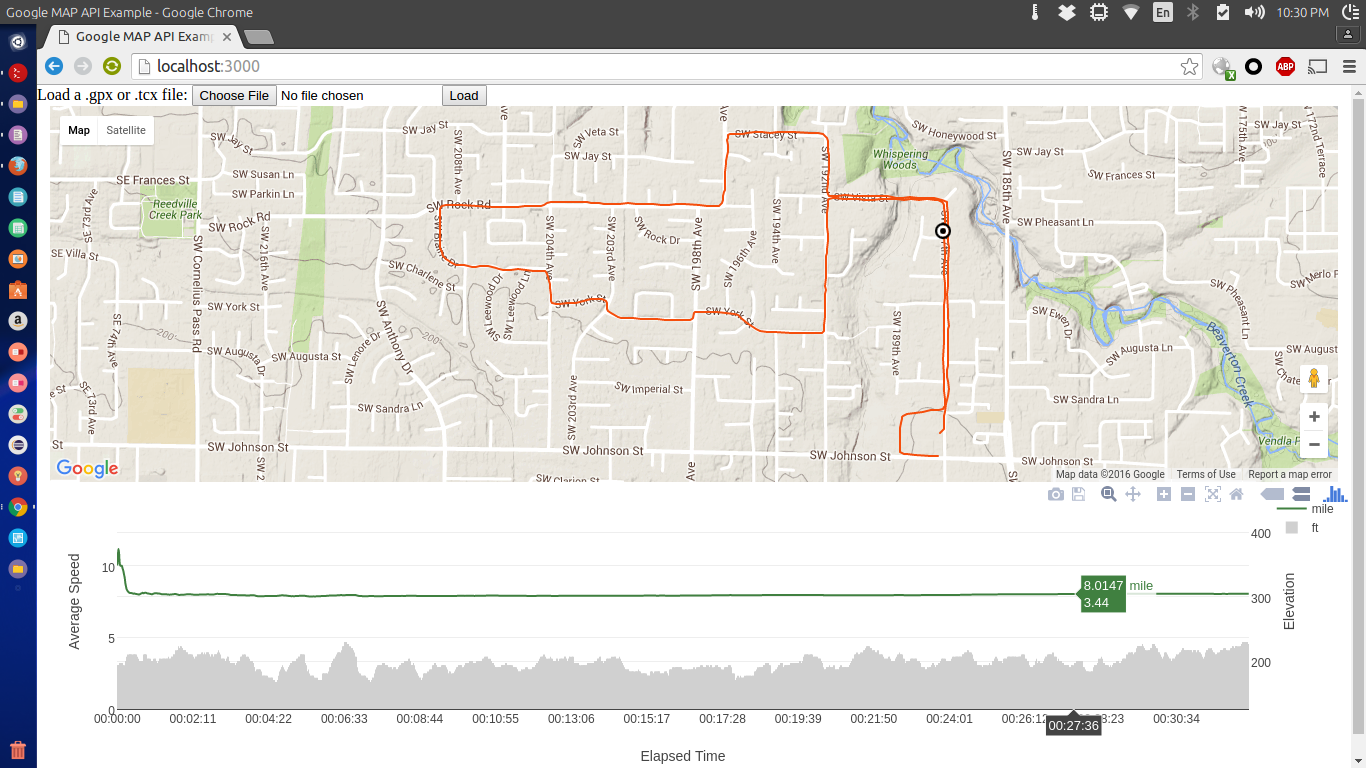
Node.js Express framework serving a page that uses the Google Map API to plot the coordinates of an uploaded .gpx or .tcx file, and plotly.js to trace distance, elevation (and pace). Mousing over the plotly.js graph moves a cursor on the map above, indicating its GPS coordinates.
When a .tcx or .gpx file is uploaded, Node.js executes the perl script coords.pl which extracts latitude/longitude, elevation, and timestamp information from the .gpx/.tcx XML, generates a JSON file, and uploads it to the server for use in map and plot generation. A running pace was calculated and inserted into the JSON in an earlier branch (see green line in screenshot above), but it was not a very telling data-point (the pace just stabilized less than halfway into a run, with little indication of real-time speed increase/decrease): this would need to be tweaked for accuracy (a moving-window average based on the previous 10 or so seconds is how I imagine it's handled in most devices), and anyway (at least with the GPS watch that I have), pace data is stored along with HR and cadence in .csv file separate from the GPS data.