![]()
LineUp is an interactive technique designed to create, visualize and explore rankings of items based on a set of heterogeneous attributes. This is a HTMLWidget wrapper around the JavaScript library LineUp.js. Details about the LineUp visualization technique can be found at https://jku-vds-lab.at/tools/lineup/.
It can be used within standalone R Shiny apps or R Markdown files. Crosstalk is supported for synching selections and filtering among widgets.
install.packages('lineupjs')
library(lineupjs)lineup(mtcars)lineup(iris)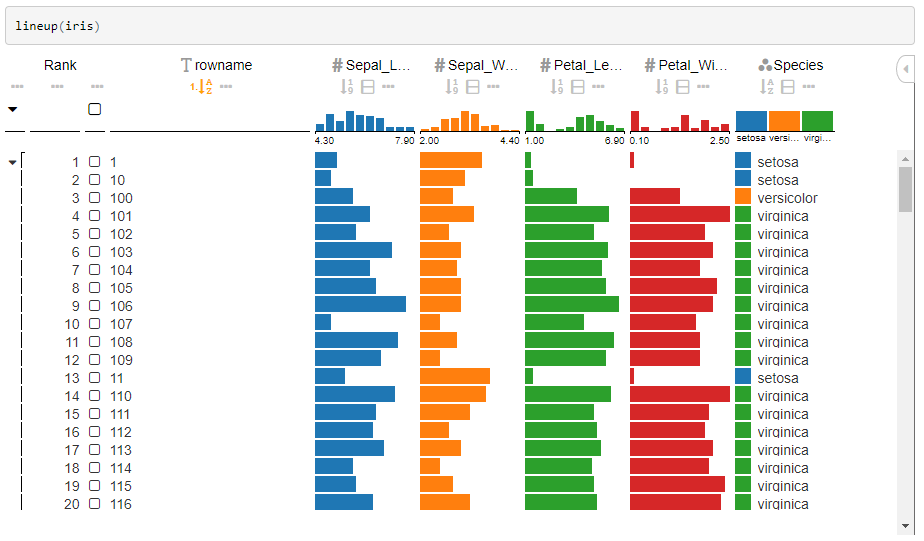
lineup(iris,
  ranking=lineupRanking(columns=c('_*', '*', 'impose'),
                        sortBy=c('Sepal_Length:desc'), groupBy=c('Species'),
                        impose=list(type='impose', column='Sepal_Length', categoricalColumn='Species')))
devtools::install_github("jcheng5/d3scatter")
library(d3scatter)
library(crosstalk)

shared_iris = SharedData$new(iris)

d3scatter(shared_iris, ~Petal.Length, ~Petal.Width, ~Species, width="100%")lineup(shared_iris, width="100%")
library(shiny)
library(crosstalk)
library(lineupjs)
library(d3scatter)

# Define UI for application that draws a histogram
ui <- fluidPage(
  titlePanel("LineUp Shiny Example"),

  fluidRow(
    column(5, d3scatterOutput("scatter1")),
    column(7, lineupOutput("lineup1"))
  )
)

# Define server logic required to draw a histogram
server <- function(input, output) {
  shared_iris <- SharedData$new(iris)

  output$scatter1 <- renderD3scatter({
    d3scatter(shared_iris, ~Petal.Length, ~Petal.Width, ~Species, width = "100%")
  })

  output$lineup1 <- renderLineup({
    lineup(shared_iris, width = "100%")
  })
}

# Run the application
shinyApp(ui = ui, server = server)
Hint:
In case you see scrollbars in each cell it is because of the font the cells are too narrow, you can specify a larger row height using
lineup(iris, options=list(rowHeight=20))- Samuel Gratzl (@sgratzl)
- Datavisyn GmbH (@datavisyn)