Ride share data analysis for Q1 2019.
Software:
-VS Code 1.77.3 -Python 3.10 -Pandas -MatPlotLib
Data: resources/city_data.csv resources/ride_data.csv
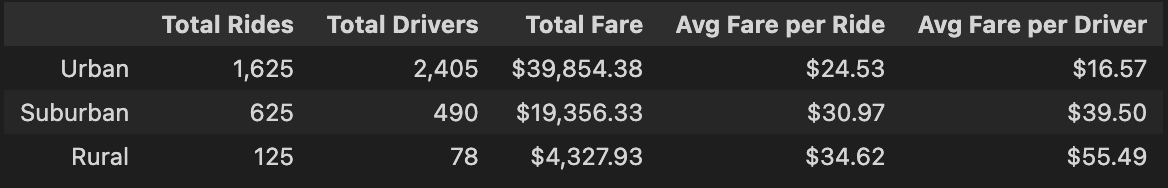
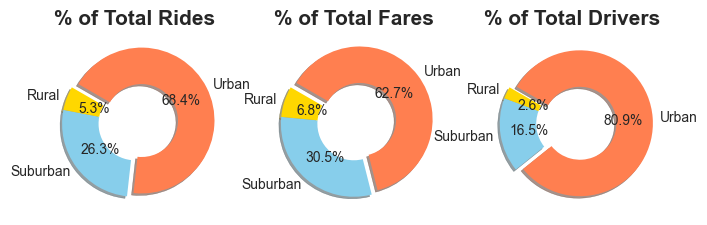
Rural areas, naturally, have the lowest metrics of the study. Consumers in these areas would most likely have their own form of transportation as rural areas are most commonly off the beaten path or have are some distance from economic centers. Less need for ridesharing would mean less need for rideshare drivers and the data supports that. An interesting fact worth noting is Rural areas have a higher percentage of the total fares. We will look into this more later.
Suburban areas find a balance between the rural and urban areas in terms of metrics. While not out of the way, suburban areas may be some distance from desirable destinations, requiring onsumers in these demographics to likely have their own form of transportation. The shorter travel would also allow for cheaper fares that may encourage consumers to utilize ridesharing over their personal transportation.
Urban areas have the highest number of rides, drivers and total fares indicating strong demand in densely populated regions, as would be exepcted. A detail worth noting is that the Urban areas moke up nearly 81% of the overall drivers but only 63% of fares. This inequality suggests that the average fare in Urban areas may be lower than in suburban or rural areas.
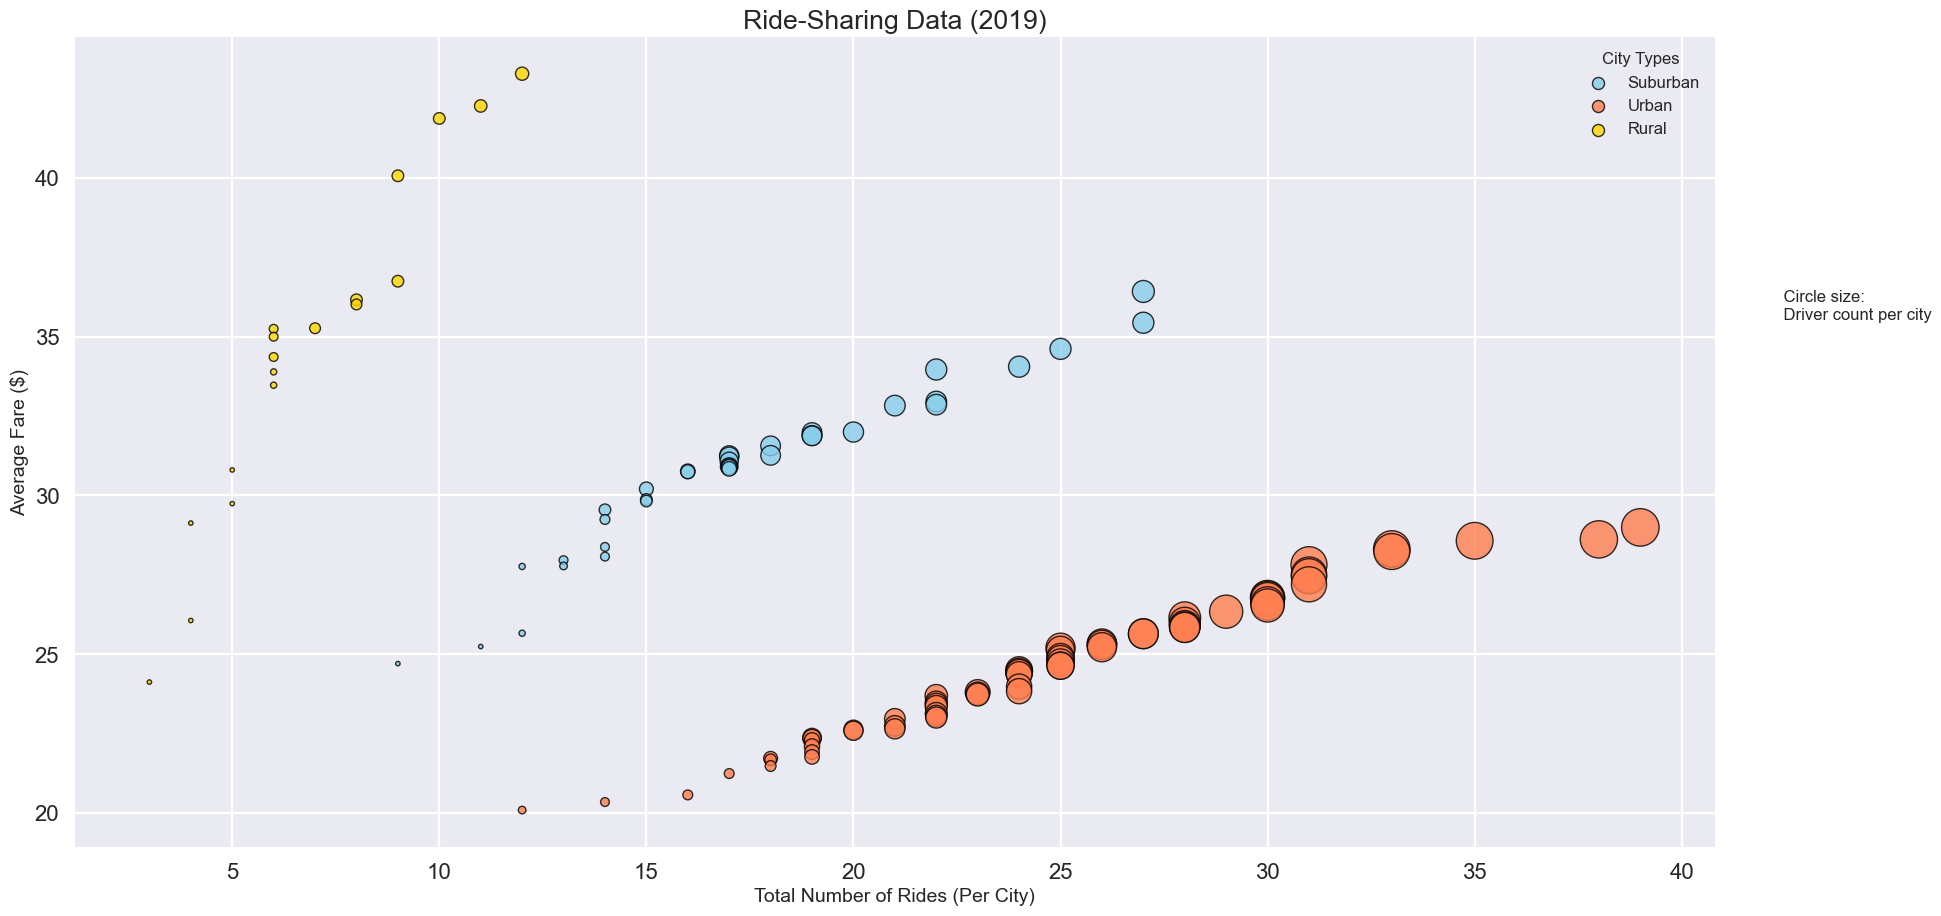
Looking at the breakdown of driver counts per city, as demand for rides increases, we can see the total number of drivers increase as well. This is consistent across all city types.
Average ride fare distributed as would be expected. The rural areas that require longer travel have higher fares, while the urban areas that have shorter travel distances require more drivers to keep up with the demand. This data confirms our conclusion from the percentage charts.
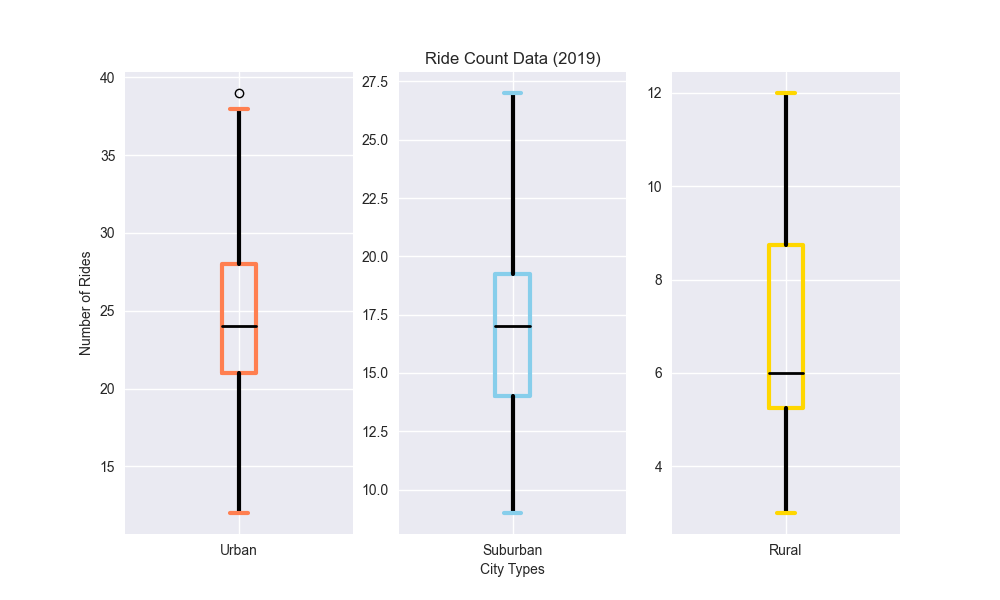
Urban cities have the widest range of ride counts. The data suggests that on average an Urban rideshare driver would be conducting nearly three times that of a rural driver; but could also have a less busy day, based on ride count, than a rural driver.
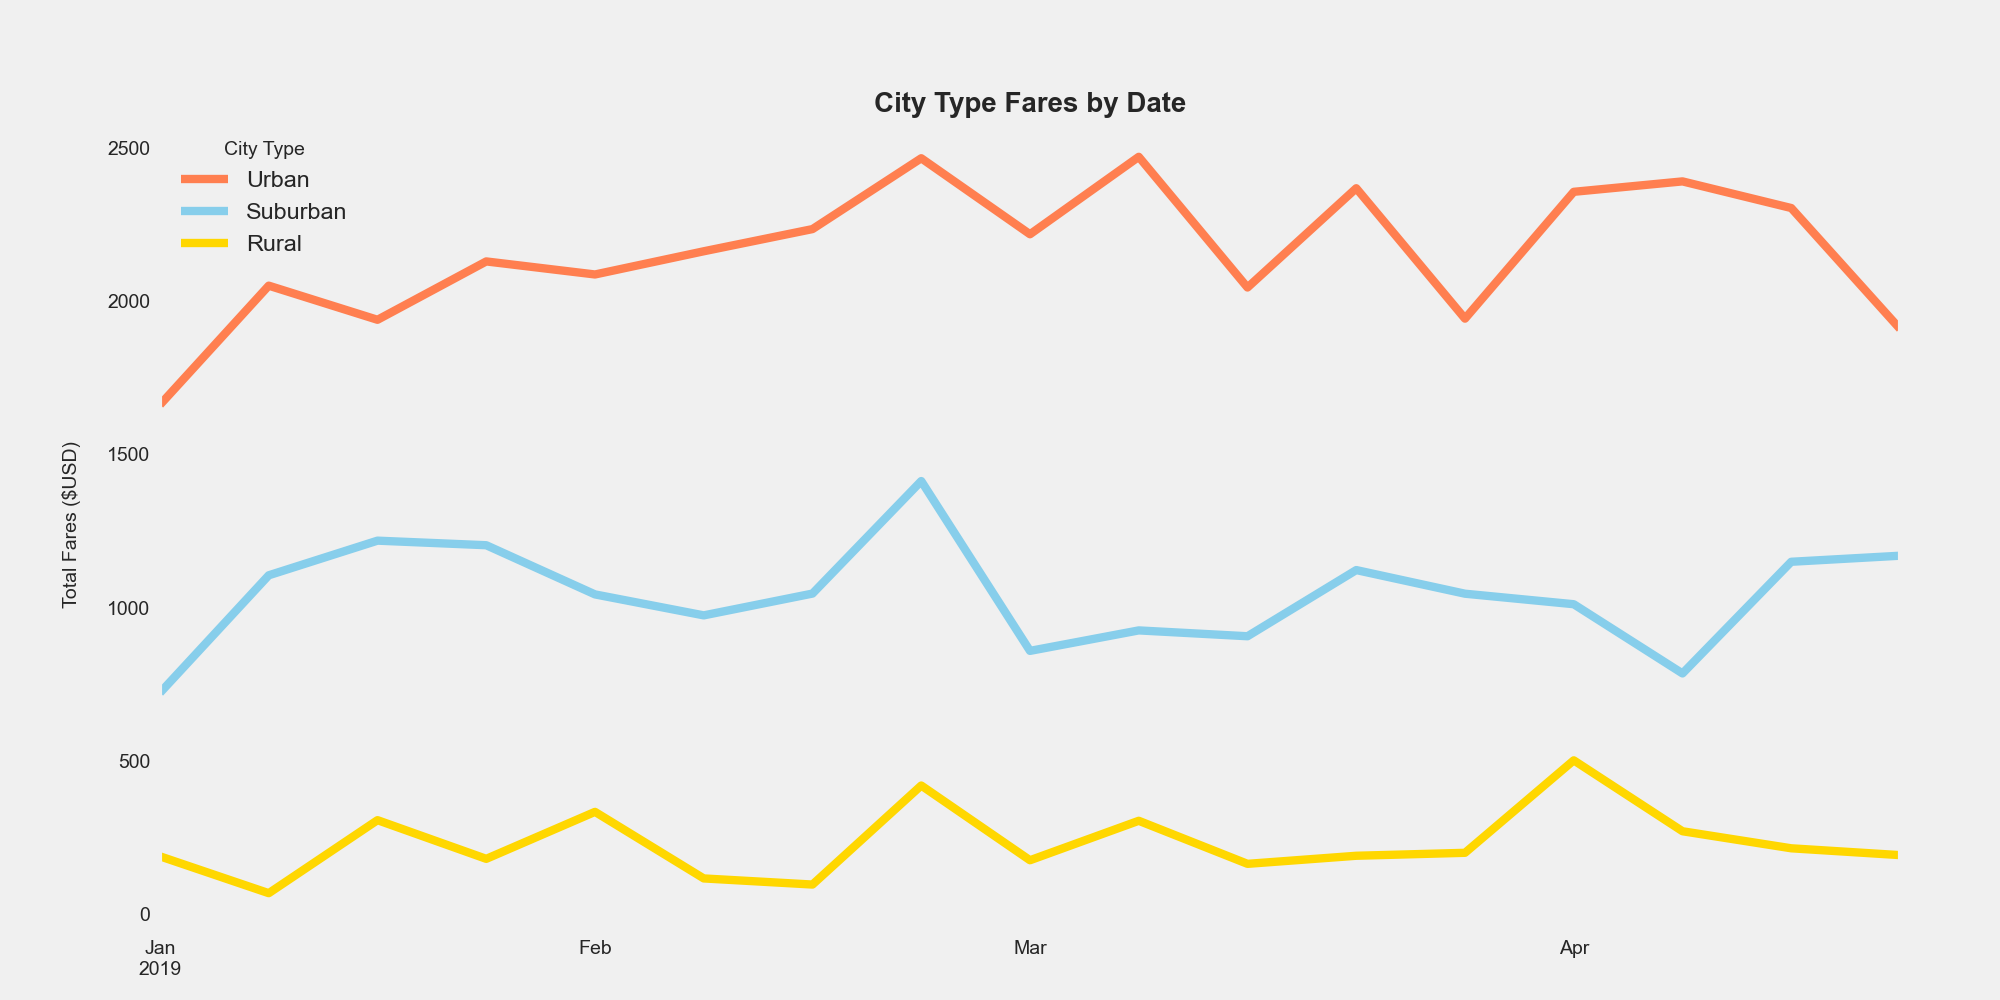
Looking at the weekly fares over time the data stays mostly consistent. The most fluctuation is found in the month of March, and looking at the Urban areas we see the most activity. Event parking can be both cumbersome and expensive, encouraging consumers to use alternate means of transportation like ridesharing. Events like March Madness could be the factor influencing the fluctuation at that time. We also see a large spike in rural and suburban rides at that time as well, suggesting that the event(s) is large enough to draw customers from all demographics.
The primary takeaway from the analysis is that ridesharing demand significantly differs across city types, with rural areas displaying lower demand, suburban areas showcasing moderate demand, and urban areas presenting the highest demand. This understanding enables rideshare companies to effectively tailor their services, optimize operations, and allocate resources to meet the distinct transportation needs of customers in each city type.
