Jupyter Notebook | Report | Presentation
- Aim
- GSV Dataset
- Description
- Number of Images per LSOA in Greater London
- Distribution by Latitude and Longitude of All Image Locations
- Example of Data Point with 4 Images Covering 360º Angle
- Number of Available Images per LSOA in the Dataset
- Total Number of Available Images in the Complete GSV Dataset
- Generated Files
- Object Detection | YOLOv5
- Description
- YOLOv5 Executed in a Static Image from the Dataset
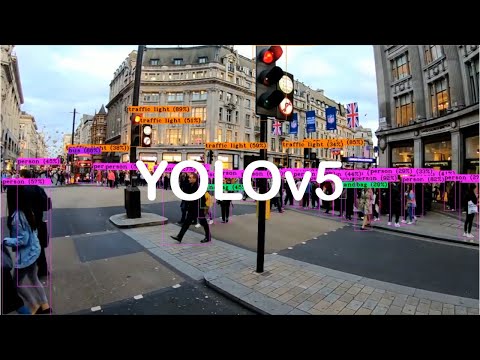
- YOLOv5 Executed in Real-Time in a Video from London
- Number of Detections to the Top 15 Most Common Objects
- LSOA Objects Distribution in Greater London
- Combining Some of the Previous Risk Factors
- Combination of the 2 Previous LSOAs
- Top 15 Detected Objects Correlation Matrix
- GIF Representation of the 2 Most Correlated Objects
- Top 15 Detected Objects Distribution
- Detailed Object Detection Information for All Categories in MS Coco, Present in the GSV imagery
- YOLOv5 Limitations
- Generated Files
- Future Directions
- Image Segmentation | PSPNet101
The aim of this project was to use imagery to estimate safety on the roads of London, from a cyclist’s perspective. After a brief introduction to the most important road safety indicators, a ranked list with several risk factors was compiled. Risk factors were obtained from Google StreetView (GSV) imagery dataset using the object detection YOLOv5 (released in June 2020 by Glenn Jocher) and image segmentation PSPNet101 (Pyramid Scene Parsing Network) (released in July 2017 by Hengshuang Zhao et al.).
Imagery dataset contains 518 350 images of greater London, distributed across 4833 boroughs. Each image is labeled in accordance to the LSOA it belongs. Images are organized in sets of 4 which corresponds to 4 90º angles from a total of 129 588 points.
Both YOLOv5 and PSPNet101 were benchmarked and validated using a set of 1 image per LSOA from the dataset.
Data was storage and processed in the secure High Performance Cluster from Imperial College London.
Along this project, it was used a Google StreetView imagery dataset from Greater London. It includes, approximately, 1/2 million images distributed across all LSOAs. For each data point there are 4 images ranging from 0º to 360º. These images were previously pre-processed (not as part of this project) to guarantee uniformity across them. More details are provided below.
Knowing the number of available images per LSOA allows us to normalize the objects counting in each area.

There is an higher density of GSV images in Central London.

Each image per data point covers a 90º degrees angle.

img_id = 23052
Distribution stats on the availability of GSV images across Greater London LSOAs.
| Minimum | Maximum | Mean | Standard Deviation | Mode | Median |
|---|---|---|---|---|---|
| 1 | 211 | 27 | 24 | 25 | 11 |
Not all images present in the GSV imagery dataset are LSOA labeled. For this reason, only 478 724 of the 518 350 were used when performing object detection or image segmentation.
| Number Images in GSV Dataset | Number of LSOA identified Images (image_labels.csv) | Number of Non-Repeated LSOA identified Images (image_labels.csv) | Number of Image Identified LSOAs (image_labels.csv) |
|---|---|---|---|
| 518 350 | 512 812 | 478 724 | 4832 |
GSV generated files are available in this project's repository.
| File | Description |
|---|---|
| imgId_lsoa.json | File converting GSV image ids into the London LSOAs they belong. |
| lsoa_number_images.json | Number of GSV images for each London LSOA. |
| london_shapefiles | Collection of shapefiles of London OAs, MSOAs and LSOAs. |
Object Detection | YOLOv5
YOLOv5 is the most recent version of YOLO which was originally developed by Joseph Redmon. First version runs in a framework called Darknet which was purposely built to execute YOLO.
Version 5 is the 2nd model which was not developed by Joseph Redmon (after version 4) and the first running in the state-of-the-art machine learning framework, in this case, PyTorch.
This model was pre-trained using Coco dataset. Thus, it is able to identify 80 object categories. Distributed over 11 categories.
Full list of MS Coco categories
| Person | Vehicle | Outdoor | Animal | Accessory | Sports | Kitchen | Food | Furniture | Electronic | Appliance | Indoor |
|---|---|---|---|---|---|---|---|---|---|---|---|
| Person | Bicycle | Traffic Light | Bird | Backpack | Frisbee | Bottle | Banana | Chair | TV | Microwave | Book |
| Car | Fire Hydrant | Cat | Umbrella | Skis | Wine Glass | Apple | Couch | Laptop | Oven | Clock | |
| Motorcycle | Stop Sign | Dog | Handbag | Snowboard | Cup | Sandwich | Potted Plant | Mouse | Toaster | Vase | |
| Airplane | Parking Meter | Horse | Tie | Sports Ball | Fork | Orange | Bed | Remote | Sink | Scissors | |
| Bus | Bench | Sheep | Suitcase | Kite | Knife | Broccoli | Dinning Table | Keyboard | Refrigerator | Teddy Bear | |
| Train | Cow | Baseball Bat | Spoon | Carrot | Toilet | Cell Phone | Hair Drier | ||||
| Truck | Elephant | Baseball Glove | Bowl | Hot dog | Toothbrush | ||||||
| Boat | Bear | Skateboard | Pizza | ||||||||
| Zebra | Surfboard | Donut | |||||||||
| Giraffe | Tennis Racket | Cake |
This example illustrates very well the power of this tool. Even the reflection of the car in a window nearby the algorithm was able to count as the right object.

Video uploaded to YouTube showing how YOLOv5 is able to detect in real-time, with high accuracy, objects from a big range of sizes and sometimes occluded by others.
In the top 15 most commonly detected objects in the GSV dataset are the ones identified as highly relevant to assess cyclist's road safety.
| Object | Number Detections* | Object | Number Detections* | Object | Number Detections* |
|---|---|---|---|---|---|
| Car | 1 509 344 | Bicycle | 10 894 | Chair | 2191 |
| Person | 107 266 | Motorcycle | 8970 | Handbag | 2090 |
| Truck | 70 083 | Traffic Light | 6310 | Backpack | 1939 |
| Potted Plant | 37 917 | Bench | 5013 | Stop Sign | 1282 |
| Bus | 11 512 | Clock | 2750 | Fire Hydrant | 1168 |
* >= 0.5 YOLOv5 score
List of the most relevant objects distribution by LSOA with the corresponding histograms on the right.
| Bicycle LSOA (↑) | Bicycle Distribution Histogram (↑) |
|---|---|
 |
 |
| Bus LSOA (↓) | Bus Distribution Histogram (↓) |
|---|---|
 |
 |
| Car LSOA (↓) | Car Distribution Histogram (↓) |
|---|---|
 |
 |
| Parking Meter LSOA (↓) | Parking Meter Distribution Histogram (↓) |
|---|---|
 |
 |
| Person LSOA (↑) | Person Distribution Histogram (↑) |
|---|---|
 |
 |
| Stop Sign LSOA (↑) | Traffic Light Distribution Histogram (↑) |
|---|---|
 |
 |
| Traffic Light LSOA (↑) | Traffic Light Distribution Histogram (↑) |
|---|---|
 |
 |
| Truck LSOA (↓) | Truck Distribution Histogram (↓) |
|---|---|
 |
 |
* ↑ and ↓ were positively and negatively associated to road safety, respectively.
It was combined 5 of the previous LSOAs to obtain a measure on the total number of pedestrians and cyclists in London (in the context of this project, this was perceived as enhancing safety factor for other cyclists). And a second LSOA where the total number of (motorized) vehicles in London was plotted.
| Pedestrians and Cyclists in Greater London (average number per image) (↑) | Traffic (buses, cars and trucks) in Greater London (average number per image) (↓) |
|---|---|
 |
 |
During this project, we did not defined a precise metric for assessing cyclist road safety. Although, one strong possibility would be a weighted combination of positive and negative risk factors like the ones exposed by LSOA distributions above.

Includes Pearson correlation factor for each combination of objects, plus the respective p-value scores.

This GIF highlights the similar distribution between 1 of the 2 most correlated objects present in the correlation matrix above.

Top 15 detections contain all the objects that were defined as relevant in assessing road safety in a cyclist perspective. One immediate observation is that the majority of the detected objects were cars. This is not surprising once GSV images were taken from the road.

In the dropdown below is provided detailed information on the total number of occurrences, minimum, maximum and mean number of objects per London LSOA.
COCO Objects Stats for all LSOAs
| Category | Total Number Occurrences | Minimum | Maximum | Mean |
|---|---|---|---|---|
| Person | 107 266 | 0 | 695 | 22 |
| Bicycle | 10 894 | 0 | 144 | 2 |
| Car | 1 509 344 | 13 | 1891 | 312 |
| Motorcycle | 8970 | 0 | 74 | 1 |
| Airplane | 234 | 0 | 4 | 0 |
| Bus | 11 512 | 0 | 36 | 2 |
| Train | 657 | 0 | 5 | 0 |
| Truck | 70 083 | 0 | 192 | 14 |
| Boat | 971 | 0 | 22 | 0 |
| Traffic Light | 6310 | 0 | 54 | 1 |
| Fire Hydrant | 1168 | 0 | 11 | 0 |
| Stop Sign | 1282 | 0 | 8 | 0 |
| Parking Meter | 968 | 0 | 7 | 0 |
| Bench | 5013 | 0 | 23 | 1 |
| Bird | 509 | 0 | 9 | 0 |
| Cat | 27 | 0 | 2 | 0 |
| Dog | 419 | 0 | 3 | 0 |
| Horse | 35 | 0 | 2 | 0 |
| Sheep | 13 | 0 | 5 | 0 |
| Cow | 79 | 0 | 2 | 0 |
| Elephant | 2 | 0 | 1 | 0 |
| Bear | 3 | 0 | 1 | 0 |
| Zebra | 5 | 0 | 1 | 0 |
| Giraffe | 22 | 0 | 1 | 0 |
| Backpack | 1939 | 0 | 20 | 0 |
| Umbrella | 378 | 0 | 9 | 0 |
| Handbag | 2090 | 0 | 28 | 0 |
| Tie | 39 | 0 | 5 | 0 |
| Suitcase | 467 | 0 | 8 | 0 |
| Frisbee | 384 | 0 | 4 | 0 |
| Skis | 2 | 0 | 1 | 0 |
| Snowboard | 0 | 0 | 0 | 0 |
| Sports Ball | 102 | 0 | 4 | 0 |
| Kite | 465 | 0 | 16 | 0 |
| Baseball Bat | 7 | 0 | 3 | 0 |
| Baseball Glove | 1 | 0 | 1 | 0 |
| Skateboard | 245 | 0 | 3 | 0 |
| Surfboard | 80 | 0 | 2 | 0 |
| Tennis Racket | 13 | 0 | 1 | 0 |
| Bottle | 71 | 0 | 9 | 0 |
| Wine Glass | 1 | 0 | 1 | 0 |
| Cup | 9 | 0 | 2 | 0 |
| Fork | 0 | 0 | 0 | 0 |
| Knife | 0 | 0 | 0 | 0 |
| Spoon | 1 | 0 | 1 | 0 |
| Bowl | 6 | 0 | 2 | 0 |
| Banana | 6 | 0 | 3 | 0 |
| Apple | 6 | 0 | 2 | 0 |
| Sandwich | 8 | 0 | 3 | 0 |
| Orange | 2 | 0 | 1 | 0 |
| Broccoli | 1 | 0 | 1 | 0 |
| Carrot | 0 | 0 | 0 | 0 |
| Hot Dog | 1 | 0 | 1 | 0 |
| Pizza | 4 | 0 | 2 | 0 |
| Donut | 3 | 0 | 1 | 0 |
| Cake | 1 | 0 | 1 | 0 |
| Chair | 2191 | 0 | 56 | 0 |
| Couch | 16 | 0 | 2 | 0 |
| Potted Plant | 37 917 | 0 | 406 | 7 |
| Bed | 30 | 0 | 2 | 0 |
| Dining Table | 133 | 0 | 9 | 0 |
| Toilet | 30 | 0 | 3 | 0 |
| Tv | 68 | 0 | 2 | 0 |
| Laptop | 1 | 0 | 1 | 0 |
| Mouse | 0 | 0 | 0 | 0 |
| Remote | 0 | 0 | 0 | 0 |
| Keyboard | 0 | 0 | 0 | 0 |
| Cell Phone | 21 | 0 | 2 | 0 |
| Microwave | 4 | 0 | 1 | 0 |
| Oven | 6 | 0 | 1 | 0 |
| Toaster | 0 | 0 | 0 | 0 |
| Sink | 4 | 0 | 1 | 0 |
| Refrigerator | 320 | 0 | 7 | 0 |
| Book | 11 | 0 | 7 | 0 |
| Clock | 2750 | 0 | 31 | 0 |
| Vase | 17 | 0 | 4 | 0 |
| Scissors | 1 | 0 | 1 | 0 |
| Teddy Bear | 4 | 0 | 1 | 0 |
| Hair Dryer | 0 | 0 | 0 | 0 |
| Toothbrush | 0 | 0 | 0 | 0 |
| Total | 1 785 642 | 0 | 1891 | 370 |
For all road objects we intended to identify, the accuracy rates were very high, with very few misclassifications due to the high detection threshold (0.5) it was set. For this reason, the number of detected objects in the image is likely to be higher than the detected one. In terms of other objects, satellite dishes were often misclassified as clocks. There is a strong resemblance in frontal images between clock pointers and dishes arms. Boats were wrongly classified as construction containers due to their shape. Fences as benches presumably due to their texture. And Streetlights as kites and frisbees, possible because they have similar backgrounds - sky.

All the generated files are available on the project's repository or, in the case of the object detected images (1 per LSOA), in a linked Google Drive folder.
| File | Description |
|---|---|
| total_stats.json | Number of objects detected by YOLOv5 in GSV imagery by class. |
| lsoa_objects_number.json | Number of objects detected by YOLOv5 in GSV imagery by class and LSOA. |
| lsoa_objects_number_average_per_image.json | Average number of objects detected by YOLOv5 in GSV imagery per image (includes all classes and LSOAs). JSON format. |
| lsoa_objects_number_average_per_image.csv | Average number of objects detected by YOLOv5 in GSV imagery per image (includes all classes and LSOAs). CSV format. |
| yolov5_lsoa | Folder with 1 processed image per LSOA. |
| img_ids_clock.txt | List of all image IDs in GSV imagery dataset where clocks were detected. |
Analysis of a significant set of GSV images in London unveiled meaningful LSOA level patterns. One is the airplane distribution in the areas closer to the 2 airports in Greater London. Second, the presence of potted plants was found to be more significant around the biggest parks. This shows the potential of GSV imagery analysis is not limited to assess road safety.
| Airplane | Potted Plant |
|---|---|
 |
 |
Image Segmentation | PSPNet101
Image segmentation models reached a precision plateau (in terms of average IoU) in the previous 2 years. Due to their long execution times, it was chosen the model executing faster, with the higher precision and better documentation.
PSPNet101 was pre-trained in the Cityscapes dataset. This way, it was able to label all pixels from an image across 100 categories.
Full list of Cityscapes categories
| Void | Flat | Construction | Object | Nature | Sky | Human | Vehicle |
|---|---|---|---|---|---|---|---|
| Unlabeled | Road | Building | Pole | Vegetation | Sky | Person | Car |
| Ego Vehicle | Sidewalk | Wall | Polegroup | Terrain | Rider | Truck | |
| Rectification Border | Parking | Fence | Traffic Light | Bus | |||
| Out of ROI | Road | Guard Rail | Traffic Sign | Caravan | |||
| Static | Bridge | Trailer | |||||
| Dynamic | Tunnel | Train | |||||
| Ground | Motorcycle | ||||||
| Bicycle | |||||||
| License Plate |
After executing PSPNet101 in one of the images from the dataset, we obtain a segmented one where all pixels have an associated color
accordingly to the category they belong. It was created a dictionary that links each one of these colors to the different
object categories.

Road safety related objects are among the most detected. Consequently, PSPNet101 pre-trained in Cityscapes is an appropriate tool to extract relevant information on this topic.

Due to time constraints, contrarily to the object detection part, it was only possible to analyse the general presence of pixel labels at a dataset (not LSOA) level.
| Pixel Label | Number Pixels | Pixel Label | Number Pixels | Pixel Label | Number Pixels | Pixel Label | Number Pixels |
|---|---|---|---|---|---|---|---|
| Building | 47 394 852 284 | Sidewalk | 2 772 560 820 | Motorcycle | 299 507 380 | Traffic Sign | 58 135 598 |
| Sky | 38 423 367 965 | Fence | 2 177 733 764 | Person | 232 309 236 | Rider | 13 948 361 |
| Road | 38 235 843 337 | Terrain | 1 787 689 493 | Bicycle | 95 469 333 | Traffic Light | 12 472 659 |
| Vegetation | 30 977 112 560 | Wall | 765 524 909 | Truck | 91 256 316 | Train | 6 842 318 |
| Car | 9 830 297 990 | Pole | 303 407 190 | Bus | 81 476 810 | Total | 173 559 808 323 |
The main difficulties of image segmentation are:
- Account for image angles when trying to capture the shape of an object;
- Object occlusion;
- Sometimes roads and sidewalks appear unexpectedly disrupted;
- Image resolution. In the case of structures with a small area (streetlights), it might not be possible to segment them due to low resolution. This happens because the imagery dataset, which was extracted from GSV, did not keep the original quality.
All the generated files are available on the project's repository or, in the case of the segmented images (1 per LSOA), in a linked Google Drive folder.
| File | Description |
|---|---|
| total_stats.json | Total number of pixels for each Cityscapes label in the GSV dataset. |
| rgb_label.json | Conversion from RGB values to the respective Cityscapes label. |
| pspnet101_lsoa | Folder with 1 segmented image per LSOA. |
- Analysing segmented images road by road;
- Having a higher resolution London imagery dataset with better coverage from all Greater London territory;
- Link image segmentation analysis with the objects detected using YOLOv5;
- Although this would not represent a significant improvement, using a more precise pre-trained model like Xception71 available in TensorFlow DeepLab Model Zoo would increase the quality of the segmented images.

Majid Ezzati (Imperial College London) | Ricky Nathvani (Imperial College London)
Featured in Towards Data Science (Medium) -> Article
Roadmap -> Wiki
Draft -> Google Doc


