GithubHelp home page GithubHelp logo

luizeduardoserrano / vmware-grafana Goto Github PK

View Code? Open in Web Editor NEW

This project forked from jorgedlcruz/vmware-grafana

0.0 0.0 0.0 214 KB

A simple way to retrieve vCenter information and send it to InfluxDB, to present it later with Grafana

License: MIT License

vmware-grafana's Introduction

How to monitor a VMware vSphere Environment using Telegraf, InfluxDB and Grafana

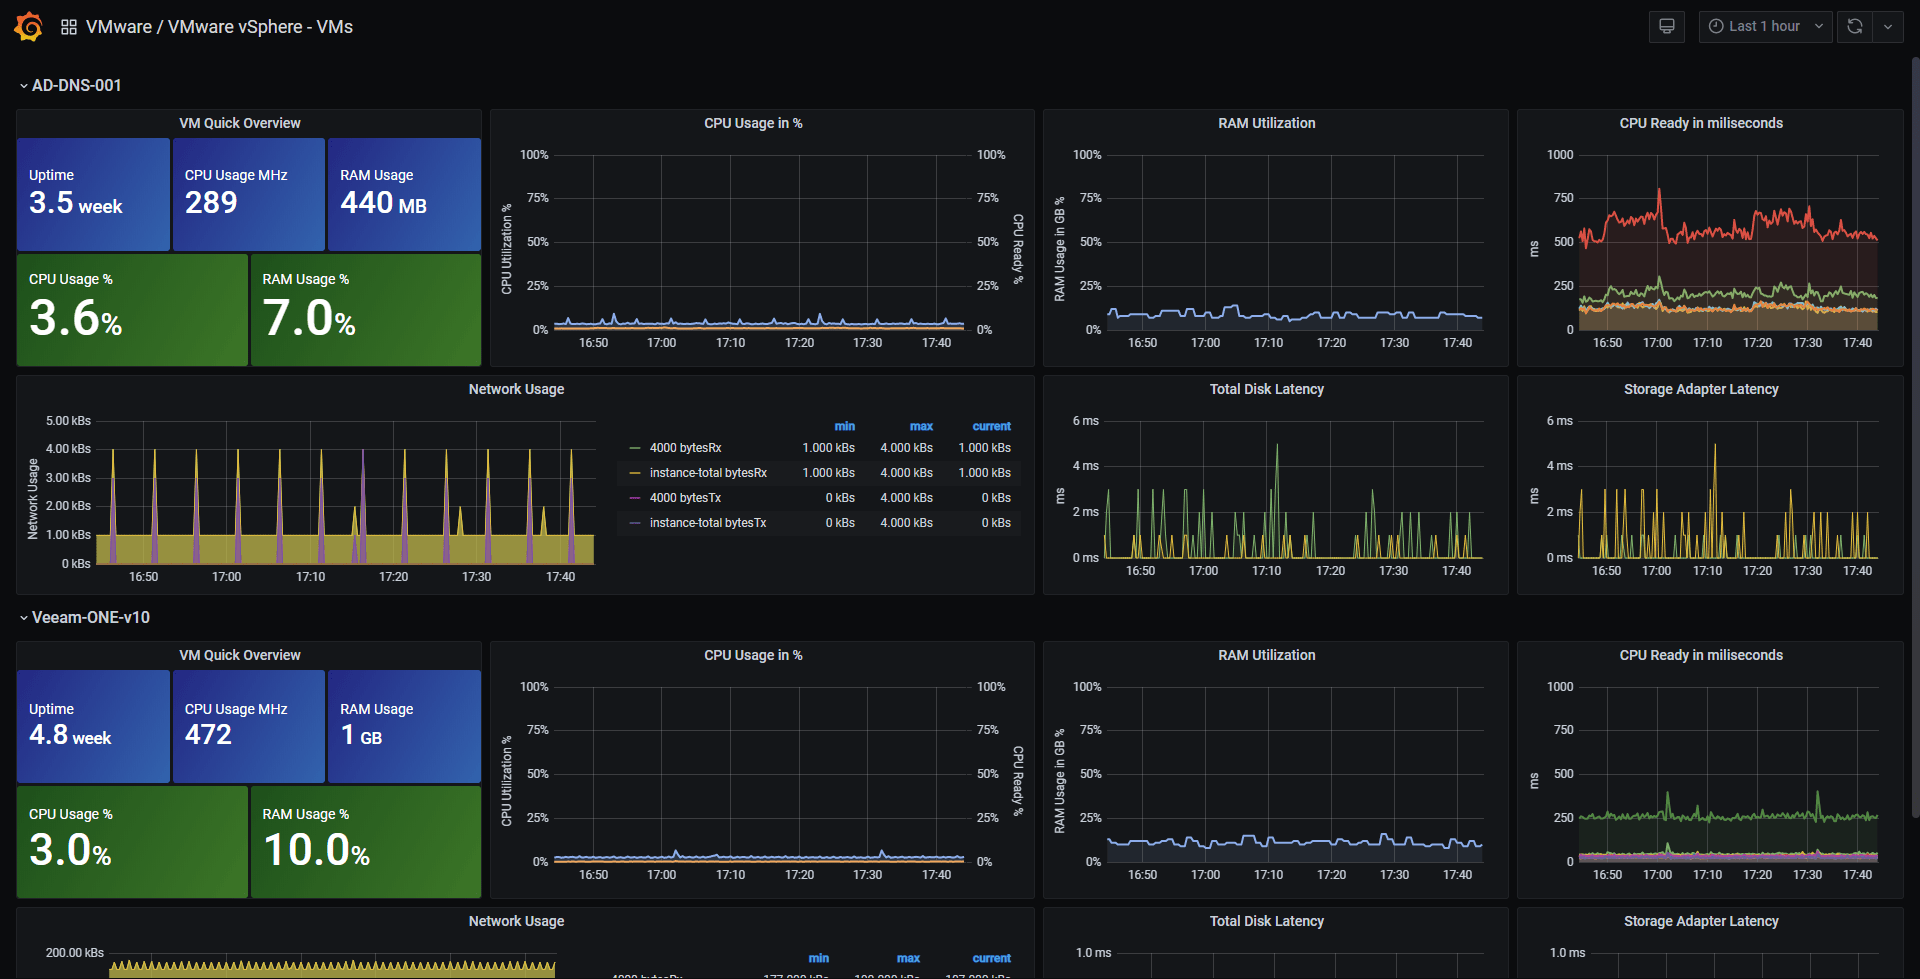
Once you import the Grafana Dashboards on your Environment, it should look all like these:

VMware vSphere Overview Dashboard VMware vSphere Overview Dashboard

VMware vSphere Hosts Dashboard VMware vSphere Hosts Dashboard

VMware vSphere Datastores Dashboard VMware vSphere Datastores Dashboard

VMware vSphere VMs Dashboard VMware vSphere VMs Dashboard


Getting started

You can follow the steps on the next Blog Post in English - https://jorgedelacruz.uk/2018/10/01/looking-for-the-perfect-dashboard-influxdb-telegraf-and-grafana-part-xii-native-telegraf-plugin-for-vsphere/

But in case you want a quick bullet point list:

  • Make sure you have Telegraf v1.8.0 or above, then read about the vSphere Plugin here - https://github.com/influxdata/telegraf/tree/release-1.8/plugins/inputs/vsphere
  • Edit the vSphere Plugin and add your vCenter IP or FQDN, user and credentials, and enable the sections you want to monitor or exclude from your vSphere.
  • Restart the Telegraf service
  • Download the VMware vSphere Grafana Dashboards JSON filee and import them into your Grafana
  • Enjoy (:

Additional Information

  • This repository it's just intended to provide the Dashboard json files and some help

Legacy steps for PowerShell Information

This project consists in two Powershell scripts by Mike Nisk - https://github.com/vmkdaily to retrieve the vSphere information and send it directly to InfluxDB, then in Grafana: a Dashboard is created to present all the information.

Getting started

You can follow the steps on the next Blog Post in Spanish - https://www.jorgedelacruz.es/2017/06/12/en-busca-del-dashboard-perfecto-influxdb-telegraf-y-grafana-parte-vii-monitorizar-vsphere/

But in case you can't read Spanish:

  • Download the Scripts from the official repo https://github.com/vmkdaily/vFlux-Stats-Kit to the computer you want to run the Scripts periodically
  • You should have VMware PowerCLI on this machine
  • Edit the Scripts and add your InfluxDB IP or FQDN, InfluxDB users and Database, logging, etc.
  • Run the Scripts to check that you can retrieve the information properly
  • Schedule the Scripts in Windows to run every X minutes, where you decide the X
  • Download the VMware Stats Grafana JSON file and import it into your Grafana
  • Change your inforamtion inside the Grafana and enjoy :)

VMware vSphere Overview Dashboard using PowerShell alt tag

vmware-grafana's People

Contributors

drewstinnett avatar jorgedlcruz avatar

Recommend Projects

  • React photo React

    A declarative, efficient, and flexible JavaScript library for building user interfaces.

  • Vue.js photo Vue.js

    ๐Ÿ–– Vue.js is a progressive, incrementally-adoptable JavaScript framework for building UI on the web.

  • Typescript photo Typescript

    TypeScript is a superset of JavaScript that compiles to clean JavaScript output.

  • TensorFlow photo TensorFlow

    An Open Source Machine Learning Framework for Everyone

  • Django photo Django

    The Web framework for perfectionists with deadlines.

  • D3 photo D3

    Bring data to life with SVG, Canvas and HTML. ๐Ÿ“Š๐Ÿ“ˆ๐ŸŽ‰

Recommend Topics

  • javascript

    JavaScript (JS) is a lightweight interpreted programming language with first-class functions.

  • web

    Some thing interesting about web. New door for the world.

  • server

    A server is a program made to process requests and deliver data to clients.

  • Machine learning

    Machine learning is a way of modeling and interpreting data that allows a piece of software to respond intelligently.

  • Game

    Some thing interesting about game, make everyone happy.

Recommend Org

  • Facebook photo Facebook

    We are working to build community through open source technology. NB: members must have two-factor auth.

  • Microsoft photo Microsoft

    Open source projects and samples from Microsoft.

  • Google photo Google

    Google โค๏ธ Open Source for everyone.

  • D3 photo D3

    Data-Driven Documents codes.