messari / subgraphs Goto Github PK
View Code? Open in Web Editor NEWStandardized subgraphs for blockchain data
License: MIT License
Standardized subgraphs for blockchain data
License: MIT License


Liquidate entity in lending subgraphs: #686 (comment)pricePerShare to BigIntThis Github Issue is being used as an example and can be deleted/ignored.
| Description | Value |
|---|---|
| Subgraph Reviewed | https://subgraphs.messari.io/subgraph?endpoint=https://api.thegraph.com/subgraphs/name/messari/balancer-v2-ethereum&tab=protocol |
| Date Reviewed | 7th June 2022 |
| Schema Version | 1.2.0 |
| Subgraph Version | 1.2.2 |
| Methodology Version | 1.0.0 |
| Evidence Spreadsheet | https://docs.google.com/spreadsheets/d/19Cc26WlCn3PXGQjzA004HqPSAFrvfL5EeXEljiAtC2Y |
| Metric | Issue |
|---|---|
| totalValueLockedUSD | TVL Calculation likely incorrect. Different to DeFi Llama TVL by 2000%. |
| dailyTotalRevenueUSD | Not the same value as summing dailySupplySideRevenueUSD + dailyProtocolSideRevenueUSD |
We are not using the outputToken field, but we are using an internal field with the name _outputTokens.
fields starting with _ should be ignored in the dashboard as they are internal and not for the dashboard to read.
We should use startsWith instead of contains or better yet: ignore all field names starting with _
Missing methodologyVersion in protocol
Especially in the case of a GraphQL query error
Not sure if this is an issue in the data but there is a huge jump in protocol revenue around June 2020

The lib supports next to mainnet also fantom and arbitrum, extending it for optimism is probably not too different to arbitrum.
Token emission are all zero. I believe they had a bug in their emission contract at the time and upgrade it to a different one. Probably worth looking into. @dmelotik

I plan on attempting to claim the bounty on Autofarm, is the payout still 10k USD? Once I receive confirmation, I can send a flowchart and can begin working on a schema for it soon.
Thanks,
The TVL graph looks like a step function to a huge abnormally large value. Perhaps caused by wonky price data. The first issue that should be fixed is this, as this might resolve other issues.
More detail: https://docs.google.com/spreadsheets/d/1R3GvDHbv8hNfqgmZ0NbkQNS0raBsLtbuJ20Kk_bOwtM/edit#gid=617964580
Address: 0x4e3fbd56cd56c3e72c1403e103b45db9da5b9d2b
Etherscan: Convex Token(CVX)
Original Price: approx $26.8241
Reported Price from Price Lib: $2853.700013 at block 14594214
Latest Round Data from Chainlink Feed with address 0x47Fb2585D2C56Fe188D0E6ec628a38b74fCeeeDf

Getting decimals

Calculations
Reported price = 2695000000
Decimals = 8

Final price = 2695000000 / 100000000 = $26.95
If the Chainlink Feed is able to fetch the price for input token then it will also be effective to fetch the decimals for the token.
OutputToken should not be MIM

I deployed gamma strategies to polygon, but I have run into this error upon deployment.
| Description | Value |
|---|---|
| Subgraph Reviewed | https://subgraphs.messari.io/subgraph?endpoint=https://api.thegraph.com/subgraphs/name/messari/yearn-v2-ethereum&tab=protocol |
| Date Reviewed | June 11 2022 |
| Schema Version | 1.2.1 |
| Subgraph Version | 1.1.0 |
| Methodology Version | 1.0.0 |
| Evidence Spreadsheet | https://docs.google.com/spreadsheets/d/1giCRxC27TDC9xscw0YEKJDHPb3ZgS6WtuS4VipaOHN0/edit?usp=sharing |
Protocol Metrics
| Section | Metric | Issue |
|---|---|---|
| financialsDailySnapshots | totalValueLockedUSD | 5/22 and 5/23 are showing TVL in the trillions |
| financialsDailySnapshots | dailySupplySideRevenueUSD | I am not a 100% on this. The numbers are off compared to Token Terminal, but we could be using a different calculation. Regardless there is one day that is like 2,000% off |
| financialsDailySnapshots | cumulativeSupplySideRevenueUSD | Daily is off, so cumulative will be |
| financialsDailySnapshots | dailyProtocolSideRevenueUSD | Recording 0 revenue for the last couple of months |
| financialsDailySnapshots | cumulativeProtocolSideRevenueUSD | Daily is off, so cumulative will be |
| financialsDailySnapshots | dailyTotalRevenueUSD | Values closer to present seem way off, but the past data actually is aligning pretty well. There are instances where Total revene ≠ Protocol + Supply Side |
| financialsDailySnapshots | cumulativeTotalRevenueUSD | Daily is off, so cumulative will be |
totalPositionCount is ambigious and confusing
openPositionCount would be straightforward
Also consider cummulativePositionCount can instead be called totalPositionCount
subgraphs/schema-lending-extended.graphql
Line 296 in 323d078


When I build and deploy this subgraph. I run into these errors. Its probably because this is a required field.
Negative market.totalValueLocked and market.inputTokenBalance in some cases.
See gql query and subgraph visualizer

Issue: inputTokenBalance is being calculated from Mints and Redeems. This would be okay, but there is interest accrued on borrows which is not accounted for. So when a market's TVL is close to 0 it is at risk of this bug. In addition, inputTokenBalance and TVL are not accurate with this mapping.
Fix: Use market.outputTokenSupply: inputTokenSupply = outputTokenSupply * exchangeRate. This will also create an accurate TVL because it is calculated from outputTokenSupply.
The market.exchangeRate can be found in a more generic way:
exchangeRate = exchangeRatemantissa / 1e(18 + underlyingToken.decimals - outputToken.decimals)
This is an issue in fuse that is fixed with this. It will only affect comp forks where the cToken doesn't have 8 decimals.
Compound changed how to gather compound distribution rates around October of 2021.
After that change rewards rates should be calculated using compBorrowSpeeds and compSupplySpeeds, see https://etherscan.io/address/0x3d9819210a31b4961b30ef54be2aed79b9c9cd3b#readProxyContract to see the current rates.
Change effective at this transaction: https://etherscan.io/tx/0xc5098f8fb149262d7f26d32c0642e0e8bee5383d9df9c4988070f63a23cb9912
When sorting by TVL in the 'Pool Overview' tab of lending protocols, it doesn't actually seem to sort by TVL in USD.
For example:

| Description | Value |
|---|---|
| Subgraph Reviewed | https://subgraphs.messari.io/subgraph?endpoint=https://api.thegraph.com/subgraphs/name/messari/curve-finance-ethereum&tab=protocol |
| Date Reviewed | June 8th 2022 |
| Schema Version | 1.2.1 |
| Subgraph Version | 1.0.0 |
| Methodology Version | 1.0.0 |
| Evidence Spreadsheet | https://docs.google.com/spreadsheets/d/1Upp-puGDU5WVAQLzoNzrWKJSLA6AibZWQmBNrH0IgoI/edit?usp=sharing |
Protocol Metrics
| Section | Metric | Issue |
|---|---|---|
| financialsDailySnapshots | totalValueLockedUSD | Numbers seems way too big |
| financialsDailySnapshots | dailyVolumeUSD | Numbers are off for multiple days |
| financialsDailySnapshots | cumulativeVolumeUSD | Daily numbers off, so cumulative will also be |
| financialsDailySnapshots | dailySupplySideRevenueUSD | Negative values for revenue |
| financialsDailySnapshots | cumulativeSupplySideRevenueUSD | Daily is off, so cumulative will also be |
| financialsDailySnapshots | dailyProtocolSideRevenueUSD | Numbers are too big |
| financialsDailySnapshots | cumulativeProtocolSideRevenueUSD | Daily off, so cumulative too |
| financialsDailySnapshots | dailyTotalRevenueUSD | Supply and protocol side are off, so total will also be off |
| financialsDailySnapshots | cumulativeTotalRevenueUSD | Daily is off, so cumulative will also be |
| usageMetricsHourlySnapshots | hourlyActiveUsers | Outputting Daily Time Series |
| usageMetricsHourlySnapshots | hourlyTransactionCount | Same as above |
| usageMetricsHourlySnapshots | hourlyDepositCount | Same as above |
| usageMetricsHourlySnapshots | hourlyWithdrawCount | Same as above |
| usageMetricsHourlySnapshots | hourlySwapCount | Same as above |
Pool Overview Metrics
| Pool | Metric | Issue |
|---|---|---|
| Curve.fi DAI/USDC/USDT | Reward Tokens | Currently appearing as 73.30% CRV is 0.21% CRV on the Curve UI |
| Curve.fi DAI/USDC/USDT | Base Yield % | Negative Value |
Pool Metrics
| Pool | Section | Metric | Issue |
|---|---|---|---|
| Curve.fi DAI/USDC/USDT | liquidityPoolDailySnapshots | rewardTokenEmissions - USD | This does not look right since token emissions are in USD. Should be rewardTokenEmissionsAmount (CRV) * Average CRV price for that day and is not. |
| Curve.fi DAI/USDC/USDT | liquidityPoolDailySnapshots | baseYield | Negative Value |
| Curve.fi DAI/USDC/USDT | liquidityPoolDailySnapshots | rewardAPR | APR is too high |
| Curve.fi DAI/USDC/USDT | liquidityPoolHourlySnapshots | ALL HOURLY | Hourly Snapshots are outputting Daily Time Series |
You can use template literals to clean up string concatenation
navigate(`?subgraph=${subgraphParam}&poolId=${poolId}&tab=${tabName}`);
This will cause the setWarning function to be called on every render (which can be a lot) so it's best to have this stuff inside of a hook like useEffect so that it only updates when the dependencies change
useEffect(() => {
  setWarning(issues);
}, [issues]);
subgraphs/dashboard/src/interfaces/ProtocolDashboard.tsx
Lines 38 to 45 in 90d12a3
Don't forget the dependency array for the use effect
subgraphs/dashboard/src/interfaces/ProtocolDashboard.tsx
Lines 126 to 128 in 90d12a3
This is a good candidate for pulling this logic out into a new component. You're using a useMemo in order to prevent rendering when no data changes have happened but react already handles a lot of this when you put things into components with props. (there are cases where you might want to wrap a component in a memo but for the most part react won't re-render a component if it's props haven't changed.)
subgraphs/dashboard/src/interfaces/ProtocolDashboard.tsx
Lines 144 to 145 in 90d12a3
subgraphs/dashboard/src/interfaces/ProtocolDashboard.tsx
Lines 229 to 244 in 90d12a3
Each Aave market has a treasury contract, which collects a portion of protocol interest in the form of aTokens. Treasury data is not included in the Aave protocol subgraph, so it needs to be added to the mapping. The treasury logic works a bit differently in V2 and V3.
V2: aTokens are automatically transferred to the collector contracts, so summing the aToken balances will give the entire balance.
V2 Collectors:
Eth Mainnet V2/AMM/ARC: 0x464c71f6c2f760dda6093dcb91c24c39e5d6e18c (shared contract)
Polygon V2: 0x7734280A4337F37Fbf4651073Db7c28C80B339e9
Avalanche V2: 0x467b92aF281d14cB6809913AD016a607b5ba8A36
V3: aTokens must be pulled into the treasury contract by calling the mintToTreasury function on the Pool contract. There's a field on each reserve called accruedToTreasury which tracks the unminted amounts (not currently on the subgraph but I'll update this issue once it's added). So the treasury total is the aToken balances of the contracts below + accruedToTreasury for each reserve.
V3 Collectors:
Optimism V3: 0xA77E4A084d7d4f064E326C0F6c0aCefd47A5Cb21
Arbitrum V3: 0xC3301b30f4EcBfd59dE0d74e89690C1a70C6f21B
Polygon V3: 0x73D435AFc15e35A9aC63B2a81B5AA54f974eadFe
Harmony V3: 0xeaC16519923774Fd7723d3D5E442a1e2E46BA962 (not supported by TheGraph yet)
Fantom V3: 0xc0F0cFBbd0382BcE3B93234E4BFb31b2aaBE36aD
Avalanche V3: 0xaCbE7d574EF8dC39435577eb638167Aca74F79f0
Currently the Liquidate entity in the lending schema follows the same structure as other events, though it has additional info that we might want to capture.
For reference, here are some liquidation events from different lending protocols:
  /**
   * @dev Emitted when a borrower is liquidated. This event is emitted by the LendingPool via
   * LendingPoolCollateral manager using a DELEGATECALL
   * This allows to have the events in the generated ABI for LendingPool.
   * @param collateralAsset The address of the underlying asset used as collateral, to receive as result of the liquidation
   * @param debtAsset The address of the underlying borrowed asset to be repaid with the liquidation
   * @param user The address of the borrower getting liquidated
   * @param debtToCover The debt amount of borrowed `asset` the liquidator wants to cover
   * @param liquidatedCollateralAmount The amount of collateral received by the liiquidator
   * @param liquidator The address of the liquidator
   * @param receiveAToken `true` if the liquidators wants to receive the collateral aTokens, `false` if he wants
   * to receive the underlying collateral asset directly
   **/
  event LiquidationCall(
    address indexed collateralAsset,
    address indexed debtAsset,
    address indexed user,
    uint256 debtToCover,
    uint256 liquidatedCollateralAmount,
    address liquidator,
    bool receiveAToken
); /**
* @notice Event emitted when a borrow is liquidated
*/
event LiquidateBorrow(
address liquidator,
address borrower,
uint repayAmount,
address cTokenCollateral,
uint seizeTokens
);event Liquidation(
uint _liquidatedDebt,
uint _liquidatedColl,
uint _collGasCompensation,
uint _LUSDGasCompensation
);event LogRemoveCollateral(
address indexed from,
address indexed to,
uint256 share
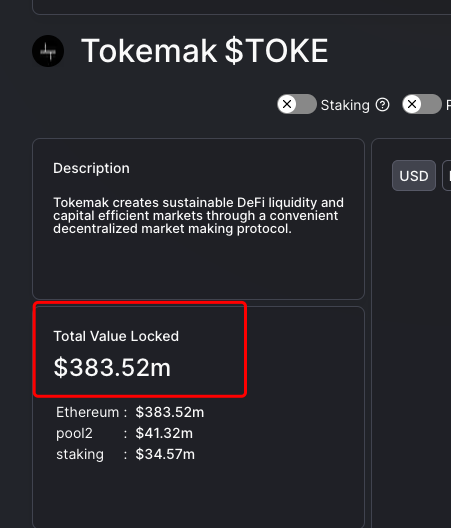
);Metrics that need fixing: TVL, dailySupplySideRevenue, cumSupplySideRevenue, totalBorrowBalance, dailyLiquidate
Notes: For the most part the shapes of the curves are OK, but due to differences in the way we calculate the price of ETH and other tokens throughout time, the numbers are off. Also, the way TVL is calculated needs to be updated from TVL = Supply to TV = Supply - Borrow (to account for looping).
Full Details (must check all tabs): https://docs.google.com/spreadsheets/d/1ggvXIIHklcwn9GeqTvtI6VN3KiRg1LSjOA5rMNTVt1A/edit#gid=617964580
One of the curve mappings calls Fantom's config twice instead of Arbitrum's so an unexpected null wasm error is thrown:
Handler skipped due to execution failure, error: Mapping aborted at src/prices/routers/CurveRouter.ts, line 56, column 7, with message: unexpected null wasm backtrace: 0: 0xaf44 - <unknown>!src/prices/routers/UniswapRouter/getLpTokenTotalLiquidityUsdc 1: 0xc0f8 - <unknown>!generated/schema/Market#get:outputTokenSupply 2: 0xc5aa - <unknown>!../src/mapping/updateProtocol 3: 0xd826 - <unknown>!src/mappings/handleNewFuseFee , handler: handleAccrueInterest
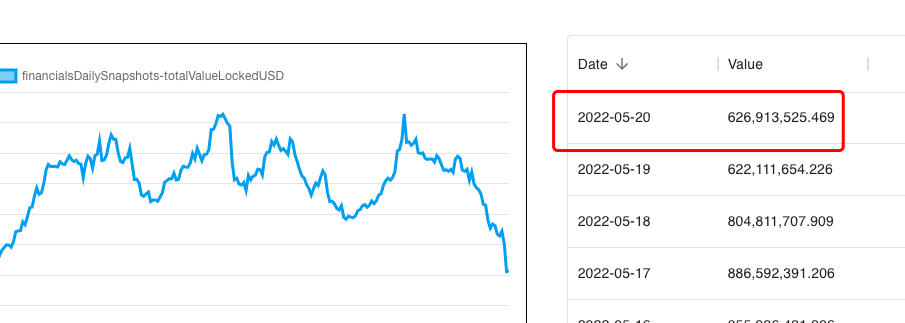
rewardTokenEmissions seem to be too high. Emissions are supposed to be normalized to a day, looks like it is normalized to a year.

See visualizer graph here
In the protocol interface, usageMetrics should be dailyUsageMetrics. Otherwise the DexAmmProtocol will not fit the interface.

We can avoid a contract call by using AccrueInterest's variable totalBorrows to update our market's total borrow amount.
fixed_term to fixed
These errors show up when I built the subgraph. These are most likely due to these fields not being marked as required in the schema, and they are used in the program without either checking if null or asserting not null with '!'. I tried to fix these issue for deployment by adding the exclamation, however, the deployment still failed when I tried to deploy to Messari Hosted service.
The aurigami subgraph is producing an error that likely due to issue with the graph protocol. See an example of the issue at this deployment
{
  "data": {
    "subgraphLogs": [
      {
        "timestamp": "2022-06-18T02:32:49.197558799Z",
        "text": "Subgraph failed with non-deterministic error: failed to process trigger: block #61007515 (0x8a70…09de), transaction 276c3690a9721a11a01eba68381f647e987bf56313c21d9dd97f03419c3e1164: Found no transaction for event, retry_delay_s: 1800, attempt: 113"
      },
      {
        "timestamp": "2022-06-18T02:02:48.011653336Z",
        "text": "Subgraph failed with non-deterministic error: failed to process trigger: block #61007515 (0x8a70…09de), transaction 276c3690a9721a11a01eba68381f647e987bf56313c21d9dd97f03419c3e1164: Found no transaction for event, retry_delay_s: 1800, attempt: 112"
      }
    ]
  }
}
| Description | Value |
|---|---|
| Subgraph Reviewed | https://subgraphs.messari.io/subgraph?endpoint=https://api.thegraph.com/subgraphs/name/sevenshi/balancer-v2-ethereum&tab=protocol |
| Date Reviewed | June 16 2022 |
| Schema Version | 1.3.0 |
| Subgraph Version | 1.1.0 |
| Methodology Version | 1.0.0 |
| Evidence Spreadsheet | https://docs.google.com/spreadsheets/d/1rsxig-eZHN7Nrq-VXWz2CtWrEcoXwSgMt3VUuJCd8fk/edit?usp=sharing |
Protocol Metrics
| Section | Metric | Issue |
|---|---|---|
| financialsDailySnapshots | dailyVolumeUSD | Big spikes in volume on 5/22 |
| financialsDailySnapshots | cumulativeVolumeUSD | Daily is off, so cumulative will also be |
| financialsDailySnapshots | dailySupplySideRevenueUSD | Big spike on 5/22 and values looking off across the board |
| financialsDailySnapshots | cumulativeSupplySideRevenueUSD | Daily is off, so cumulative will also be. Supply and Protocol are also equivalent, which should not be the case. |
| financialsDailySnapshots | dailyProtocolSideRevenueUSD | Big spike on 5/22 and values looking off across the board |
| financialsDailySnapshots | cumulativeProtocolSideRevenueUSD | Daily is off, so cumulative will also be |
| financialsDailySnapshots | dailyTotalRevenueUSD | Big Spike in revenue that looks off on 5/22 |
| financialsDailySnapshots | cumulativeTotalRevenueUSD | Daily is off, so cumulative will also be |
Pool Overview Metrics
| Pool | Metric | Issue |
|---|---|---|
| Balancer 80 BAL 20 WETH | Base Yield % | 775% when its like 13% on Balancer UI |
| AKITA Copper Launch | TVL (USD) | Huge TVL number that doesn't look right |
| AKITA Copper Launch | Base Yield % | 17.75% when it is like 1% on Balancer UI |
| Balancer 80 AURA 20 WETH | Base Yield % | 23% when Balancer UI is 161% |
Pool Metrics
| Pool | Section | Metric | Issue |
|---|---|---|---|
| Balancer 80 BAL 20 WETH | liquidityPoolDailySnapshots | dailySupplySideRevenueUSD | Outputting 0 |
| Balancer 80 BAL 20 WETH | liquidityPoolDailySnapshots | cumulativeSupplySideRevenueUSD | Looks too low |
| Balancer 80 BAL 20 WETH | liquidityPoolDailySnapshots | dailyProtocolSideRevenueUSD | Outputting 0 |
| Balancer 80 BAL 20 WETH | liquidityPoolDailySnapshots | cumulativeProtocolSideRevenueUSD | Looks too low |
| Balancer 80 BAL 20 WETH | liquidityPoolDailySnapshots | dailyTotalRevenueUSD | Outputting 0 |
| Balancer 80 BAL 20 WETH | liquidityPoolDailySnapshots | cumulativeTotalRevenueUSD | Numbers look to be in the right ball park, but does not seem like the correct daily is being added everyday |
| Balancer 80 BAL 20 WETH | liquidityPoolDailySnapshots | dailyVolumeByTokenUSD - BAL | Does not look the price is being applied here. Values are too small |
| Balancer 80 BAL 20 WETH | liquidityPoolDailySnapshots | dailyVolumeByTokenUSD - WETH | Same as above |
| Balancer 80 BAL 20 WETH | liquidityPoolDailySnapshots | outputTokenSupply B-80BAL-20WETH | Outputting 0 |
| Balancer 80 BAL 20 WETH | liquidityPoolDailySnapshots | outputTokenPriceUSD B-80BAL-20WETH | Outputting 0 |
| Balancer 80 BAL 20 WETH | liquidityPoolDailySnapshots | baseYield | 0.9% on Subgraph and Balancer UI reporting 9% |
| Balancer 80 BAL 20 WETH | liquidityPoolHourlySnapshots | hourlySupplySideRevenueUSD | Same problems as daily |
| Balancer 80 BAL 20 WETH | liquidityPoolHourlySnapshots | cumulativeSupplySideRevenueUSD | Same problems as daily |
| Balancer 80 BAL 20 WETH | liquidityPoolHourlySnapshots | hourlyProtocolSideRevenueUSD | Same problems as daily |
| Balancer 80 BAL 20 WETH | liquidityPoolHourlySnapshots | cumulativeProtocolSideRevenueUSD | Same problems as daily |
| Balancer 80 BAL 20 WETH | liquidityPoolHourlySnapshots | hourlyTotalRevenueUSD | Same problems as daily |
| Balancer 80 BAL 20 WETH | liquidityPoolHourlySnapshots | cumulativeTotalRevenueUSD | Same problems as daily |
| Balancer 80 BAL 20 WETH | liquidityPoolHourlySnapshots | hourlyVolumeByTokenUSD - BAL | Returning token amount and not USD value |
| Balancer 80 BAL 20 WETH | liquidityPoolHourlySnapshots | hourlyVolumeByTokenUSD - WETH | Returning token amount and not USD value |
| Balancer 80 BAL 20 WETH | liquidityPoolHourlySnapshots | outputTokenSupply B-80BAL-20WETH | Outputting 0 |
| Balancer 80 BAL 20 WETH | liquidityPoolHourlySnapshots | outputTokenPriceUSD B-80BAL-20WETH | Outputting 0 |
| Balancer 80 BAL 20 WETH | liquidityPoolHourlySnapshots | baseYield | This doesn't look right because Balancer UI is saying 9% for this pool, so the hourly values should average around 9% |
Protocol Metrics in need of review: totalValueLockedUSD
Pool-level Metrics in need of review: totalValueLockedUSD, totalDepositBalanceUSD, rewardTokenEmissionsAmount
Full QA: https://docs.google.com/spreadsheets/d/1M2fqfxVm1ZozNESOdkQbfyM60grl9YMCPO1u3eylo54/edit?usp=sharing
market.canUseAsCollateral cannot be moved back to true once moved to false.
Sample query to see behavior:
query MyQuery { markets { id name canBorrowFrom canUseAsCollateral isActive _reserveFactor rates { id rate } } }
If a transaction contains a function-scoped revert, trace_transaction fails to calculate the output of the subtraces after the revert that are part of the same transaction. It also seems to be setting gasUsed to 0 for all traces after the revert. This issue applies to the other tracing calls as well.
Ref Issue: Fantom-foundation/go-opera#288
Subgraph URL - https://thegraph.com/hosted-service/subgraph/messari/yearn-v2-fantom
Subgraph failed with non-deterministic error: failed to process trigger: block #21041413 (0x0000…b378), transaction
a44fa1857fa5448419ff94682de1ffeccaa74eb0d6dc9d0de8fe37c6c2a90746: Decoding function outputs for the call
Function { name: "withdraw", inputs: [], outputs: [Param { name: "", kind: Uint(256), internal_type: None }],
constant: None, state_mutability: NonPayable } failed, raw output: : Invalid name: please ensure the contract
 and method you're calling exist! failed to decode empty bytes. if you're using jsonrpc this is likely due to
jsonrpc returning `0x` in case contract or method don't exist
There's a data issue with CREAM BSC subgraph.
The various values returned by the market / marketsnapshots are negative which should not happen.
Market id: "0xbf9b95b78bc42f6cf53ff2a0ce19d607cfe1ff82"

The chart on the Messari dashboard shows the rates are fixed throughout historical snapshots. But they should be changing over time (see rates on Compound).

Problem occurs for both the hourly and daily snapshots.
Replicate with the query:
{
  markets(
      first:1
      orderBy:totalValueLockedUSD
      orderDirection:desc
  ) {
      name
      dailySnapshots (
          first: 5
          orderDirection: desc
          orderBy: timestamp
      ) {
          blockNumber
          timestamp

          # Below should change over time but do not
          rates(orderBy:id) {
            id
            rate
          }
      }
  }
}
A declarative, efficient, and flexible JavaScript library for building user interfaces.
🖖 Vue.js is a progressive, incrementally-adoptable JavaScript framework for building UI on the web.
TypeScript is a superset of JavaScript that compiles to clean JavaScript output.
An Open Source Machine Learning Framework for Everyone
The Web framework for perfectionists with deadlines.
A PHP framework for web artisans
Bring data to life with SVG, Canvas and HTML. 📊📈🎉
JavaScript (JS) is a lightweight interpreted programming language with first-class functions.
Some thing interesting about web. New door for the world.
A server is a program made to process requests and deliver data to clients.
Machine learning is a way of modeling and interpreting data that allows a piece of software to respond intelligently.
Some thing interesting about visualization, use data art
Some thing interesting about game, make everyone happy.
We are working to build community through open source technology. NB: members must have two-factor auth.
Open source projects and samples from Microsoft.
Google ❤️ Open Source for everyone.
Alibaba Open Source for everyone
Data-Driven Documents codes.
China tencent open source team.

