GithubHelp home page GithubHelp logo

metrico / qryn Goto Github PK

View Code? Open in Web Editor NEW
945.0 14.0 59.0 56.56 MB

Lightweight, Polyglot, Snap-on Observability Stack. Drop-in Compatible with Loki, Prometheus, Tempo, Pyroscope, Opentelemetry and more! Vendor independent LGTM replacement and Splunk/Datadog/Elastic alternative! WASM powered ⭐️ Star to Support

Home Page: https://qryn.dev

License: GNU Affero General Public License v3.0

Dockerfile 0.03% JavaScript 91.71% Shell 0.39% HTML 0.08% Go 6.04% Makefile 0.01% Rust 1.75%
loki grafana prometheus clickhouse logql timeseries metrics logs promql tempo

qryn's Introduction

CI+CD CodeQL GitHub Repo stars


🚀 lighweight, multi-standard, polyglot observability stack for Logs, Metrics, Traces and Profiling

... it's pronounced /ˈkwɪr..ɪŋ/ or just querying

  • Polyglot: All-in-one, Drop-in compatible with Loki, Prometheus, Tempo, Pyroscope
  • Lightweight: Powered by Bun - the fast, all-in-one JavaScript runtime + ClickHouse OLAP Engine
  • Familiar: Use stable & popular LogQL, PromQL, TempoQL languages to query and visualize data
  • Voracious: Ingest using Opentelemetry, Loki, Prometheus, Tempo, Influx, Datadog, Elastic + more
  • Versatile: Explore data with qryn's built-in Explorer and CLI or native Grafana datasource compatibility
  • Secure: Retain total control of data, using ClickHouse, DuckDB or InfluxDB IOx with S3 object storage
  • Indepentent: Opensource, Community powered, Anti lock-in alternative to Vendor controlled stacks

lgtm_vs_qryn


Features

💡 qryn independently implements popular observability standards, protocols and query languages


👁️ Built-In Explorer

qryn ships with view - our zero dependency, lightweight data explorer for Logs, Metrics and Traces


➡️ Ingest

📚 OpenTelemetry

qryn is officially integrated with opentelemetry supports any log, trace or metric format
Ingested data can be queried using any of the avialable qryn APIs (LogQL, PromQL, TraceQL)

💡 No modifications required to your opentelemetry instrumentation!

📚 Native

qryn supports native ingestion for Loki, Prometheus, Tempo/Zipkin and many other protocols
With qryn users can push data using any combination of supported APIs and formats

💡 No opentelemetry or any other middlewayre/proxy required!


⬅️ Query

📚 Loki + LogQL

Any Loki compatible client or application can be used with qryn out of the box
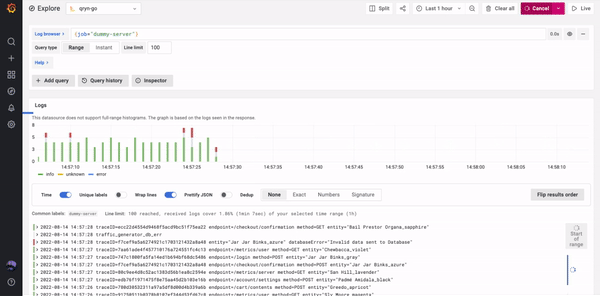
qryn implements the Loki API for transparent compatibility with LogQL clients

The Grafana Loki datasource can be used to natively browse and query logs and display extracted timeseries

🎉 No plugins needed
👁️ No Grafana? No problem! Use View


📈 Prometheus + PromQL

Any Prometheus compatible client or application can be used with qryn out of the box

qryn implements the Prometheus API for transparent PromQL compatibility using WASM 🏆

The Grafana Prometheus datasource can be used to natively to query metrics and display timeseries

🎉 No plugins needed
👁️ No Grafana? No problem! Use View


🕛 Tempo + TraceQL

qryn implements the Tempo API for transparent compatibility with TraceQL clients.

Any Tempo/Opentelemetry compatible client or application can be used with qryn out of the box

The Tempo datasource can be used to natively query traces including TraceQL and supporting service graphs

🎉 No plugins needed
👁️ No Grafana? No problem! Use View


🔥 Pyroscope + Phlare

qryn implements the Pyroscope/Phlare API for transparent compatibility with Pyroscope SDK clients.

Any Pyroscope SDK client or Pyroscope compatible agent can be used with qryn out of the box for continuous profiling


📚 Vendors Compatibility

qryn can ingest data using formats from Grafana, InfluxDB, DataDog, Elastic and other vendors.


With qryn and grafana everything just works right out of the box:

  • Native datasource support without any plugin or extension
  • Advanced Correlation between Logs, Metrics and Traces
  • Service Graphs and Service Status Panels, and all the cool features


📚 Follow our team behind the scenes on the qryn blog


Contributions

Whether it's code, documentation or grammar, we ❤️ all contributions. Not sure where to get started?

  • Join our Matrix Channel, and ask us any questions.
  • Have a PR or idea? Request a session / code walkthrough with our team for guidance.

Contributors

    Contributors for @metrico/qryn

Stargazers repo roster for @metrico/qryn

Forkers repo roster for @metrico/qryn

License

©️ QXIP BV, released under the GNU Affero General Public License v3.0. See LICENSE for details.

qryn's People

Contributors

akvlad avatar alexey-milovidov avatar cluas avatar danjenkins avatar deathalt avatar dependabot[bot] avatar diamondy4 avatar dletta avatar gh-action-bump-version avatar lansio avatar lmangani avatar mikhno-s avatar shawel avatar sonirico avatar tomershafir avatar tsearle avatar

Stargazers

 avatar  avatar  avatar  avatar  avatar  avatar  avatar  avatar  avatar  avatar  avatar  avatar  avatar  avatar  avatar  avatar  avatar  avatar  avatar  avatar  avatar  avatar  avatar  avatar  avatar  avatar  avatar  avatar  avatar  avatar  avatar  avatar  avatar  avatar  avatar  avatar  avatar  avatar  avatar  avatar  avatar  avatar  avatar  avatar  avatar  avatar  avatar  avatar  avatar  avatar  avatar  avatar  avatar  avatar  avatar  avatar  avatar  avatar  avatar  avatar  avatar  avatar  avatar  avatar  avatar  avatar  avatar  avatar  avatar  avatar  avatar  avatar  avatar  avatar  avatar  avatar  avatar  avatar  avatar  avatar  avatar  avatar  avatar  avatar  avatar  avatar  avatar  avatar  avatar  avatar  avatar  avatar  avatar  avatar  avatar  avatar  avatar  avatar  avatar  avatar

Watchers

 avatar  avatar  avatar  avatar  avatar  avatar  avatar  avatar  avatar  avatar  avatar  avatar  avatar  avatar

qryn's Issues

JS Linting

Add Linting for ease of collaboration with contributors and to keep a commong style.

Possibility to specify several rules for ttl.

Sometimes different types of logs require different retention periods. (Or eviction to cold storage).
To do this, it need the ability to distribute data across partitions over some subset of labels.

For example, I want to delete logs with a debug level in a couple of days, and keep all the rest much longer.
Or another example, I would like to move logs with some set of labels that can provide analytical value to cold storage volume (S3 drive type ).

related issue #75

Benchmark Performance

We would like to benchmark the current (and potential) performance of cLoki to find and eliminate any bottlenecks on its way to Clickhouse.

If anyone is willing to help or lead this effort, please attach to this issue :)

Loki 2.0: Matrix support for Charting

Loki 2.0 introduces the matrix response format to display timeseries.

Our plan is to implement a custom Clickhouse query format exclusive to cLoki/cLoki-go to perform raw and templated clickhouse queries, response compatible with Loki 2.0 API.

Analysis

Request

sum by (status)
  (rate(
     {job="systemd-journal",unit="grafana-server.service"} 
     | logfmt [1m]
  )
)

Query

direction=BACKWARD&limit=1000&query=sum by (status)
  (rate({job="systemd-journal",unit="grafana-server.service"} | logfmt [1m]))&start=1605612061000000000&end=1605612329000000000&step=1

Response

{
  "status": "success",
  "data": {
    "resultType": "matrix",
    "result": [
      {
        "metric": {},
        "values": [
          [
            1605612212,
            "0.08333333333333333"
          ],
          [
            1605612213,
            "0.08333333333333333"
          ]
        ]
      },
      {
        "metric": {
          "status": "302"
        },
        "values": [
          [
            1605612212,
            "0.03333333333333333"
          ],
          [
            1605612213,
            "0.03333333333333333"
          ]
        ]
      },
      {
        "metric": {
          "status": "401"
        },
        "values": [
          [
            1605612212,
            "0.06666666666666667"
          ],
          [
            1605612213,
            "0.06666666666666667"
          ]
        ]
      }
    ]
  }
}

Clickhouse Query Equivalent

Clickhouse query for timeseries at 60s resolution

SELECT source_ip, groupArray((t, c)) AS groupArr FROM ( 
    SELECT (intDiv(toUInt32(record_datetime), 60) * 60) * 1000 AS t, source_ip, sum(mos) c 
    FROM hepic_data.sip_transaction_call WHERE record_datetime >= toDateTime(1605603182) 
    GROUP BY t, source_ip 
    ORDER BY t, source_ip) 
GROUP BY source_ip
ORDER BY source_ip

how to create table “settings”

I use k8s deploy cLoki. when it begin to run, I get a error:
{"level":50,"time":1652663995707,"pid":19,"hostname":"cloki-76c77bc778-ps6tp","name":"cloki","err":"Error: Request failed with status code 404\nResponse: [404] Code: 60, e.displayText() = DB::Exception: Table loki.settings doesn't exist (version 21.1.3.32)\n\nError: Request failed with status code 404\n at createError (/app/node_modules/axios/lib/core/createError.js:16:15)\n at settle (/app/node_modules/axios/lib/core/settle.js:17:12)\n at IncomingMessage.handleStreamEnd (/app/node_modules/axios/lib/adapters/http.js:269:11)\n at IncomingMessage.emit (events.js:412:35)\n at endReadableNT (internal/streams/readable.js:1334:12)\n at processTicksAndRejections (internal/process/task_queues.js:82:21)","msg":"Error starting cloki"}
how to do with it?

Use skip index for labels

In this case, the index type 'tokenbf_v1' is suitable.
Before extracting the field from a json object, it need to check the presence of the key or the value using the hasToken function.
It also need to pay attention that word breaks are not allowed in tokens for indexing.

Question: How's timestamp ordering handled

This is more of a question, than a bug report.

I'm curious how Out of Order Timestamp events are handled in cLoki. Recently, Grafana Loki 2.4 release came with a feature that by default enables to send the stream in any order, as long as it's recent than the chunk max age.

I saw a few out of order event errors in my vector pipeline and I'm curious is that still a restriction in cLoki? For Loki, from what I understood it was because of their architecture of chunk/index store, but do we have this restrictions even with Clickhouse storage backend?

Thanks 👍

Replication support

Hi,

is replication support planned?

In theory it should be possible to replace engines here to be Replicated* and it should just work.

Documentation also mentions distributed(), but it's not clear how that's supposed to work

Fingerprinting hashing algorimth is prone to collisions

After ingesting logs from the k8s cluster for quite some time I've noticed some strange results. When I was querying for one specific label, I was getting results which should clearly belong to a completely different one.

Some digging showed that the problem is collision:


┌───────date─┬─fingerprint─┬─hex(MD5(labels))─────────────────┐
│ 2022-02-09 │   523712935 │ A2494F27CF46F29BCD88809CE8267F23 │
│ 2022-02-04 │   523712935 │ 57F427CE06BD67AC5E45BF62F94A5177 │
└────────────┴─────────────┴──────────────────────────────────┘

This is the current fingerprinting code:

https://github.com/lmangani/cLoki/blob/c40d1d9664523e60964a8d0b9338575c0a6d4720/lib/utils.js#L21-L26

It goes all the way here:

https://github.com/MatthewBarker/hash-string/blob/master/source/hash-string.js#L6-L16

It looks to me it's very suboptimal, since very fast, efficient, and much less prone for collisions hashes do exist. For example, xxHash64, also available in js: https://www.npmjs.com/package/xxhashjs.

Heap out of memory when using Grafana's live mode

Hi, first of all, this is a great project, I would love to use this project in production, but there is a OOM case when I use it.

When I using "Live mode" on Grafana Loki Explore, the qryn container's memory will keep increasing, and when I stop the live mode, the memory will be free after about 2 minutes.

Not in live mode:

CONTAINER ID   NAME           CPU %     MEM USAGE / LIMIT     MEM %     NET I/O           BLOCK I/O         PIDS
fd365e6ae9c9   vector         3.92%     39.39MiB / 7.603GiB   0.51%     301MB / 294MB     37.8MB / 0B       10
bcaf3bb151f0   loki-adapter   4.01%     97.18MiB / 7.603GiB   1.25%     1.24GB / 608MB    7MB / 123kB       24

In live mode about 5 minutes:

CONTAINER ID   NAME           CPU %     MEM USAGE / LIMIT     MEM %     NET I/O           BLOCK I/O         PIDS
fd365e6ae9c9   vector         1.94%     41.48MiB / 7.603GiB   0.53%     315MB / 308MB     37.8MB / 0B       10
bcaf3bb151f0   loki-adapter   43.30%    1.145GiB / 7.603GiB   15.07%    1.81GB / 630MB    7MB / 123kB       24

qryn's log when OOM:

<--- Last few GCs --->

[26:0x608cd40]  8788818 ms: Scavenge (reduce) 2039.2 (2048.0) -> 2038.4 (2048.0) MB, 10.4 / 0.0 ms  (average mu = 0.378, current mu = 0.406) allocation failure 
[26:0x608cd40]  8788883 ms: Scavenge (reduce) 2039.3 (2045.0) -> 2038.5 (2046.0) MB, 14.2 / 0.0 ms  (average mu = 0.378, current mu = 0.406) allocation failure 
[26:0x608cd40]  8788900 ms: Scavenge (reduce) 2039.3 (2045.0) -> 2038.5 (2046.2) MB, 8.5 / 0.0 ms  (average mu = 0.378, current mu = 0.406) task 


<--- JS stacktrace --->

FATAL ERROR: Ineffective mark-compacts near heap limit Allocation failed - JavaScript heap out of memory
 1: 0xa3aaf0 node::Abort() [node]
 2: 0x970199 node::FatalError(char const*, char const*) [node]
 3: 0xbba42e v8::Utils::ReportOOMFailure(v8::internal::Isolate*, char const*, bool) [node]
 4: 0xbba7a7 v8::internal::V8::FatalProcessOutOfMemory(v8::internal::Isolate*, char const*, bool) [node]
 5: 0xd769c5  [node]
 6: 0xd7754f  [node]
 7: 0xd8538b v8::internal::Heap::CollectGarbage(v8::internal::AllocationSpace, v8::internal::GarbageCollectionReason, v8::GCCallbackFlags) [node]
 8: 0xd868d7 v8::internal::Heap::FinalizeIncrementalMarkingIfComplete(v8::internal::GarbageCollectionReason) [node]
 9: 0xd8acd2 v8::internal::IncrementalMarkingJob::Task::RunInternal() [node]
10: 0xcae38b non-virtual thunk to v8::internal::CancelableTask::Run() [node]
11: 0xaa98b4 node::PerIsolatePlatformData::RunForegroundTask(std::unique_ptr<v8::Task, std::default_delete<v8::Task> >) [node]
12: 0xaab719 node::PerIsolatePlatformData::FlushForegroundTasksInternal() [node]
13: 0x13c0a86  [node]
14: 0x13d2ff4  [node]
15: 0x13c13d8 uv_run [node]
16: 0xa7b642 node::NodeMainInstance::Run() [node]
17: 0xa03805 node::Start(int, char**) [node]
18: 0x7fd1f56e42e1 __libc_start_main [/lib/x86_64-linux-gnu/libc.so.6]
19: 0x98c58c  [node]
Aborted (core dumped)
npm ERR! code ELIFECYCLE
npm ERR! errno 134
npm ERR! [email protected] start: `node qryn.js`
npm ERR! Exit status 134
npm ERR! 
npm ERR! Failed at the [email protected] start script.
npm ERR! This is probably not a problem with npm. There is likely additional logging output above.

npm ERR! A complete log of this run can be found in:
npm ERR!     /root/.npm/_logs/2022-06-24T11_06_29_741Z-debug.log
root@e68633271aff:/app# cat /root/.npm/_logs/2022-06-24T11_06_29_741Z-debug.log
0 info it worked if it ends with ok
1 verbose cli [ '/usr/local/bin/node', '/usr/local/bin/npm', 'start' ]
2 info using [email protected]
3 info using [email protected]
4 verbose run-script [ 'prestart', 'start', 'poststart' ]
5 info lifecycle [email protected]~prestart: [email protected]
6 info lifecycle [email protected]~start: [email protected]
7 verbose lifecycle [email protected]~start: unsafe-perm in lifecycle true
8 verbose lifecycle [email protected]~start: PATH: /usr/local/lib/node_modules/npm/node_modules/npm-lifecycle/node-gyp-bin:/app/node_modules/.bin:/usr/local/sbin:/usr/local/bin:/usr/sbin:/usr/bin:/sbin:/bin
9 verbose lifecycle [email protected]~start: CWD: /app
10 silly lifecycle [email protected]~start: Args: [ '-c', 'node qryn.js' ]
11 silly lifecycle [email protected]~start: Returned: code: 134  signal: null
12 info lifecycle [email protected]~start: Failed to exec start script
13 verbose stack Error: [email protected] start: `node qryn.js`
13 verbose stack Exit status 134
13 verbose stack     at EventEmitter.<anonymous> (/usr/local/lib/node_modules/npm/node_modules/npm-lifecycle/index.js:332:16)
13 verbose stack     at EventEmitter.emit (events.js:400:28)
13 verbose stack     at ChildProcess.<anonymous> (/usr/local/lib/node_modules/npm/node_modules/npm-lifecycle/lib/spawn.js:55:14)
13 verbose stack     at ChildProcess.emit (events.js:400:28)
13 verbose stack     at maybeClose (internal/child_process.js:1088:16)
13 verbose stack     at Process.ChildProcess._handle.onexit (internal/child_process.js:296:5)
14 verbose pkgid [email protected]
15 verbose cwd /app
16 verbose Linux 3.10.0-1160.el7.x86_64
17 verbose argv "/usr/local/bin/node" "/usr/local/bin/npm" "start"
18 verbose node v14.19.3
19 verbose npm  v6.14.17
20 error code ELIFECYCLE
21 error errno 134
22 error [email protected] start: `node qryn.js`
22 error Exit status 134
23 error Failed at the [email protected] start script.
23 error This is probably not a problem with npm. There is likely additional logging output above.
24 verbose exit [ 134, true ]

Query result duplication

Hi,

just found a new issue :) Looks like query results are duplicated (in some cases?). Here's a query which cloki generated:


WITH
    str_sel AS
    (
        SELECT DISTINCT fingerprint
        FROM cloki.time_series
        WHERE (JSONHas(labels, 'pod_namespace') = 1) AND (JSONExtractString(labels, 'pod_namespace') = 'impression-notifier-staging')
    ),
    sel_a AS
    (
        SELECT
            time_series.labels AS labels,
            samples.string AS string,
            samples.fingerprint AS fingerprint,
            samples.timestamp_ns AS timestamp_ns
        FROM cloki.samples_v3 AS samples
        LEFT JOIN cloki.time_series AS time_series ON samples.fingerprint = time_series.fingerprint
        WHERE ((samples.timestamp_ns >= 1649852884000000000) AND (samples.timestamp_ns <= 1649856485000000000)) AND (samples.fingerprint IN (
            SELECT fingerprint
            FROM str_sel
        )) AND (extractAllGroups(string, '(16E5768DBDF88309-53C83D0EA34C4CFA)') != []) AND (extractAllGroups(string, '(32000)') != [])
        ORDER BY
            timestamp_ns DESC,
            labels DESC
        LIMIT 1000
    )
SELECT *
FROM sel_a
ORDER BY
    labels DESC,
    timestamp_ns DESC
FORMAT JSONEachRow

Query id: 53729179-df41-459c-b711-2c565f3b8b25

{"labels":"{\"container_image\":\"...\",\"container_name\":\"impression-notifier\",\"level\":\"debug\",\"pod_namespace\":\"impression-notifier-staging\",\"pod_node_name\":\"kube38-63\",\"stream\":\"stderr\"}","string":"{\"container_id\":\"containerd:\/\/d133fc0303678286467a9643e08993801ccd4558c7df4cac48f52257c8a9184a\",\"file\":\"\/var\/log\/pods\/impression-notifier-staging_impression-notifier-staging-deployment-c80dda91-78d64b656c4z2tt_dcc24d17-637f-4f8d-a079-372e24273c8b\/impression-notifier\/0.log\",\"msg\":\"decoded report\",\"pod_ip\":\"...\",\"pod_ips\":[\"...\"],\"pod_labels\":{\"cdk8s.deployment\":\"impression-notifier-staging-Deployment-c888ef57\",\"pod-template-hash\":\"78d64b656c\"},\"pod_name\":\"impression-notifier-staging-deployment-c80dda91-78d64b656c4z2tt\",\"pod_uid\":\"dcc24d17-637f-4f8d-a079-372e24273c8b\",\"report\":{\"duration_ms\":4000,\"event_id\":\"47193\",\"session_id\":\"16E5768DBDF88309-53C83D0EA34C4CFA\",\"start_ms\":32000},\"source_type\":\"kubernetes_logs\",\"time\":\"2022-04-13T13:07:07Z\"}","fingerprint":"6434154905068867235","timestamp_ns":"1649855227871304633"}

3 rows in set. Elapsed: 0.192 sec. Processed 1.50 million rows, 67.88 MB (7.83 million rows/s., 353.36 MB/s.)

Here's a query I wrote which gets the same message. It is clear that there's only one row over there:

SELECT *
FROM samples_v3
WHERE (position(string, '16E5768DBDF88309-53C83D0EA34C4CFA') > 0) AND (position(string, '32000') > 0) AND (JSONExtractString(string, 'pod_name') = 'impression-notifier-staging-deployment-c80dda91-78d64b656c4z2tt')

Query id: cc911e5a-8c7a-4d9b-84f2-f9c3c46df073

┌─────────fingerprint─┬────────timestamp_ns─┬─value─┬─string─────────────────────────────────────────────────────────────────────────────────────────────────────────────────────────────────────────────────────────────────────────────────────────────────────────────────────────────────────────────────────┐
│ 6434154905068867235 │ 1649855227871304633 │     0 │ {"container_id":"containerd://d133fc0303678286467a9643e08993801ccd4558c7df4cac48f52257c8a9184a","file":"/var/log/pods/impression-notifier-staging_impression-notifier-staging-deployment-c80dda91-78d64b656c4z2tt_dcc24d17-637f-4f8d-a079-372e24273c8b/impression-notifier/0.log","msg":"decoded report","pod_ip":"...","pod_ips":["..."],"pod_labels":{"cdk8s.deployment":"impression-notifier-staging-Deployment-c888ef57","pod-template-hash":"78d64b656c"},"pod_name":"impression-notifier-staging-deployment-c80dda91-78d64b656c4z2tt","pod_uid":"dcc24d17-637f-4f8d-a079-372e24273c8b","report":{"duration_ms":4000,"event_id":"47193","session_id":"16E5768DBDF88309-53C83D0EA34C4CFA","start_ms":32000},"source_type":"kubernetes_logs","time":"2022-04-13T13:07:07Z"} │
└─────────────────────┴─────────────────────┴───────┴────────────────────────────────────────────────────────────────────────────────────────────────────────────────────────────────────────────────────────────────────────────────────────────────────────────────────────────────────────────────────────────┘

1 rows in set. Elapsed: 20.369 sec. Processed 359.86 million rows, 344.48 GB (17.67 million rows/s., 16.91 GB/s.)

cLoki - Live Update Mode

Problem

Live Update Mode is not yet implemented.

Goal / Solution / Example

Query: {type="call"}

  • Grafana expects a websocket to be opened based on the query path below
  • ws://grafana/api/datasources/proxy/24/loki/api/v1/tail?query=%7Btype%3D%22call%22%7D
  • The data that comes back from Loki (one line, but here prettified for reading
  •  { 
      "streams": [
        {
         "stream": {
          "duration":"0",
          "from_user":"311",
          "ruri_user":"00048177783344",
          "status":"8",
          "type":"call"
         },
      "values":[
        [
         "1631983284788000000",
         "USER_FAILURE 0 seconds call with 22177e4b-b394-4c54-8250-8ce5563d5c8b from [email protected] (193.46.255.223:47385) to 00048177783344@ (136.243.16.181:5060)"
        ]
       ]
      }
     ]
    }

Seems it is not much different in response as a normal query results, minus the 'overhead' or 'meta data' that we receive on the first answer. In the back Grafana gets the 'existing' data via http response and then opens the websocket for future update. (Seems like it sets up a watcher on backend (well of course how else))

Same labels produce different fingerprints

Hi,

we are running cLoki with HASH=xxhash64

and recently started receiving OOMs even on the most simple queries (5-minute ranges, for example).

It looks like there's something unhealthy going on with fingerprint duplication:

select
    uniq(fingerprint),
    uniq(arraySort(JSONExtractKeysAndValuesRaw(labels)))
from time_series
WHERE (JSONHas(labels, 'pod_namespace') = 1) AND (JSONExtractString(labels, 'pod_namespace') = '***')

┌─uniq(fingerprint)─┬─uniq(arraySort(JSONExtractKeysAndValuesRaw(labels)))─┐
│            556429 │                                                   32 │
└───────────────────┴──────────────────────────────────────────────────────┘

Same label sets keep producing vastly different fingerprints for some reasons now. Do you have any idea why it could happen?

Standardize Log Format

Set a standard Log Format for 'Debug' logs. To add value to logs during troubleshooting.

GO Port

We are actively porting cLoki to golang for performance and consolidation of features and to reach its full potential with Clickhouse. If you' d like to be part of this initiative as developer, designer or tester, please +1 or post a comment to this issue.

Thanks in advance!

Using cLoki with Distributed/Sharded Clickhouse

Firstly, great project and I'm having quite some fun playing around with this (and yes, we're all Clickhouse fans here) 😉


I was wondering how to get cLoki running in distributed Clickhouse mode. I have a cluster set up where I have manually set up master + N shards with master having the tables defined with ENGINE = Distributed in master and regular clustered ingestion/querying works fine.

Was wondering how I can get cLoki to work in this distributed/clustered environment. I see a wiki page which mentions a distributed schema, but nothing besides that anywhere in the project. Is support for this already present? I'd appreciate some pointers for this.

protobuf requests fail and return 500

It looks like req.raw inside the getContentBody function doesn't exist in the version of fastify that gets installed.

async function getContentBody (req) {
  let body = ''
  console.log('RAW', req.raw)
  req.raw.on('data', data => {
    console.log('raw on data', data)
    body += data.toString()
  })
  await new Promise(resolve => req.raw.once('end', resolve))
  console.log('body', body)
  return body
}

I turned on request logging in fastify and this was the output...

{"level":30,"time":1644099977093,"pid":30348,"hostname":"Dans-Macbook-Pro.local","reqId":"req-8","req":{"method":"POST","url":"/loki/api/v1/push","hostname":"[669ede663611.ngrok.io](http://669ede663611.ngrok.io/)","remoteAddress":"127.0.0.1","remotePort":61583},"msg":"incoming request"}
PARSING PROTOBUF
got content length
registered shaper
RAW undefined
{"level":30,"time":1644099977094,"pid":30348,"hostname":"Dans-Macbook-Pro.local","reqId":"req-8","res":{"statusCode":500},"responseTime":1.4465830326080322,"msg":"request completed"}

If you add the body argument to the function call then req.raw becomes available

  fastify.addContentTypeParser('application/x-protobuf', {},
    async function (req, origBody, done) {

But this then leads to more pain

you then get to let _data = await snappy.uncompress(body) throwing an error because body is a string because that's what you've passed back from getContentBody - I havent gone any further than this in debugging. it feels like the parsing shouldnt be creating a string form of the body at this point and letting the snappy function uncompress and the decode.... shrug

I've tried this with a docker container with a loki log driver directly and also promtail sending logs to cloki

Let me know where to send it if you want it... I also have a pcap that includes the http requests being made

To test, I pointed promtail and docker with loki log driver at an ngrok url, with cloki running locally using ngrok as a proxy and then cloki talking to clickhouse

if you'd like to me to point either docker or promtail at a cloki instance I'd be more than happy to

Unable to ingest events with up to date cLoki:latest docker image

Using logstash with logstash-output-loki plugin:

output {
  loki {
    url => "http://<REDACTED>:3100/loki/api/v1/push"
    message_field => "payload"
    batch_size => 1001024
  }
}

cLoki logs:
{"level":20,"time":1644311903345,"pid":20,"hostname":"8963e215248b","name":"cloki","reqId":"req-l","msg":"POST /loki/api/v1/push"}
{"level":30,"time":1644311903418,"pid":20,"hostname":"8963e215248b","name":"cloki","reqId":"req-l","res":{"statusCode":204},"responseTime":85.98648452758789,"msg":"request completed"}
{"level":30,"time":1644311903472,"pid":20,"hostname":"8963e215248b","name":"cloki","reqId":"req-m","req":{"method":"POST","url":"/loki/api/v1/push","hostname":"REDACTED:3100","remoteAddress":"10.202.108.131","remotePort":34545},"msg":"incoming request"}

For some reason I get 'statusCode:204' and looks like that's true since no events can be found in the db backend

With yesterday's image I'm able to ingest and see all the events. cLoki log looks like this:

POST /loki/api/v1/push
QUERY:  [Object: null prototype] {}
BODY:  {
  streams: [
    { stream: [Object], values: [Array] },
    { stream: [Object], values: [Array] },
     ......

Cluster/Replication

Hello, I'm using the following database schema to allow replication in my cluster
I don't know what i'm doing wrong but my tables are not replicated.
Any idea ?

CREATE DATABASE test on cluster loki_cluster ENGINE=Atomic;

CREATE TABLE IF NOT EXISTS test.time_series on cluster loki_cluster (date Date,fingerprint UInt64,labels String, name String)
ENGINE = ReplicatedReplacingMergeTree(date) PARTITION BY date ORDER BY fingerprint;

CREATE TABLE IF NOT EXISTS test.samples_v3 on cluster loki_cluster (
fingerprint UInt64,
timestamp_ns Int64 CODEC(DoubleDelta),
value Float64 CODEC(Gorilla),
string String
) ENGINE = ReplicatedMergeTree
PARTITION BY toStartOfDay(toDateTime(timestamp_ns / 1000000000))
ORDER BY (timestamp_ns);

CREATE TABLE IF NOT EXISTS test.samples_read on cluster loki_cluster
(fingerprint UInt64,timestamp_ms Int64,value Float64,string String)
ENGINE=ReplicatedMergeTree
ORDER BY timestamp_ms;

CREATE VIEW IF NOT EXISTS test.samples_read_v2_1 on cluster cloki_cluster AS
SELECT fingerprint, timestamp_ms * 1000000 as timestamp_ns, value, string FROM test.samples_read;

CREATE TABLE IF NOT EXISTS test.samples_read_v2_2 on cluster loki_cluster
(fingerprint UInt64,timestamp_ns Int64,value Float64,string String)
ENGINE=ReplicatedMergeTree
ORDER BY timestamp_ns;

Grafana 9: step parameter behaviour

The usage pattern for the step query parameter seems to have changed in Grafana 9.x switching to a time-unit-signed format to control the pixel to point resolution of visualised charts using the Resolution parameter. From the docs:

Resolution 1/1 sets step parameter of Loki metrics range queries such that each pixel corresponds to one data point. For better performance, lower resolutions can be picked. 1/2 only retrieves a data point for every other pixel, and 1/10 retrieves one data point per 10 pixels.

Grafana 8.x

/loki/api/v1/query_range?direction=BACKWARD&limit=1752&query=rate(%7Btype%3D%22prom%22%7D%5B1m%5D)&start=1656446049927000000&end=1656449649927000000&step=2"

Grafana 9.x

/loki/api/v1/query_range?direction=backward&end=1656448770349000000&limit=1000&query=rate%28%7Btype%3D%22prom%22%7D%5B1s%5D%29&start=1656445170349000000&step=2000ms

Issue

The step format change (2 vs 2000ms) results in excessive aggregation of time buckets in qryn 2.x

Assuming the 8.x format was expressed in seconds the new format should be scaled accordingly in the transpiler.

TLS/SSL error "unable to verify first certificate"

Hello, i have this error when i try to set TLS between clickhouse and cloki.
Before setting tls everything worked well.
Any idea please ?

loki | > [email protected] start /app loki | > node qryn.js loki | loki | {"level":30,"time":1657014852345,"pid":19,"hostname":"ringover","name":"qryn","msg":"Initializing DB... test"} loki | {"level":30,"time":1657014852576,"pid":19,"hostname":"ringover","name":"qryn","msg":"Server listening at http://172.30.102.243:3100"} loki | {"level":30,"time":1657014852576,"pid":19,"hostname":"ringover","name":"qryn","msg":"Qryn API up"} loki | {"level":30,"time":1657014852576,"pid":19,"hostname":"ringover","name":"qryn","msg":"Qryn API listening on http://172.30.102.243:3100"} loki | {"level":30,"time":1657014852579,"pid":19,"hostname":"ringover","name":"qryn","msg":"xxh ready"} loki | {"level":50,"time":1657014852582,"pid":19,"hostname":"ringover","name":"qryn","err":"unable to verify the first certificate\nError: unable to verify the first certificate\n at TLSSocket.onConnectSecure (_tls_wrap.js:1515:34)\n at TLSSocket.emit (events.js:400:28)\n at TLSSocket._finishInit (_tls_wrap.js:937:8)\n at TLSWrap.ssl.onhandshakedone (_tls_wrap.js:709:12)","msg":"Error starting qryn"} loki | npm ERR! code ELIFECYCLE loki | npm ERR! errno 1 loki | npm ERR! [email protected] start: node qryn.jsloki | npm ERR! Exit status 1 loki | npm ERR! loki | npm ERR! Failed at the [email protected] start script. loki | npm ERR! This is probably not a problem with npm. There is likely additional logging output above. loki | loki | npm ERR! A complete log of this run can be found in: loki | npm ERR! /root/.npm/_logs/2022-07-05T09_54_12_606Z-debug.log

cLoki line_format difference from Loki

Hi,

Is it intentional and if yes, then why there is a difference in cLoki line_format with a dot compared to Loki without a dot?

Loki: line_format "{{.labelname}}"
cLoki: line_format "{{labelname}}"

Feature: Add support for tenants

Would it be possible to add Multi-Tenancy support similar to https://grafana.com/docs/loki/latest/operations/multi-tenancy/ ?

The way I am thinking for this to work is:

  • Get the X-Org-ID header from request
  • Insert the logs to cloki_<tenant>.* tables (one db/tenant)

Loki actually uses a common Index store for all tenants, but chunk store is separated. We could follow the same or IMHO, a separate DB per tenant would provide more isolation.

Use DateTime64 type for store time

When at one moment it writes several lines of logs, then the accuracy in ms is not enough. In this case, the order of the lines may be violated.

The screenshot shows that the initial precision that the containerd provides is much more accurate, which allows you to maintain the order of the lines.

image

Telegraf Input for Metrics

cloki features basic supports for ingesting metrics from Telegraf HTTP output plugin:

Telegraf Configuration

[[outputs.http]]
  url = "http://cloki:3100/telegraf"
  data_format = "json"
  method = "POST"

Query Metrics

Logs and Metrics are stored in the same table.

The following query defaults to the cloki metrics and automatically uses fingerprints and metrics response:

sum by (cpu) (rate(value[60]))

image

The following | ts pipe is available to parse regular tag values to fingerprint statistics:

{cpu="cpu0"} | ts

ezgif com-gif-maker (1)

Everything is extremely beta and WIP. If anyone is interested in testing, please chain to this topic ;)

Question: How are label filters queried

Firstly, I wanna add a note that I hope you're not getting annoyed with the issues I've opened :) I really am enjoying using cLoki and just presenting some more minor feature additions etc in the hopes that it'll make it even better.

I'd a question about how Label Queries are implemented. (I read the docs and found that | json | my_field="<value>" is supported.

However, I am seeing a weird edge case in my logs.

My logs are in JSON and the behavior when I search for the fields is different

  • When I search for the field in a specific timestamp, where I know the query will match, I see the logs.
  • When I search for the entire day, and this record is present later in the day, I don't see any logs.

I did some debugging using Clickhouse Query logs and found that for both of the above queries, cLoki sends the same query to Clickhouse:

  • {job="app",source="haproxy"} | json | user="ABCD1234"
  • {job="app",source="haproxy"} | json

The query which is sent is:

query: WITH str_sel as ( SELECT DISTINCT fingerprint, labels FROM cloki.time_series  WHERE JSONHas(labels, 'job') AND JSONExtractString(labels, 'job') = 'app' AND JSONHas(labels, 'source') AND JSONExtractString(labels, 'source') = 'haproxy' ), sel_a as ( SELECT  str_sel.labels as labels, samples.string as string, samples.fingerprint as fingerprint, samples.timestamp_ms as timestamp_ms FROM cloki.samples_read as samples  LEFT JOIN str_sel ON samples.fingerprint = str_sel.fingerprint WHERE samples.fingerprint IN (SELECT fingerprint FROM str_sel) AND timestamp_ms >= 1636686403000 AND timestamp_ms <= 1636690003000  ORDER BY timestamp_ms desc, labels desc  LIMIT 1000) SELECT  * FROM sel_a  ORDER BY labels desc, timestamp_ms desc  FORMAT JSONEachRow

I was expecting a mention of ABCD1234 in Clickhouse itself as it's the source of truth for querying. But I am guessing what is happening is that the extra label filters are processed/searched in the cLoki app level and not Clickhouse.

Which leads to the behaviour, where if the first 1000 lines of the dataset doesn't have the user=ABCD1234, the app level search will simply return an empty list. I could be wrong in my assumptions here but to me this looks like the case.

Should we not do a JSONExtractString() on the string field and pass the value of user to Clickhouse itself?

Thanks, again!

Live watches are never terminated

Steps to reproduce:

  • Open logs "live stream"
  • Close grafana window
  • WATCH query looks to never be terminating, consuming quite a lot of server resources (even after cLoki restart)

Tested version: c40d1d9, but happens for quite a number of commits already


SELECT
    query_id,
    query,
    elapsed
FROM system.processes
WHERE position(query, 'watcher') > 0

Query id: 6db0c5a6-1b5d-4c02-987b-d8fe3947c21a

┌─query_id─────────────────────────────┬─query────────────────────────────────────────────────────────────────────────────────────────┬──────elapsed─┐
│ 9228fc26-ddac-42a2-9dfc-6e9f1122e673 │ WATCH cloki.watcher_ad9229b2ad45b6849848f45ceae2b4 FORMAT JSONEachRow                        │ 37.239223475 │
└──────────────────────────────────────┴──────────────────────────────────────────────────────────────────────────────────────────────┴──────────────┘

loki explore "show context" error

when I use grafana Loki explore, I click "show context" to show the context, but it throw an ERROR:
image
I also find the qryn server log: Cannot read properties of null (reading 'rootToken')

Configurable Partition options

We have a large deployment log cluster and store multiple year's worth of logs. For us, partitioning by date is more useful than partitioning by hour.

Would it be possible to have this configurable as a PARTITION_INTERVAL variable?

Probably we can take

  • weekly
  • monthly
  • daily`
  • hourly

as different options from user, fallback being the current hourly.

Thanks!

`/api/v1/query` API not working?

Been following some of the documentation in the wiki and unsure why the /api/v1/query API does not return any results.

How To Repro

$ curl -i -XPOST -H "Content-Type: application/json" http://localhost:3100/loki/api/v1/push --data '{"streams":[{"labels":"{\"__name__\":\"up\"}","entries":[{"timestamp":"2018-12-26T16:00:06.944Z","line":"zzz"}]}]}'
HTTP/1.1 200 OK
 $ curl "http://localhost:3100/loki/api/v1/labels"
{"status":"success","data":["filename","job","__name__"]
$ curl "http://localhost:3100/loki/api/v1/label/__name__/values"
{"status":"success","data":["up"]}

PS This API in the wiki is incorrect, it says api/v1/__name__ instead of api/v1/label/__name__

$ curl "http://localhost:3100/loki/api/v1/query?query='{__name__="up"}'"
{"status":"success","data":{"resultType":"streams","result":[]}}

If I set DEBUG=true , I see this in the logs:

GET /loki/api/v1/query
QUERY:  [Object: null prototype] { query: "'__name__=up'" }
LABEL undefined VALUES []

The issue seems to be https://github.com/lmangani/cLoki/blob/master/lib/handlers/query.js#L8 where query.name is undefined.

Am I doing something wrong here?

Log/Table rotation in cLoki

Hello

I'm using cLoki and in my use case I want the logs stored in clickhouse should be rotated and removed by weekly, monthly or ...
Just like logrotate tool that do such this action for syslog files.

I find two environment variables that their description is close to such this action: LABELS_DAYS and SAMPLES_DAYS
Is these variables really do table rotation in clickhouse?

Configurable Payload Size

I'm using https://vector.dev/ to push logs to cLoki. I've configured the batch size as 1MiB, because the log volume is huge (225GB file), so I want fewer requests to upstream (cLoki and subsequently even Clickhouse). Batching multiple log lines is ideal way to do it.

However, I am getting an error from cLoki:

{ status: 413, version: HTTP/1.1, headers: {"content-type": "application/json; charset=utf-8", "content-length": "120", "date": "Mon, 29 Nov 2021 11:42:16 GMT", "connection": "keep-alive", "keep-alive": "timeout=5"}, body: b"{\"statusCode\":413,\"code\":\"FST_ERR_CTP_BODY_TOO_LARGE\",\"error\":\"Payload Too Large\",\"message\":\"Request body is too large\"}" }

Looks like the default payload size is 1MB. I couldn't find how to tweak this parameter: https://www.fastify.io/docs/latest/Server/#bodylimit. Maybe we should make it configurable via ENV vars?

Thanks

Query Pipeline Re-Design

Pipeline processor are currently brutal prototypes and we need to grow this into a dynamic, pluggable implementation.

A case in point would be adding a JSON parser/processor to extract metrics from logs. Realistically, we can't reimplement the Loki JSON parsing queries in cLoki in all of their beautiful complexity, but we can get away with a decent alternatives, for example jexl which I've used in SENTINL development a long time ago for pipelining alerts might do quite the job to extract metric elements and tags.

Now, this type of "plugin" would require chaining into a proper pipeline processor for cLoki queries to resolve into data.

Are there any takers in the community to join this redesign effort? Forkers, unite! ;)

Provide versioned docker images

Hi

Firstly, thanks for building and open sourcing this project! It's super amazing and I came here after watching this talk. Clickhouse fan here as well and would love to try this project in my org.

I am looking to set this up in production and aiming at a docker setup. I think it'll be really nice if the docker images are published with proper tags and not :latest. Since this project is in beta stage, it's natural for upgrades to maybe break an existing version so just to keep it safe, a tagged version would be much appreciated.

Thanks!

Status code mismatch with Loki

Loki actually returns HTTP 204 for https://grafana.com/docs/loki/latest/api/#post-lokiapiv1push but cLoki returns 200. In order to make cLoki a transparent API layer acting as Loki, I think we should be sending the same status codes as what Loki's API also sends.

Example of the mismatch:

  • Loki
❯ curl -i -H "Content-Type: application/json" -XPOST -s "http://localhost:3100/loki/api/v1/push" --data-raw \
  '{"streams": [{ "stream": { "foo": "bar2" }, "values": [ [ "1638247742232416256", "fizzbuzz" ] ] }]}'
HTTP/1.1 204 No Content
Date: Tue, 30 Nov 2021 04:49:30 GMT
  • cLoki
❯ curl -i -H "Content-Type: application/json" -XPOST -s "http://localhost:3100/loki/api/v1/push" --data-raw \
  '{"streams": [{ "stream": { "foo": "bar2" }, "values": [ [ "1638247742232416256", "fizzbuzz" ] ] }]}'
HTTP/1.1 200 OK
content-type: application/json; charset=utf-8
content-length: 3
Date: Tue, 30 Nov 2021 04:59:19 GMT
Connection: keep-alive
Keep-Alive: timeout=5

200

Changing this to the below snippet should fix it, I think.

  res.code(204).send()

Thanks!

No Browser Auth prompt asked for

Now that cloki supports having the explore UI available... if you have cloki protected by basic auth and go to the URL for the UI in a browser you'll never be asked for basic auth credentials.

I think we just need to add the authenticate option to the registration of the fastify basic auth plugin. Info can be found at https://github.com/fastify/fastify-basic-auth#authenticate-booleanobject-optional-default-false so that it gives back the www-authenticate header to prompt the browser to ask for creds if not given...

Recommend Projects

  • React photo React

    A declarative, efficient, and flexible JavaScript library for building user interfaces.

  • Vue.js photo Vue.js

    🖖 Vue.js is a progressive, incrementally-adoptable JavaScript framework for building UI on the web.

  • Typescript photo Typescript

    TypeScript is a superset of JavaScript that compiles to clean JavaScript output.

  • TensorFlow photo TensorFlow

    An Open Source Machine Learning Framework for Everyone

  • Django photo Django

    The Web framework for perfectionists with deadlines.

  • D3 photo D3

    Bring data to life with SVG, Canvas and HTML. 📊📈🎉

Recommend Topics

  • javascript

    JavaScript (JS) is a lightweight interpreted programming language with first-class functions.

  • web

    Some thing interesting about web. New door for the world.

  • server

    A server is a program made to process requests and deliver data to clients.

  • Machine learning

    Machine learning is a way of modeling and interpreting data that allows a piece of software to respond intelligently.

  • Game

    Some thing interesting about game, make everyone happy.

Recommend Org

  • Facebook photo Facebook

    We are working to build community through open source technology. NB: members must have two-factor auth.

  • Microsoft photo Microsoft

    Open source projects and samples from Microsoft.

  • Google photo Google

    Google ❤️ Open Source for everyone.

  • D3 photo D3

    Data-Driven Documents codes.