GithubHelp home page GithubHelp logo

miniufo / xgrads Goto Github PK

View Code? Open in Web Editor NEW
69.0 3.0 27.0 16.94 MB

Parse and read ctl and associated binary file commonly used by GrADS into xarray

Home Page: https://xgrads.readthedocs.io/

License: MIT License

Python 5.83% Jupyter Notebook 92.88% Visual Basic 6.0 1.29%
grads parsing xarray dask atmosphere oceanography meteorology python

xgrads's Introduction

xgrads

DOI GitHub Documentation Status PyPI version Publish to PyPI pytest Build Status

3D plot

1. Introduction

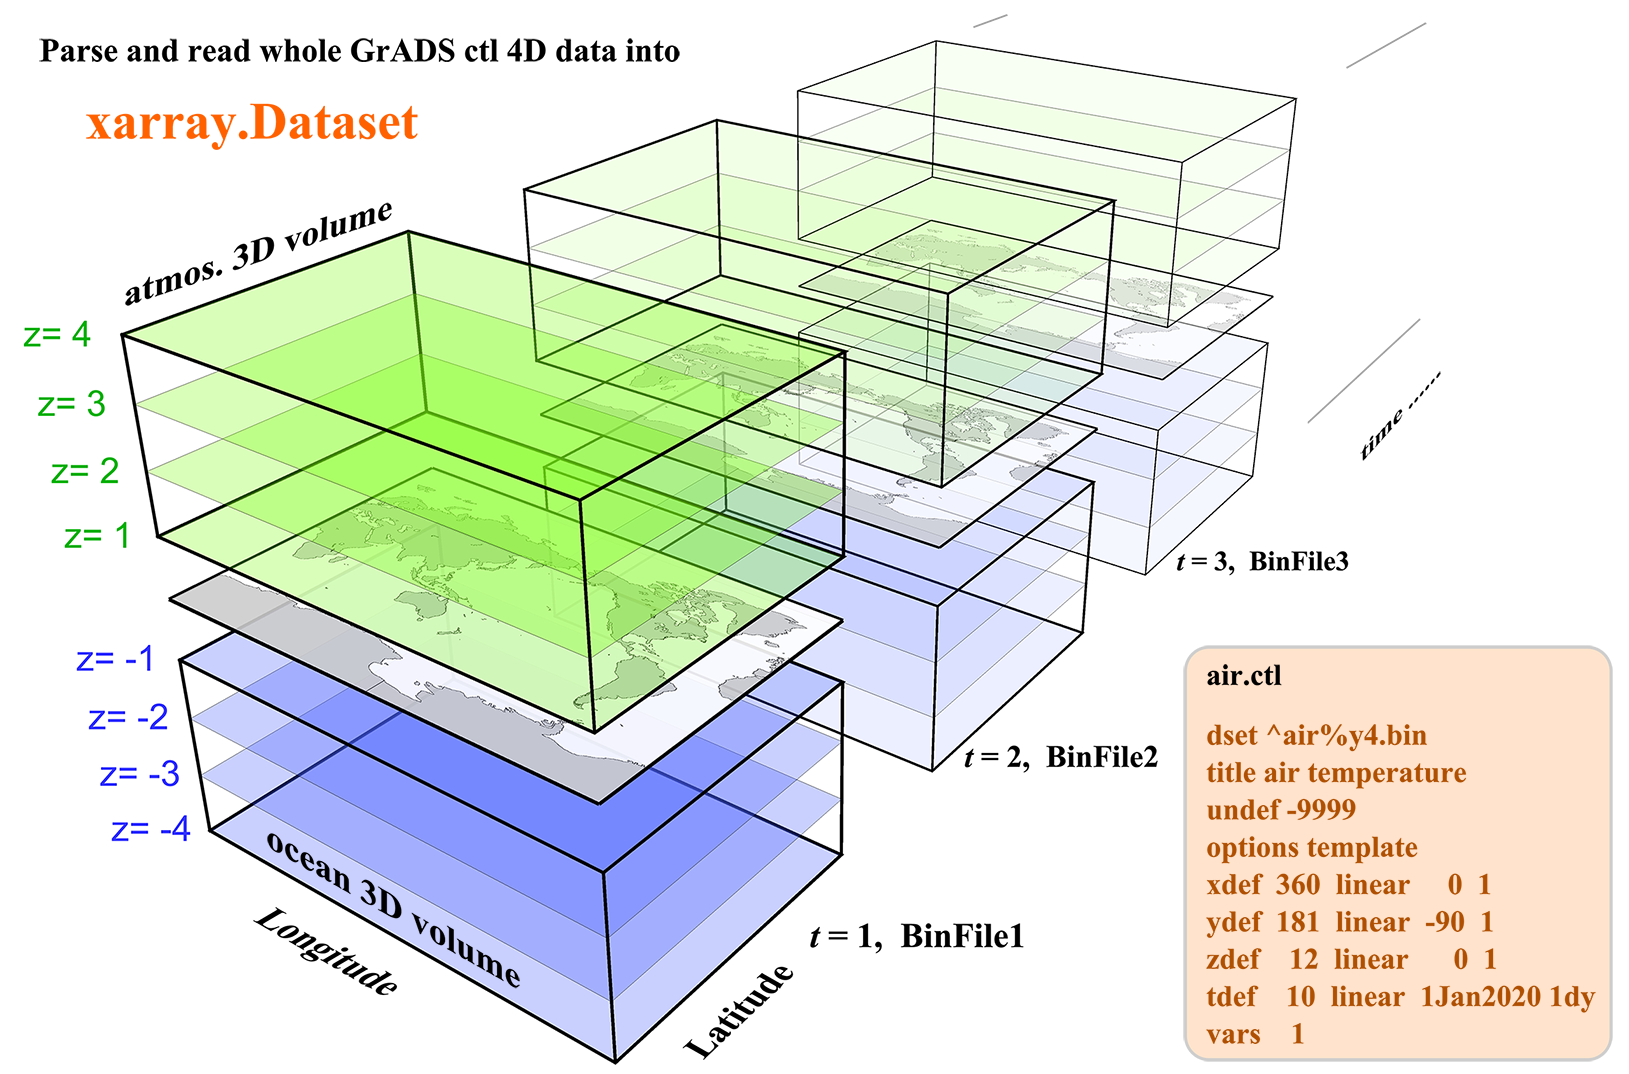
The Grid Analysis and Display System (GrADS or OpenGrADS) is a widely used software for easy access, manipulation, and visualization of earth science data. It uses a descriptor (or control) file with a suffix .ctl to describe a raw binary 4D dataset. The ctl file is similar to the header information of a NetCDF file, containing all the information about dimensions, attributes, and variables except for the variable data.

This python package xgrads is designed for parse and read the .ctl file commonly used by GrADS. Right now it can parse various kinds of .ctl files. However, only the commonly used raw binary 4D datasets can be read using dask and return as a xarray.Dataset Other types of binary data, like dtype is station orgrib, may be supported in the future.


2. How to install

Requirements xgrads is developed under the environment with xarray (=version 0.15.0), dask (=version 2.11.0), numpy (=version 1.15.4), cartopy (=version 0.17.0), and pyproj (=version 1.9.6). Older versions of these packages are not well tested.

Install via pip

pip install xgrads

Install from github

git clone https://github.com/miniufo/xgrads.git
cd xgrads
python setup.py install

3. Examples

3.1 Parse a .ctl file

Parsing a .ctl file is pretty simple using the following code:

from xgrads import CtlDescriptor

ctl = CtlDescriptor(file='test.ctl')

# print all the info in ctl file
print(ctl)

If you have already load the ASCII content in the .ctl file, you can do it as:

content = \
    "dset ^binary.dat\n" \
    "* this is a comment line\n" \
    "title 10-deg resolution model\n" \
    "undef -9.99e8\n" \
    "xdef 36 linear   0 10\n" \
    "ydef 19 linear -90 10\n" \
    "zdef  1 linear   0  1\n" \
    "tdef  1 linear 00z01Jan2000 1dy\n" \
    "vars  1\n" \
    "test  1 99 test variable\n" \
    "endvars\n"

ctl = CtlDescriptor(content=content)

# print all the info
print(ctl)

3.2 Read binary data into a xarray.Dataset

Reading a .ctl related binary data file is also pretty simple using the following code:

from xgrads import open_CtlDataset

dset = open_CtlDataset('test.ctl')

# print all the info in ctl file
print(dset)

Then you have the dset as a xarray.Dataset. This is similar to xarray.open_dataset that use dask to chunk (buffer) parts of the whole dataset in physical memory if the whole dataset is too large to fit in.

If there are many .ctl files in a folder, we can also open all of them in a single call of open_mfdataset as:

from xgrads import open_mfDataset

dset = open_mfDataset('./folder/*.ctl')

# print all the info in ctl file
print(dset)

assuming that every .ctl file has similar data structure except the time step is different. This is similar to xarray.open_mfdataset.


3.3 Convert a GrADS dataset to a NetCDF dataset

With the above functionality, it is easy to convert a .ctl (GrADS) dataset to a .nc (NetCDF) dataset:

from xgrads import open_CtlDataset

open_CtlDataset('input.ctl').to_netcdf('output.nc')

xgrads's People

Contributors

ablancha avatar jesieleo avatar miniufo avatar perillaroc avatar singledoggy avatar

Stargazers

 avatar  avatar  avatar  avatar  avatar  avatar  avatar  avatar  avatar  avatar  avatar  avatar  avatar  avatar  avatar  avatar  avatar  avatar  avatar  avatar  avatar  avatar  avatar  avatar  avatar  avatar  avatar  avatar  avatar  avatar  avatar  avatar  avatar  avatar  avatar  avatar  avatar  avatar  avatar  avatar  avatar  avatar  avatar  avatar  avatar  avatar  avatar  avatar  avatar  avatar  avatar  avatar  avatar  avatar  avatar  avatar  avatar  avatar  avatar  avatar  avatar  avatar  avatar  avatar  avatar  avatar  avatar  avatar  avatar

Watchers

 avatar  avatar  avatar

xgrads's Issues

there are missing binary files

Hello, I follow your modification after the operation reported the following error。My binary data file is from 00 hours to 24 hours. Please help me, thank you!

Traceback (most recent call last):
File "F:/python/CUACE/test20161216.py", line 3, in
fn=open_CtlDataset('G:/CUACE/result/0907/chemvar.ctl')
File "D:\soft\Anaconda\lib\site-packages\xgrads\io.py", line 143, in open_CtlDataset
raise Exception('there are missing binary files')
Exception: there are missing binary files
warning: G:/CUACE/result/0907/chemvar201612160002500 is missing...

add support to PDEF

Currently the PDEF keyword is not supported. PDFF defines another native grid in addition to rectilinear lat/lon grid. GrADS will interpolate the native grid data onto the lat/lon grid for display any variable. This would take some times to fully support this. First, just correctly parse the PDEF in ctl and then correctly load the (interpolated) binary data for display.

can not support the 'mo' or 'yr'

in my ctl file, the tdef unit is 'mo', when i run the script.
throw a error like 'Cannot get a common metadata divisor for NumPy datetime metadata [s] and [M] because they have incompatible nonlinear base time units'
the numpy's arange can not support month or year.

Invalid value for attr 'pdef'

Heya!

I am a noob when it comes to GrADS and I do most of my work in python or MATLAB. Having said that.. this is what my control file looks like:

DSET /mnt/d/Learning/IMD-data/rainfall_ruchin/imd_msg_%d2%m2%y4.grd
options template
TITLE 0.25 degranalyzed normal grids
UNDEF -999.0
XDEF 241 LINEAR 50. 0.25
YDEF 281 LINEAR -30.0 0.25
ZDEF 1 linear 1 1
TDEF 123 LINEAR 00Z01jul2020 1DY
VARS 1
rf 0 99 GRIDDED RAINFALL
ENDVARS

Note that I do not have pdef defined as I felt it is a regular gridded file.. Now when I call open_ctlDataset, this is what I have:

from xgrads import open_CtlDataset
dset = open_CtlDataset('imd-msg_rain.ctl')
print(dset)
<xarray.Dataset>
Dimensions: (lat: 281, lon: 241, time: 123)
Coordinates:

  • time (time) datetime64[ns] 2020-07-01 2020-07-02 ... 2020-10-31
  • lat (lat) float32 -30.0 -29.75 -29.5 -29.25 ... 39.25 39.5 39.75 40.0
  • lon (lon) float32 50.0 50.25 50.5 50.75 ... 109.2 109.5 109.8 110.0
    Data variables:
    rf (time, lat, lon) float32 dask.array<chunksize=(1, 281, 241), meta=np.ndarray>
    Attributes:
    comment: GRIDDED RAINFALL
    storage: 99
    title: 0.25
    undef: -999.0
    pdef: None

Now the issue is, xgrads needs this attribute defined.. can you please let this be undefined in your code???

open_CtlDataset('imd-msg_rain.ctl').to_netcdf('output.nc')
Traceback (most recent call last):
File "", line 1, in
File "/home/raghu/anaconda3/envs/gen/lib/python3.9/site-packages/xarray/core/dataset.py", line 1799, in to_netcdf
return to_netcdf(
File "/home/raghu/anaconda3/envs/gen/lib/python3.9/site-packages/xarray/backends/api.py", line 1029, in to_netcdf
_validate_attrs(dataset, invalid_netcdf=invalid_netcdf and engine == "h5netcdf")
File "/home/raghu/anaconda3/envs/gen/lib/python3.9/site-packages/xarray/backends/api.py", line 171, in _validate_attrs
check_attr(k, v, valid_types)
File "/home/raghu/anaconda3/envs/gen/lib/python3.9/site-packages/xarray/backends/api.py", line 163, in check_attr
raise TypeError(
TypeError: Invalid value for attr 'pdef': None. For serialization to netCDF files, its value must be of one of the following types: str, Number, ndarray, number, list, tuple

Regards
Raghu

Handle Var unit code '00' in CTL vars section

Some users use to set '00' instead of '0' when describing a variable in VARS section of CTL. Example:

rain 1 00 rain analysis

xgrads produces this error for that case: invalid storage 00, only "99" or "-1,20" are supported

In line 413 of io.py module the comparison is made: elif var.storage == '99' or var.storage == '0':

lat_ref equals to central_latitude?

In the case of wrf, I guess crs should be the crs_new
because the mode cent_lat and lon should be in the globe comment here. They are not equal to lat_ref.

@ global String comment MOAD_CEN_LAT =        30.1
@ global String comment STAND_LON =       103

I tested it in one of my WRF out

# central_latitude
central_latitude = 30.1

# new crs that can get the same latlong of wrf
temp = ccrs.LambertConformal(
    globe=globe,
    central_latitude=central_latitude,
    central_longitude=pdef.slon,
    standard_parallels=(pdef.Struelat, pdef.Ntruelat)
)

e, n = pyproj.transform(wgs_proj, temp, pdef.lonref, pdef.latref)

crs_new = ccrs.LambertConformal(
    globe=globe,
    central_latitude=central_latitude,
    central_longitude=pdef.slon,
    standard_parallels=(pdef.Struelat, pdef.Ntruelat),
    false_easting=(pdef.isize - 1) / 2. * pdef.dx - e,
    false_northing=(pdef.jsize - 1) / 2. * pdef.dy - n
)

instead of crs

globe = ccrs.Globe(
    ellipse='sphere', semimajor_axis=6370000, semiminor_axis=6370000)
crs = get_data_projection(ctl, globe=globe)

and the you can get the xcoord and ycoord by lon2d and lat2d via the crs_new, vice versa, Or they may be inconsistent.

lon2d = da.XLONG.values
lat2d = da.XLAT.values

ycoord = np.linspace(0, (pdef.jsize - 1) * pdef.dx, pdef.jsize)
xcoord = np.linspace(0, (pdef.isize - 1) * pdef.dy, pdef.isize)
# case 1
wgs_proj = ccrs.Geodetic(globe=globe)
xx, yy = np.meshgrid(xcoord, ycoord)
x, y, _ = crs.transform_points(wgs_proj, lon2d, lat2d).T
x - xx.T

# %%
# case2
wgs_proj = ccrs.Geodetic(globe=globe)
xx, yy = np.meshgrid(xcoord, ycoord)
x, y, _ = crs_new.transform_points(wgs_proj, lon2d, lat2d).T
x - xx.T

I haven't get a way to automatically get central latitude.
And I got the idea from this artical


I just use WRF and some other model like NAQPMS, so I'm not sure about the other type of file.
If all lat_ref don't equal to central_latitude? Or just WRF need special setting?

PDEF not supported.

I am trying to open a few .ctl files through your wonderful xgrads module, but they do not open because of the following error.

Traceback (most recent call last):
  File "C:\Users\acer\Anaconda3\lib\site-packages\IPython\core\interactiveshell.py", line 3331, in run_code
    exec(code_obj, self.user_global_ns, self.user_ns)
  File "<ipython-input-4-7ffba5019cbb>", line 2, in <module>
    dset = open_mfdataset(a[0])
  File "C:\Users\acer\Anaconda3\lib\site-packages\xgrads\io.py", line 64, in open_mfdataset
    datasets = [open_(p, encoding=encoding) for p in paths]
  File "C:\Users\acer\Anaconda3\lib\site-packages\xgrads\io.py", line 64, in <listcomp>
    datasets = [open_(p, encoding=encoding) for p in paths]
  File "C:\Users\acer\Anaconda3\lib\site-packages\xgrads\io.py", line 102, in open_CtlDataset
    ctl = CtlDescriptor(encoding=encoding, file=desfile)
  File "C:\Users\acer\Anaconda3\lib\site-packages\xgrads\core.py", line 137, in __init__
    self.parse(fileContent)
  File "C:\Users\acer\Anaconda3\lib\site-packages\xgrads\core.py", line 159, in parse
    self._processPDEF(oneline)
  File "C:\Users\acer\Anaconda3\lib\site-packages\xgrads\core.py", line 241, in _processPDEF
    self.pdef = PDEF(oneline)
  File "C:\Users\acer\Anaconda3\lib\site-packages\xgrads\core.py", line 675, in __init__
    raise Exception('not currently supported PDEF\n' + oneline)
Exception: not currently supported PDEF
PDEF 182 149 general 4 stream binary ^pdefs/tos_CMCC.CMCC-CMS_r1i1p1_0p5.pdef

add support to template %f3

Some products from GRAPES model include a template %f3 like:

dset ^postvar%f3
options template sequential big_endian
title post output from grapes
undef -9.99E+33
...

Now I have the data so I can add support to this and make some tests.

add support for dtype of station data

GrADS support a type of station data. Not so sure if someone need to read in the station data. Since there is no objective analysis method like oacres, plotting the (randomly distributed) station data is not straightforward. Besides, this is a less frequently used case than regular gridded data.

Do we need to add support to read in this type of data?

Error while open ctl with %f2.dat

the ctl file is begin with
dset ^Z_NAFP_C_BABJ_2019071512_P_CAMS-CPEFS-ASEC_%f2.dat

open ctl error

File "", line 1, in
ctl = CtlDescriptor(file='F:/CPEFS/Z_NAFP_C_BABJ_2019071512_P_CAMS-CPEFS-ASEC.ctl')

File "c:\programdata\anaconda3\lib\site-packages\xgrads\core.py", line 137, in init
self.parse(fileContent)

File "c:\programdata\anaconda3\lib\site-packages\xgrads\core.py", line 181, in parse
self._processDSets(dpath_str)

File "c:\programdata\anaconda3\lib\site-packages\xgrads\core.py", line 205, in _processDSets
tokens.append(self._get_template_format(token))

File "c:\programdata\anaconda3\lib\site-packages\xgrads\core.py", line 525, in _get_template_format
raise Exception('unsupported format: ' + part)

Exception: unsupported format: %f2

using xgrads in a loop

Hi
I am writing a loop to upload every zdef in each step for using dset. But I recieved some error :
my code is:
for yy in range(1980,1981):
fileCtl=("IVT_",str(yy),".ctl")
file_name="".join(fileCtl)
path=os.path.join(path1+os.sep,file_name)

print(path)     
dset1 = CtlDescriptor(file=os.path.join(path1+os.sep,file_name))     
dset1 = open_CtlDataset(os.path.join(path1+os.sep,file_name))
#print(dset)
if(yy%4==0):
     for tt in range(0,852): 
        dset1=dset1['IVT'][tt]
        da1=dset1.to_numpy()
        print(da1)
        print("tt",tt)

=============================================================================

else:
     print(yy)
     for tt in range (0,842):
         dset1= dset1['IVT'][tt]
         da1=dset1.to_numpy()
         print(tt)

I want to have da1 in every step, but I just have tt=1 and then there is an error:Traceback (most recent call last):

File ~\anaconda3\lib\site-packages\xarray\core\dataarray.py:731 in _getitem_coord
var = self._coords[key]

KeyError: 'IVT'

During handling of the above exception, another exception occurred:

Traceback (most recent call last):

File E:\dissertation\Code\code2\untitled8.py:37 in
dset1=dset1['IVT'][tt]

File ~\anaconda3\lib\site-packages\xarray\core\dataarray.py:742 in getitem
return self._getitem_coord(key)

File ~\anaconda3\lib\site-packages\xarray\core\dataarray.py:734 in _getitem_coord
_, key, var = _get_virtual_variable(

File ~\anaconda3\lib\site-packages\xarray\core\dataset.py:170 in _get_virtual_variable
ref_var = variables[ref_name]

KeyError: 'IVT'

ValueError: invalid literal for int() with base 10: 'tslb'

I owe a debt of thanks to your wonderful module helping me a lot. but i had the following error while reading my ctl file:

Traceback (most recent call last):
File "main.py", line 34, in
data = DR.dataread(ctlpath)
File "/mnt/e/WNP/grd/dataread.py", line 19, in dataread
dset = open_CtlDataset(ctlpath)
File "/home/jean/anaconda3/lib/python3.8/site-packages/xgrads/io.py", line 102, in open_CtlDataset
ctl = CtlDescriptor(encoding=encoding, file=desfile)
File "/home/jean/anaconda3/lib/python3.8/site-packages/xgrads/core.py", line 137, in init
self.parse(fileContent)
File "/home/jean/anaconda3/lib/python3.8/site-packages/xgrads/core.py", line 178, in parse
self._processVars(oneline, fileContent)
File "/home/jean/anaconda3/lib/python3.8/site-packages/xgrads/core.py", line 404, in _processVars
v = CtlVar(fileContent[start+i])
File "/home/jean/anaconda3/lib/python3.8/site-packages/xgrads/core.py", line 789, in init
self.zcount = int(self.zcount)
ValueError: invalid literal for int() with base 10: 'tslb'

and I found that the error originated with a blank space in front of the variable 'tslb' in the my ctl file. The code works successfully when I remove this space in the ctl file. Is there any way to read data successfully without modifying ctl file?

xgrads returning the same data for different variables

I am working with historical teleconnection forecasts to be found here:
ftp://ftp.cpc.ncep.noaa.gov/cwlinks

In particular I am processing these 2 files:
norm.daily.nao.ensf.z500.b14sep2001_current.ctl
norm.daily.nao.ensf.z500.b14sep2001_current

The .ctl file look slike this:
dset /cpc/prod/cwlinks/indices_RH6/data/norm.daily.nao.ensf.z500.b14sep2001_current
undef -9.99E+33
title Daily NAO index using ENSM data
XDEF 1 linear 0.000 2.500
YDEF 1 linear -90.000 2.500
ZDEF 11 linear 1 1
TDEF 20000 LINEAR 14sep2001 1dy
vars 16
anl 11 00 reanalysis (11 members in Z)
fd1 11 00 1day forecast
fd2 11 00 2day forecast
fd3 11 00 3day forecast
fd4 11 00 4day forecast
fd5 11 00 5day forecast
fd6 11 00 6day forecast
fd7 11 00 7day forecast
fd8 11 00 8day forecast
fd9 11 00 9day forecast
fd10 11 00 10day forecast
fd11 11 00 1aday forecast
fd12 11 00 12day forecast
fd13 11 00 13day forecast
fd14 11 00 14day forecast
fd15 11 00 15day forecast
endvars

When I parse this data with xgrads all the variables return the same data. The example below shows
this for one day and the variables fd1 and fd15.

from xgrads import open_CtlDataset
from datetime import timedelta
import pandas
dset = open_CtlDataset(r'H://DailyNAOFcst/norm.daily.nao.ensf.z500.b14sep2001_current.ctl')
t1 = dset.fd1.to_dataframe().reset_index()
t1 = t1[t1['time'] == pandas.Timestamp('4/26/2021')]
t2 = dset.fd15.to_dataframe().reset_index()
t2 = t2[t2['time'] == pandas.Timestamp('4/26/2021')]

t1
Out[17]:
time lev lat lon fd1
78804 2021-04-26 1.0 -90.0 0.0 -1.733883
78805 2021-04-26 2.0 -90.0 0.0 -1.733396
78806 2021-04-26 3.0 -90.0 0.0 -1.712393
78807 2021-04-26 4.0 -90.0 0.0 -1.741247
78808 2021-04-26 5.0 -90.0 0.0 -1.736228
78809 2021-04-26 6.0 -90.0 0.0 -1.707944
78810 2021-04-26 7.0 -90.0 0.0 -1.738765
78811 2021-04-26 8.0 -90.0 0.0 -1.733343
78812 2021-04-26 9.0 -90.0 0.0 -1.727453
78813 2021-04-26 10.0 -90.0 0.0 -1.741112
78814 2021-04-26 11.0 -90.0 0.0 -1.721412

t2
Out[18]:
time lev lat lon fd15
78804 2021-04-26 1.0 -90.0 0.0 -1.733883
78805 2021-04-26 2.0 -90.0 0.0 -1.733396
78806 2021-04-26 3.0 -90.0 0.0 -1.712393
78807 2021-04-26 4.0 -90.0 0.0 -1.741247
78808 2021-04-26 5.0 -90.0 0.0 -1.736228
78809 2021-04-26 6.0 -90.0 0.0 -1.707944
78810 2021-04-26 7.0 -90.0 0.0 -1.738765
78811 2021-04-26 8.0 -90.0 0.0 -1.733343
78812 2021-04-26 9.0 -90.0 0.0 -1.727453
78813 2021-04-26 10.0 -90.0 0.0 -1.741112
78814 2021-04-26 11.0 -90.0 0.0 -1.721412

I am familiar enough with this data to know that the actual published data for fd15 looks very different.
Could you give me sense of this is a bug?
Thank you very much for your help.

PDEF to nc files

Professor Qian,

I can read the ctl file (with PDEF of lccr) based on xgrads.

Descriptor File as follows,

DSET ^surf_HPB_m001_198101_rain_subset.dat
UNDEF -9.9999e+20
OPTIONS BIG_ENDIAN
PDEF 191 155 LCCR 35 135 97 77 30 60 135 20000 20000
XDEF 321 LINEAR 105.000000 0.2
YDEF 205 LINEAR 15.000000 0.2
ZDEF 1 LINEAR 1.000000 1
TDEF 744 LINEAR 01:00Z1JAN1981 60MN
VARS 1
rain 0 61 , 1, 0 precipitation [mm/h]
ENDVARS

One problem is 'LCCR' in this descriptor file is capital, which is different from 'lccr' used in IO.py of xgrads.

This can be solved eailsy by changing 'LCCR' to 'lccr'.

Another thing is that the 'rain 0 61' in the descriptor file gives the following error in python:

Exception: invalid storage 61, only "99" or "-1,20" are supported

Thank you for your help,

Zhao

datasets.zip

If the globe information important in crs= get_data_projection(ctl)?

get_data_projection(ctl) set the default ccrs.Globe as ellps=WGS84, but actually in WRF-model or other weather model, the earth is considered as sphere like. To get the accurate shape, we sometimes need to set:

globe = ccrs.Globe(ellipse='sphere', semimajor_axis=6370000,
                   semiminor_axis=6370000)

There maybe some way to change ccrs after a catropy.ccrs is created, but it may not that convenient to do so.
Thanks again for your excellent work!

string index out of range

dset = open_CtlDataset('pm.ctl')
Traceback (most recent call last):
File "", line 1, in
File "/home/public/software/anaconda3/lib/python3.8/site-packages/xgrads/io.py", line 102, in open_CtlDataset
ctl = CtlDescriptor(encoding=encoding, file=desfile)
File "/home/public/software/anaconda3/lib/python3.8/site-packages/xgrads/core.py", line 123, in init
if dirname[-1] != '/':
IndexError: string index out of range

the ctl file is

dset ^pmvar
options sequential
title model output from sim
undef -9.99E+33
xdef  502 linear   70.0000    0.1500
ydef  330 linear   15.0000    0.1500
zdef   51 linear 1 1
tdef   73 linear 00z14NOV2020    60mn
vars        9
bc 0 0  BC AOD
oc 0 0  OC AOD
sd 0 0  SD AOD
ss 0 0  SS AOD
sf 0 0  SF AOD
ni 0 0  NI AOD
am 0 0  AM AOD
pm25   50 99 pm25 concentration
fktm   50 99 diffusion coefficient
endvars

How to deal with this? Thanks

Error trying to convert from grads to netCDF

Hi
I'm having the following error when I try to convert from grads file to netCDF

grads2netcdf.py
attm103.ctl

Traceback (most recent call last):
File "grads2netcdf.py", line 3, in
open_CtlDataset('[PATH]/output/exp_103/attm103.ctl').to_netcdf('[PATH]/output/exp_103/attm103.nc')
File "/home/[USER]/.local/lib/python3.7/site-packages/xgrads/io.py", line 42, in open_CtlDataset
ctl = CtlDescriptor(file=desfile)
File "/home/[USER]/.local/lib/python3.7/site-packages/xgrads/core.py", line 133, in init
self.parse(fileContent)
File "/home/[USER]/.local/lib/python3.7/site-packages/xgrads/core.py", line 177, in parse
self._processDSets(dpath_str)
File "/home/[USER]/.local/lib/python3.7/site-packages/xgrads/core.py", line 204, in _processDSets
part = (strTim + incre * l).item().strftime(fmt)
TypeError: Cannot get a common metadata divisor for NumPy datetime metadata [s] and [M] because they have incompatible nonlinear base time units

separate cartopy from core.py

Recently I realized that the core.py requires cartopy to be correctly imported. This is not necessary if one only wants to parse the data. The solution would be to add a py file that deal with the projection-related plotting or calculation, leaving core.py as small as possible.

add support of `sequential` in `options`

Currently the sequential keyward can be parsed correctly but the related binary dataset may not be loaded correctly. This needs to be fixed with some testing binary dataset.

Error while opening .grb2

I am using the following code for opening a .ctl .grb2 .idx files using xgrads:

In the current directory:
202104120000_arw_wrfout_d01.grb2
202104120000_arw_wrfout_d01.idx
202104120000_arw_wrfout_d01.ctl

from xgrads import CtlDescriptor, open_CtlDataset
dset = open_CtlDataset('202104120000_arw_wrfout_d01.ctl')

And I get the following error:

IndexError                                Traceback (most recent call last)
<ipython-input-3-42a243af2d2f> in <module>
      1 # ctl = CtlDescriptor(file='202104120000_arw_wrfout_d01.ctl')
----> 2 dset = open_CtlDataset('202104120000_arw_wrfout_d01.ctl')

~/anaconda3/lib/python3.7/site-packages/xgrads/io.py in open_CtlDataset(desfile, returnctl, encoding)
    100         raise Exception('unsupported file, suffix should be .ctl')
    101 
    102     ctl = CtlDescriptor(encoding=encoding, file=desfile)
    103 
    104     if ctl.template:

~/anaconda3/lib/python3.7/site-packages/xgrads/core.py in __init__(self, encoding, **kwargs)
    124                         print(dirname)
    125 
    126                         if dirname[-1] != '/':
    127                             fileContent[i] = line.replace('^',
    128                                                os.path.dirname(abspath) + '/')

IndexError: string index out of range

What can I do?

subplot for plotting two tdef

In my program I want to plot two tdef, the fist one before a loop and the next one after changing some data . I want to use subplot.
Is it available in xgarads?

pdef and template option seems can't work togther.

Here is the diff of my 2 ctl

index 42f7e4d..2209bfd 100644
--- a/emis.aa.2019090100.d2.template.ctl
+++ "b/emis.aa.2019090100.d2.singel.ctl"
@@ -1,12 +1,12 @@
-DSET ^emis.aa.2019%m2%d2%h2.d2
+DSET ^emis.aa.2019090100.d2
 TITLE ind + ene + dom + tra + agr + MEGAN-MACC + GFED4-BioBurn_emission
 UNDEF 99999.0
-OPTIONS byteswapped template
+OPTIONS byteswapped
 pdef 288 270 lcc 30.618 110.375 144.500 135.500 40.00000 25.00000 105.00000 5000.000 5000.000
 xdef 736 linear 102.42991 0.02252252
 ydef 588 linear 23.80582 0.02252252
 ZDEF  20 LINEAR  1.0 1.0
-TDEF  24 LINEAR 00Z01Sep2019 60mn
+TDEF  1 LINEAR 00Z01Sep2019 60mn

And b/emis.aa.2019090100.d2.singel.ctl works fine, while a/emis.aa.2019090100.d2.template.ctl returns

ValueError: conflicting sizes for dimension 'y': length 588 on the data but length 270 on coordinate 'y'
It seems that template option can't work together with pdef. Or it maybe something wrong in my code?

My code is:
open_CtlDataset( 'filenamel')

It seems that
if ctl.template: and if ctl.pdef: need to in correctly order.
or __read_template_as_dask need to set y, x to pdef.
You can check it and I would also test my idea when I get around to do it.
Here is the key I think.
t, y, x = dd.tdef.length(), dd.ydef.length(), dd.xdef.length()

can not read the .ctl file with %fhn

`dset ^chemvar20220101000%fhn
options little_endian template
title model mpi IO output from nwp
undef 9.999E+20
xdef 751 linear 70.0000 0.1000
ydef 501 linear 15.0000 0.1000
zdef 51 linear 1 1
tdef 73 linear 00Z01JAN2022 60mn
vars 26

endvars`

with the output is

<Exception: unsupported format: %fh>

Problem using function 'to_netcdf()'

Hi, I am using python 3.9 and i have a problem using xgrads to convert a GrADS dataset to a NetCDF dataset with function tp_netcdf().

The error infomation is:

OSError: [WinError 8] 内存资源不足,无法处理此命令。

Any idea?

Add conda installation support

I have tried to install xgrads with conda (with mamba actually) and I got a nothing provides requested xgrads error message

I then had a look at the xgrads GH page and found out that you currently can only use pip install xgrads. The pip installation worked

You may want to:

  • add a section about installation to your nice documentation
  • consider providing a way to install with conda

How to read little-endian data?

Hi, my output data is abnormal obviously when I read Sea Surface Temperature. then 'CtlDescriptor' shows that it is little-endian data. Does xgrads read big-endian data by default? What should i do if i want to read little-endian data?
The following is my ctlfile:

  • obtained from mksst.f on 2001/07/06
  • basic state
  • derived from Shea's SST climatology
    DSET ^sstsum.grd
  • BYTESWAPPED
    OPTIONS SEQUENTIAL YREV
    TITLE BASIC STATE
    UNDEF -999.
    XDEF 64 LINEAR 0. 5.625
    YDEF 32 LEVELS -85.761 -80.269 -74.745 -69.213 -63.679 -58.143 -52.607
    -47.070 -41.532 -35.995 -30.458 -24.920 -19.382 -13.844 -8.3067 -2.7689
    2.7689 8.3067 13.844 19.382 24.920 30.458 35.995 41.532 47.070 52.607
    58.143 63.679 69.213 74.745 80.269 85.761
    ZDEF 1 LEVELS 300
    TDEF 1 LINEAR 15jan2000 1mo
    VARS 1
    t 0 99 mean SST [K]
    ENDVARS

output from 'CtlDescriptor(file=ctl)':

......
indxPath:
stnmPath:
title: BASIC
undef: -999.0
zrev: False
yrev: True
dtype:
template: False
periodicX: True
cal365Days: False
sequential: True
byteOrder: little
......

and abnormal SST output:

[[[ 1.76228614e-26 1.76228614e-26 1.76228614e-26 ... 1.76228614e-26
1.76228614e-26 1.76228614e-26]
[ 1.76228614e-26 1.76228614e-26 1.90864627e+09 ... 1.76228614e-26
1.76228614e-26 1.76228614e-26]
[-3.71253724e+24 -6.88422253e-09 -9.18673025e+34 ... 1.76228614e-26
6.82927872e+09 2.03454761e-06]
...

Bigedian data seems don't convert to the compiler.

So we may get the error:

Big-endian buffer not supported on little-endian compiler

If we use open_CtlDataset(ctl_path) as xarray data and use it in pandas or someting else.

And xarray will Automatically decode netCDF data to native endianness, so we may use .to_netcdf method to convert it and reload to solve this error.
So I'm not sure if this feathure should be added to this repository or people can just use the function of xarray.
If any one meet the same mistake, hope this can help.

Shoud the nc file add CRS according to cf-conventions?

Recently I've learned the cf-conventions that defines a way to store crs in .nc file and pyproj gives a method to get crs from and to nc.
So is it possible to add crs when converting .nc? Otherwise we still need the original .ctl files to store the projection information. It's weird.
Thanks again for your work. It helps a lot in my work.

Cannot read templated file name

The following name template doesn't work DSET ^R13537439_%y4%m2%d2%h2%n2.raw.gz.

  File "/usr/lib/python3.8/genericpath.py", line 50, in getsize
    return os.stat(filename).st_size
FileNotFoundError: [Errno 2] No such file or directory: 'radar/R13537439_%y4%m2%d2%h2%n2.raw.gz'

modify ctl?

请教一下是否可以读取ctl进行修改,并利用修改后的ctl进行文件读取?

Problem using xgrads and plotting

I am using python 3.8 and i have a problem using xgrads in a loop while creating charts.

If I am only reading the datasets, the program doesn't raise an error. However if I read the dataset and create a plot (either with .plot or with the matplotlib library) an error related to the datetime format of the .ctl file is raised in the second iteration of the loop. After creating the plot, even a simple print(datetime.strptime('30 Nov 00', '%d %b %y')) is not working anymore.

I tried converting my binary files in netcdf (with open_CtlDataset('input.ctl').to_netcdf('output.nc') ) and using them for creating the charts and a similar issue is raised. I found that if I create all the .nc files in a first loop and then creating all my charts in a second loop, the error will not be raised.

Any idea where this issue is coming from ?

Don't support .ctl containing EDEF description

DSET ^ecmf_medium_10m_uv-component_of_wind.dat
TITLE ENSEMBLE DATA
UNDEF 9.999E20
XDEF 161 LINEAR 70.0000 0.500000
YDEF 111 LINEAR 0.000000 0.500000
ZDEF 1 LEVELS -9999.0
TDEF 41 LINEAR 00Z01Jan2021 6hr
EDEF 51 NAMES c00 p01 p02 p03 p04 p05 p06 p07 p08 p09 p10 p11 p12 p13 p14 p15 p16 p17 p18 p19 p20 p21 p22 p23 p24 p25 p26 p27 p28 p29 p30 p31 p32 p33 p34 p35 p36 p37 p38 p39 p40 p41 p42 p43 p44 p45 p46 p47 p48 p49 p50
VARS 2
u10 0 99 10 metre U wind component
v10 0 99 10 metre V wind component
ENDVARS

When use "CtlDescriptor" to show the descriptions,
e.g ctl = CtlDescriptor(file='C:/Temp/ECEN/2021010100/ecmf_medium_10m_uv-component_of_wind.ctl')
print(ctl)
there is no edef printed out.

When use "ds.to_netcdf('lst.nc')", there is only one of ensemble member transfered into nc format.

Thanks for your attention.

open multiple ctl files

Although multiple binary data files can be described by a single .ctl file using template keyword, sometimes one may need to deal with multiple .ctl files and corresponding multiple .dat files. So I think it would be convenient to add a method open_mfdataset('./test/*.ctl'), which is similar to xarray.open_mfdataset('*.nc'), for dealing with multiple .ctl and binary files in consecutive times. This may not be too complicated using xarray.concat.

Avoid forgetting to name and causing errors

When reading such a ctl, it will report an error because we forgot to name the variable
ValueError: not enough values to unpack (expected 4, got 3)

dset D:\pycharm_data\12all.dat
title uv,rh
undef -9.99e33
xdef 241 linear 0 0.25
ydef 241 linear 0 0.25
zdef 34 levels 1000 975 950 925 900 850 800 750 700 650 600 550 500 450 400 350 300 250 200 150 100 70 50 30 20 10 9 8 7 6 5 4 3 2
tdef 1 linear 06Z14OCT2010 360mn
vars 8
u 21 99 
v 21 99 
hgt 21 99 
vor 21 99 
div 21 99 
w 21 99 
q 21 99 
tem 21 99 
endvars

Change it to this and it will work normally

dset D:\pycharm_data\12all.dat
title uv,rh
undef -9.99e33
xdef 241 linear 0 0.25
ydef 241 linear 0 0.25
zdef 34 levels 1000 975 950 925 900 850 800 750 700 650 600 550 500 450 400 350 300 250 200 150 100 70 50 30 20 10 9 8 7 6 5 4 3 2
tdef 1 linear 06Z14OCT2010 360mn
vars 8
u 21 99 u
v 21 99 v
hgt 21 99 hgt 
vor 21 99 vor
div 21 99 div
w 21 99 w
q 21 99 q
tem 21 99 term 
endvars

This problem occurs in

File "D:\Anaconda3\lib\site-packages\xgrads\core.py", line 880, in init
self.name, self.zcount, self.storage, self.comment = \

change it like this can solve the problem

if len(CtlVar.__reBlank.split(oneLineStr.strip(), maxsplit=3))== 3:
            self.name, self.zcount, self.storage = \
                CtlVar.__reBlank.split(oneLineStr.strip(), maxsplit=3)
            self.comment = self.name
else:
            self.name, self.zcount, self.storage, self.comment = \
                CtlVar.__reBlank.split(oneLineStr.strip(), maxsplit=3)

the lowercase brings some problem

I have some dir was uppercase,the dset in ctl file was lowercased by the core.py , so the program can't find the data file.
Can that be fixed?
thanks!

Recommend Projects

  • React photo React

    A declarative, efficient, and flexible JavaScript library for building user interfaces.

  • Vue.js photo Vue.js

    🖖 Vue.js is a progressive, incrementally-adoptable JavaScript framework for building UI on the web.

  • Typescript photo Typescript

    TypeScript is a superset of JavaScript that compiles to clean JavaScript output.

  • TensorFlow photo TensorFlow

    An Open Source Machine Learning Framework for Everyone

  • Django photo Django

    The Web framework for perfectionists with deadlines.

  • D3 photo D3

    Bring data to life with SVG, Canvas and HTML. 📊📈🎉

Recommend Topics

  • javascript

    JavaScript (JS) is a lightweight interpreted programming language with first-class functions.

  • web

    Some thing interesting about web. New door for the world.

  • server

    A server is a program made to process requests and deliver data to clients.

  • Machine learning

    Machine learning is a way of modeling and interpreting data that allows a piece of software to respond intelligently.

  • Game

    Some thing interesting about game, make everyone happy.

Recommend Org

  • Facebook photo Facebook

    We are working to build community through open source technology. NB: members must have two-factor auth.

  • Microsoft photo Microsoft

    Open source projects and samples from Microsoft.

  • Google photo Google

    Google ❤️ Open Source for everyone.

  • D3 photo D3

    Data-Driven Documents codes.