Some demo's to get you started exposing APIs from your jupyter notebooks.
Check the basic demo on how to expose html, text, json data, and html images and snippets here:
https://github.com/natbusa/kernelgateway_demos/tree/master/hello-world
This demo shows how easy it is to explose train, and scoring ML functions straight from the notebook
The full API, including tuning, scoring, exploration exposing both json data as well as png images can be found on the following link: https://github.com/natbusa/kernelgateway_demos/blob/master/iris-classifier/notebooks/iris-classifier.ipynb
This demo requires docker (https://www.docker.com/community-edition#/download) to be installed in the system. Also use curl or postman or your web browser to inspect that the API exposed by the notebook is working correctly.
You need to build the container with the command:
docker build . -t iris_webapp_demo
Type the following to run the container and expose the webapp on port 9000:
docker run -t -p 9000:9000 iris_webapp_demo
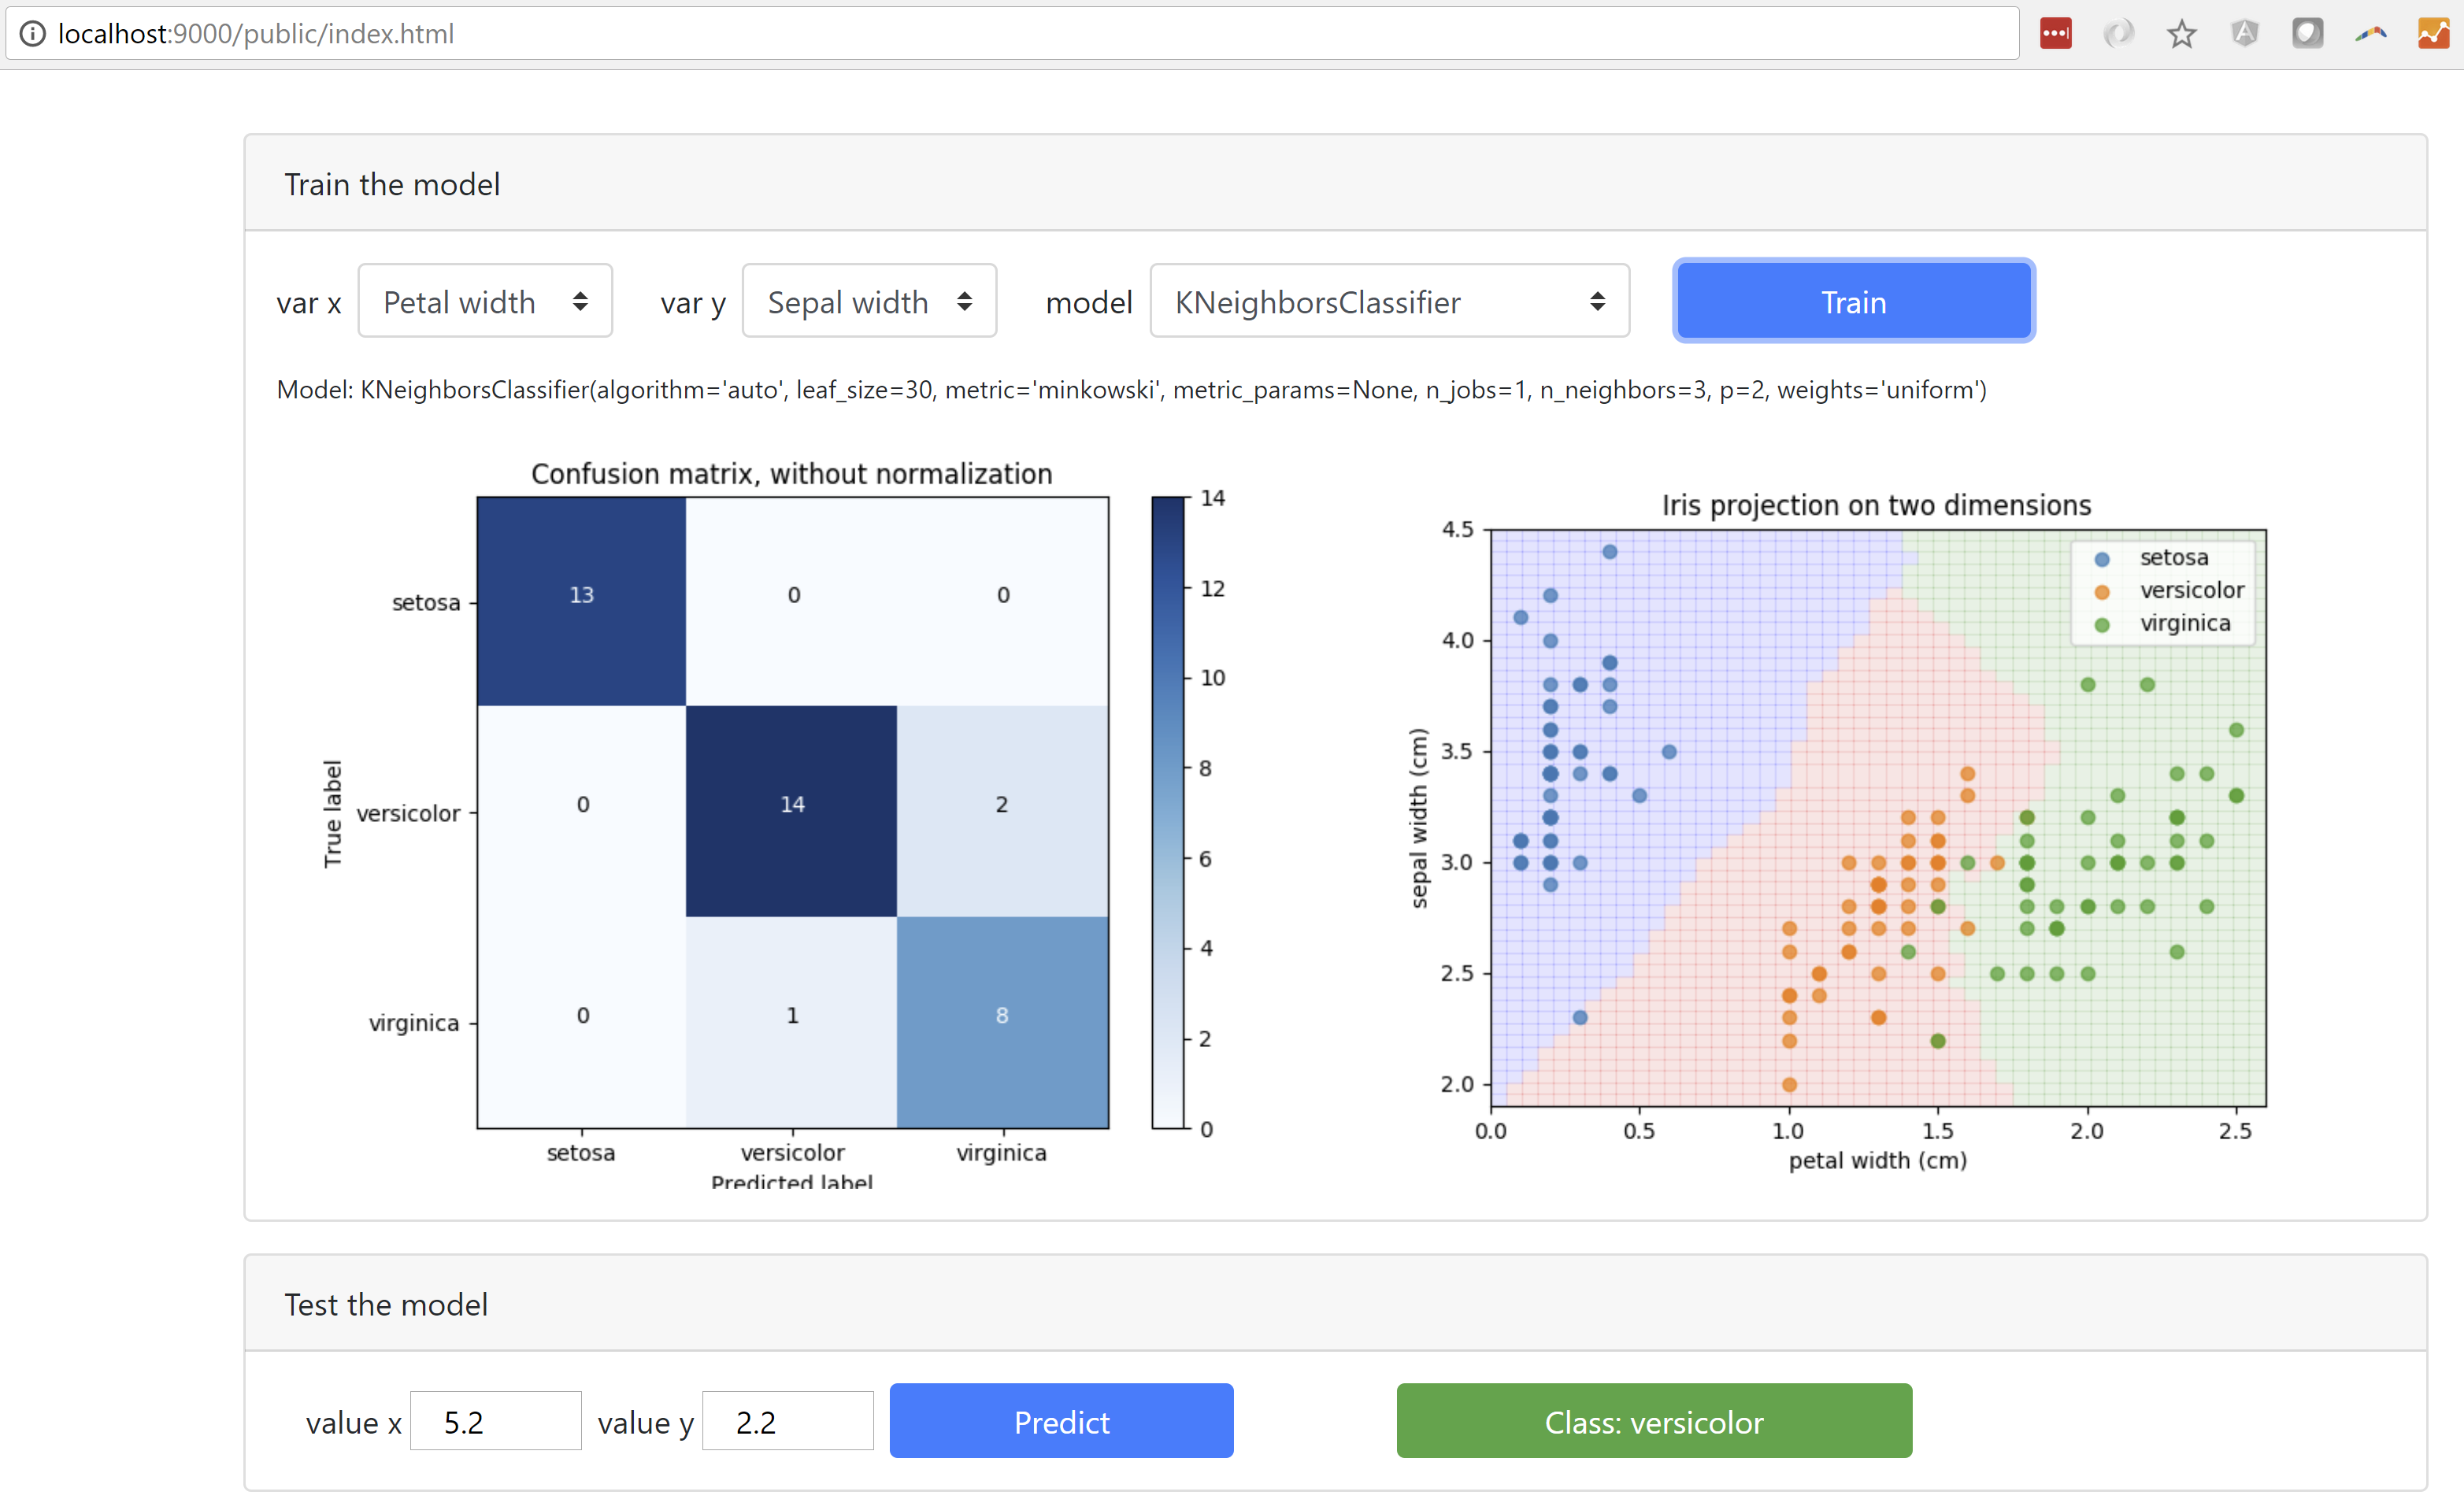
Demo will run on http://localhost:9000/public/index.html
The full API, including tuning, scoring, exploration exposing both json data as well as png images can be found on the following link:
https://github.com/natbusa/kernelgateway_demos/blob/master/iris-classifier/notebooks/iris-classifier.ipynb
When finished with this demo, you can remove stop and remove the container by typing:
docker kill iris_webapp_demo
docker rm iris_webapp_demo
In order to have the notebook working both in inline mode and in HTTP API serving mode with the kernel gateway we use an environment variable which is defined only while running the kernel gateway
KERNEL_GATEWAY = os.environ.get('KERNEL_GATEWAY', False)Next to that we have number of utilities to export images as inline embedded html snippets. and we mock the request data structure so we can test inline in the notebook before running the gateway and exposing the api
The Jupyter Kernel Gateway also exposes the list of end points via a swagger interface on:
http://localhost:9000/_api/spec/swagger.json
For convenience the swagger UI (https://github.com/swagger-api/swagger-ui) has been added to this docker container: http://localhost:9000/public/swagger/index.html?url=http://localhost:9000/_api/spec/swagger.json
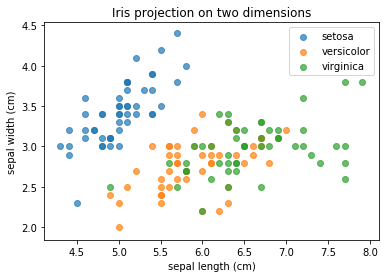
GET /plots/scatter/:x/:y
where :x and :y are dimension index from 0 to 3 according to the following list:
['sepal length (cm)', 'sepal width (cm)', 'petal length (cm)', 'petal width (cm)']
Try: http://localhost:9000/plots/scatter/0/1
GET /model/train/:x/:y?model=:m
Will train the model according to two dimensions respectively :x, :y, and :m
where :x and :y are dimension index from 0 to 3 according to the following list:
['sepal length (cm)', 'sepal width (cm)', 'petal length (cm)', 'petal width (cm)']
where :m from 0 to 5 fits one of the following models:
- KNN Classifier
- SVM classifier: linear kernel
- SVM classifier: gaussian kernel
- SVM classifier: polynomial kernel
- Decision Tree
- Decision Tree (depth limited)
For more information about this check
http://scikit-learn.org/stable/auto_examples/classification/plot_classifier_comparison.html
Try: http://localhost:9000/model/train/0/1?model=0,
should produce the following text, and train a knn model for the iris data
KNeighborsClassifier(algorithm='auto', leaf_size=30, metric='minkowski',
           metric_params=None, n_jobs=1, n_neighbors=3, p=2,
           weights='uniform')
GET /model/predict/?variable=:v
Will classify the data according to the trained model,
where :v is a tuple of comma separated values, one for each dimension of the model
Try: http://localhost:9000/model/predict?variables=5.2,2.2 should score the tuple [5.2, 2.2] and produce the following text,
versicolor
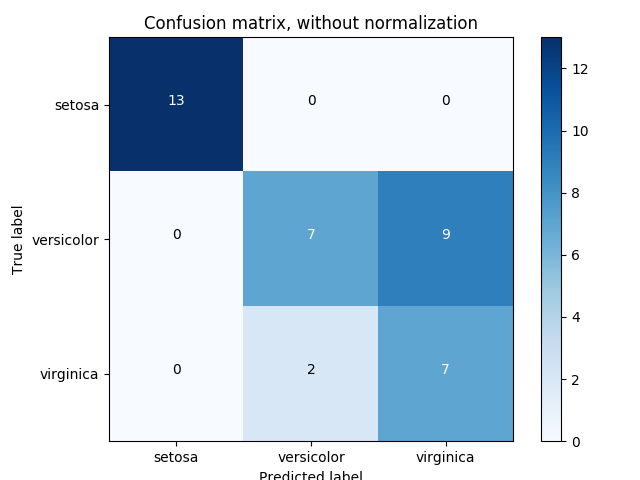
GET /model/confusion/plot
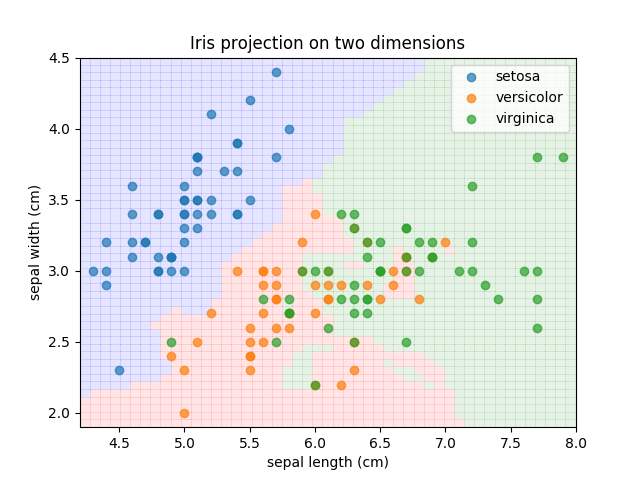
GET /model/predict/plot
Try: http://localhost:9000/model/confusion/plot
Try: http://localhost:9000/model/predict/plot
You can use your favourite js and css framework to render the API exposed by the Jupyter Kernel Gateway. This demo uses a minimal jquery framework with backgroung ajax calls and where data, once received is injected in the html DOM.
Have a look at the js:
https://github.com/natbusa/kernelgateway_demos/blob/master/iris-classifier/static/assets/js/script.js
Here is the jquery code which trains the model and generate the confusion matrix and the classification overlay pic.
$("button#train").click(function(){

    var var_x = $("#var_x").val();
    var var_y = $("#var_y").val();
    var model = $("#model").val()
    var path = "/model/train/"+var_x+"/"+var_y+"?model="+model

    $.get(path).done(function(data, status){
        $("#train_output").html("Model: " + data);

        var p1 = $.get("/model/confusion/plot");
        var p2 = $.get("/model/predict/plot");

        $.when(p1, p2).done(function(r1, r2) {
            $("#predict_plot").html(r1[0]);
            $("#confusion_plot").html(r2[0]);

            $("#predict_form").show()
        });

    });
});https://github.com/jupyter/kernel_gateway_demos
https://github.com/jupyter/kernel_gateway/tree/master/etc/api_examples


