This utility takes a plain text description of entities, their attributes and
the relationships between entities and produces a visual diagram modeling the
description. The visualization is produced by using Dot with GraphViz. There
are limited options for specifying color and font information. Also, erd can
output graphs in a variety of formats, including but not limited to: pdf, svg,
eps, png, jpg, plain text and dot.
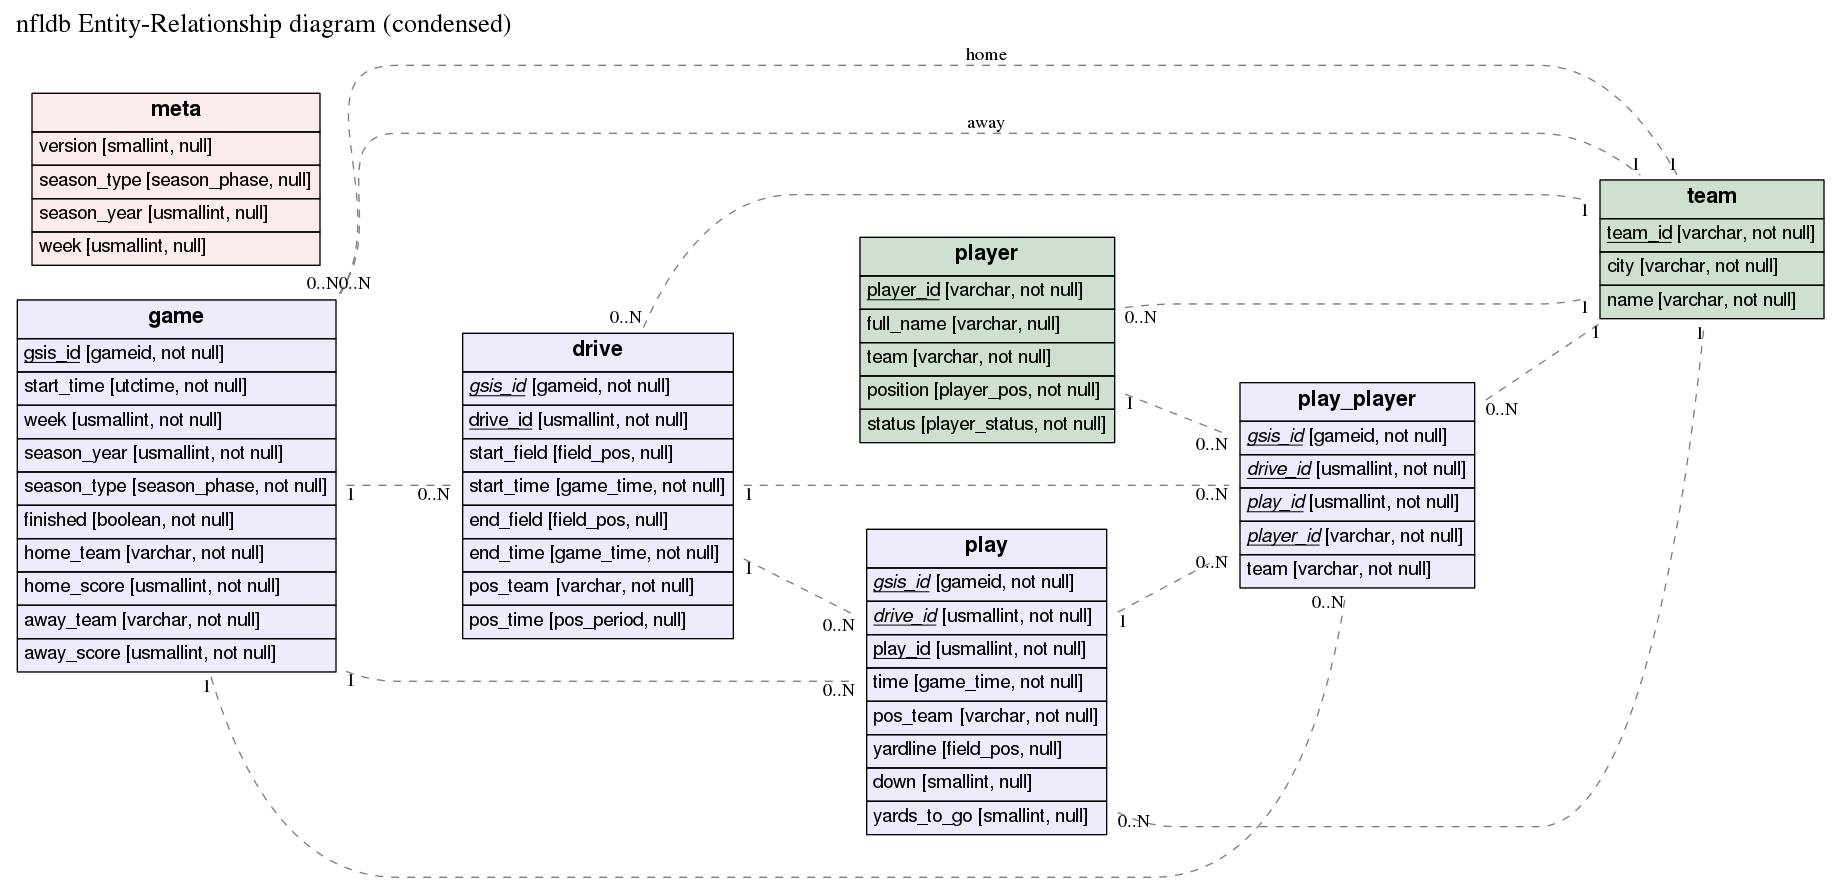
Here's an example of the output produced by erd (click on it for a larger PDF
version):
The corresponding er file is in the examples
directory.
erd requires Haskell and
GraphViz. Both are available for
Windows, Mac and Linux.
NB OSX users: for text formatting of keys (bold and italics) you may need to reinstall
graphvizwithpangosupport:
# OSX only
brew reinstall graphviz --with-pango
erd is on hackage, so you can install it with cabal (which is included with the Haskell platform):
cabal install erd
Alternatively, you can clone this repository and build from source:
git clone git://github.com/BurntSushi/erd
cd erd
cabal configure
cabal build
# binary is now at ./dist/build/erd/erd
Usage information is available with erd --help.
Before describing the ER file, let's try making an ER diagram from a small example:
$ curl 'https://raw.github.com/BurntSushi/erd/master/examples/simple.er' > simple.er
$ cat simple.er
# Entities are declared in '[' ... ']'. All attributes after the entity header
# up until the end of the file (or the next entity declaration) correspond
# to this entity.
[Person]
*name
height
weight
+birth_location_id

[Location]
*id
city
state
country

# Each relationship must be between exactly two entities, which need not
# be distinct. Each entity in the relationship has exactly one of four
# possible cardinalities:
#
# Cardinality    Syntax
# 0 or 1         ?
# exactly 1      1
# 0 or more      *
# 1 or more      +
Person *--1 Location
$ erd -i simple.er -o simple.pdf
The PDF should now contain a graph that looks like this:
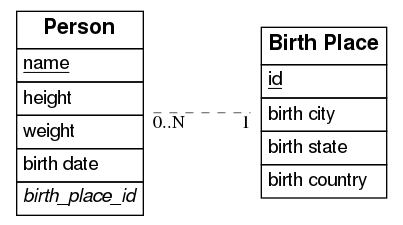
The er format allows one to describe a relational schema in terms of its
entities (tables), attributes (columns) and relationships between entities (0
or 1, exactly 1, 0 or more and 1 or more).
Entities are declared inside [ and ]. For example, this declares the entity
Person with no attributes:
[Person]
Attributes for an entity are then listed after its corresponding entity's
declaration. Each attribute should be on its own line. The following adds the
name and height attributes to the Person entity:
[Person]
name
height
Entity names and attributes may not contain spaces.
Any number of attributes may be declared as a primary key for its entity by
prefixing the attribute with a *. Similarly, an attribute may be declared
as a foreign key by prefixing the attribute with a +:
[Person]
*name
+birth_location_id
An attribute may be both a primary key and a foreign key by prefixing the
name with a * and a + in any order. Note that primary keys are underlined
while foreign keys are italicized.
Relationships can also be declared anywhere in an ER file. Every relationship includes exactly two entities (the two entities may be the same, for self-relationships). Each entity in a relationship must have exactly one of four cardinalities:
Cardinality    Syntax
0 or 1         ?
exactly 1      1
0 or more      *
1 or more      +
So for example, the following defines a relationship between Person and
Location that reads "every person belongs to exactly one location":
Person *--1 Location
And here's another example that can be read as, "every platinum album has one or more artists, but not every artist has a platinum album":
Artist +--? PlatinumAlbums
The er format also has limited support for customizing the appearance of your
ER diagram. For example, the following will show the entity with a background
color of #ececfc and a font size of 20:
[Person] {bgcolor: "#ececfc", size: "20"}
name
height
weight
Which looks like:

Alternatively, you can specify the background color of every entity with a special directive at the top of the file:
entity {bgcolor: "#ececfc", size: "20"}

[Person]
name
height
weight

[Location]
place
There are three other directives: title, header and relationship. The
title directive allows one to specify a title for the graph and provide
options for formatting it. The header directive allows one to customize the
formatting of every entity header. And similarly for relationship. Note that
global options are overwritten by local options.
Note that directives must come before anything else in an ER file.
Here's an example depicting the first schema shown at the top of this README (note that this is auto-generated by nfldb-write-erd):
title {label: "nfldb Entity-Relationship diagram (condensed)", size: "20"}

# Entities

[player] {bgcolor: "#d0e0d0"}
  *player_id {label: "varchar, not null"}
  full_name {label: "varchar, null"}
  team {label: "varchar, not null"}
  position {label: "player_pos, not null"}
  status {label: "player_status, not null"}

[team] {bgcolor: "#d0e0d0"}
  *team_id {label: "varchar, not null"}
  city {label: "varchar, not null"}
  name {label: "varchar, not null"}

[game] {bgcolor: "#ececfc"}
  *gsis_id {label: "gameid, not null"}
  start_time {label: "utctime, not null"}
  week {label: "usmallint, not null"}
  season_year {label: "usmallint, not null"}
  season_type {label: "season_phase, not null"}
  finished {label: "boolean, not null"}
  home_team {label: "varchar, not null"}
  home_score {label: "usmallint, not null"}
  away_team {label: "varchar, not null"}
  away_score {label: "usmallint, not null"}

[drive] {bgcolor: "#ececfc"}
  *+gsis_id {label: "gameid, not null"}
  *drive_id {label: "usmallint, not null"}
  start_field {label: "field_pos, null"}
  start_time {label: "game_time, not null"}
  end_field {label: "field_pos, null"}
  end_time {label: "game_time, not null"}
  pos_team {label: "varchar, not null"}
  pos_time {label: "pos_period, null"}

[play] {bgcolor: "#ececfc"}
  *+gsis_id {label: "gameid, not null"}
  *+drive_id {label: "usmallint, not null"}
  *play_id {label: "usmallint, not null"}
  time {label: "game_time, not null"}
  pos_team {label: "varchar, not null"}
  yardline {label: "field_pos, null"}
  down {label: "smallint, null"}
  yards_to_go {label: "smallint, null"}

[play_player] {bgcolor: "#ececfc"}
  *+gsis_id {label: "gameid, not null"}
  *+drive_id {label: "usmallint, not null"}
  *+play_id {label: "usmallint, not null"}
  *+player_id {label: "varchar, not null"}
  team {label: "varchar, not null"}

[meta] {bgcolor: "#fcecec"}
  version {label: "smallint, null"}
  season_type {label: "season_phase, null"}
  season_year {label: "usmallint, null"}
  week {label: "usmallint, null"}

# Relationships

player      *--1 team
game        *--1 team {label: "home"}
game        *--1 team {label: "away"}
drive       *--1 team
play        *--1 team
play_player *--1 team

game        1--* drive
game        1--* play
game        1--* play_player

drive       1--* play
drive       1--* play_player

play        1--* play_player

player      1--* play_player
erd only exposes a subset of formatting options made available by GraphViz.
I'm not entirely opposed to expanding this list if there's a compelling reason
to do so, but I'd prefer to keep it small and simple.
Note that not all options are applicable on all items. For example, a title cannot have a background color (it will just be ignored by GraphViz).
Colors can be specified in hexadecimal notation prefixed with a #, e.g.,
#3366ff or they may be written as their English
names.
- label A plain text string used to label the item. For entity names and
attributes, a label is shown next to the name in square brackets. For
relationships, a label is drawn near the center of the edge. For the special
titledirective, the label corresponds to the graph title. - color Specifies the font color. Valid everywhere.
- bgcolor Specifies the background color. Only valid for entities and attributes.
- size Specifies the font size. Valid everywhere.
- font Specifies the font. Valid everywhere. See
this and
this for
information about fonts in GraphViz. TL;DR: Stick with one of the following:
Times-Roman,HelveticaorCourier. - border-color Border color. Only works for entities or attributes.
- border Border size in pixels. Only works for entities and attributes.
Formatting options are always specified as key-value pairs in curly braces,
where the opening curly brace starts on the same line as the
entity/attribute/relationship/directive. The option name precedes a colon and
the option value comes after the colon in double quotes (even for integer
values). The value is then proceded by either a comma or an ending curly brace.
Also note that trailing commas are allowed and that options may be specified
over more than one line. For example, the following is a valid er file:
[Person]
  name {
    label: "string",
    color: "#3366ff", # i like bright blue
  }
  weight {
    label: "int",}
I don't intend for erd to have a large feature set with a lot of options for
customizing the appearance of ER diagrams. erd should produce diagrams that
are "good enough" from simple plain text descriptions without a lot of
complexity. erd will implicitly trust GraphViz to "do the right thing"
without a lot of fiddling with its options.
If you have more exotic needs, then I suggest that either erd is not the
right tool, or you could use erd to output an er file as a dot file.
You can then customize it further manually or using some other tool.
You can output a dot file using the --fmt option or by simply using it as
a file extension:
erd -i something.er -o something.dot
Note though that erd writes entities as HTML tables, so the resulting dot
may not be so useful. (I would not be against a small addition to erd that
uses no formatting and writes entities as regular dot tables.)
Surprisingly, the only other software I'm aware of that translates a plain text description of a relational schema to a graphical visualization is erwiz. The project appears to be abandoned.
If you've used erwiz before, you'll notice that the format of the er file
is inspired by it. The er format is a bit more lightweight, but its general
structure is similar.


