nicholasericksen / ghv-data Goto Github PK
View Code? Open in Web Editor NEWThis an application that is intended to serve information from the Science Barge in Yonkers, NY as well as other weather data.
This an application that is intended to serve information from the Science Barge in Yonkers, NY as well as other weather data.


We now have content to enter into the pages.
Please add this link https://crt-climate-explorer.nemac.org/ as an embed if possible under
Adaptation and Resilience>>Think Globally, Act Locally>>>NOAA Resilience Toolkit: Climate Explorer
Biggest One: a new name!
Can we change the url by tomorrow so I have time to change the links on our website and the curriculum?
Something more fitting to its content... like:
https://climate-curriculum-resource-app/GHV-data
Or if you would still like your name on it:
https://climate-app/ericksen-GHV-data
Not sure how renaming works and if you need the github part....
The rest of these edits go through the app from tab to tab, button to button, top down....
Climate Change Impact>>Polar and Glacial Ice>>Antarctic and Greenland Land Ice
Add titles and captions:
Pic 1/3 Title: ANTARCTICA MASS VARIATION SINCE 2002
Caption: Rate of change = -127.0 Gigatonnes/year.
Data from NASA's GRACE satellites show Antarctica shed approximately 125 gigatons of ice per year, since 2002, causing global sea level to rise by 0.35 millimeters per year.
Pic 2/3 Title: GREENLAND MASS VARIATION SINCE 2002
Caption: Rate of change = -286.0 Gigatonnes/year
Data from NASA's GRACE satellites show that the land ice sheets in both Antarctica and Greenland have been losing mass since 2002. Both ice sheets have seen an acceleration of ice mass loss since 2009. (Source: GRACE satellite data)
Pic 3/3 Title: According to a recent study, Antarctica's land ice losses in the last decade were primarily concentrated in West Antarctica's Pine Island Bay sector and the northern tip of the Antarctic Peninsula.
This is most likely due to ongoing and past acceleration of glaciers into the sea, "a result of warmer ocean waters, which bathe the buttressing floating sections of glaciers, causing them to thin or collapse." (Eric Rignot of NASA's Jet Propulsion Laboratory)
Climate Change Impact>>Polar and Glacial Ice>>Arctic Sea Ice and Albedo Effect
First, please rename to just "Arctic Sea Ice" (no albedo effect as we don't have an image for it)
Next, please caption:
(1/2): Arctic sea ice reaches its minimum each September. September Arctic sea ice is now declining at a rate of 13.2% per decade, relative to the 1981 to 2010 average. This graph shows the average monthly Arctic sea ice extent each September since 1979, derived from satellite observations.
(2/2): Could the Arctic be essentially ice-free by mid-century? Model simulations of Arctic sea ice extent for September (1900-2100) based on observed concentrations of heat-trapping gases and particles (through 2005) and four scenarios. These newer model (CMIP5) simulations project more rapid sea ice loss compared to the previous generation of models (CMIP3) under similar forcing scenarios. (Figure source: adapted from Stroeve et al. 2012).
>Climate Change Impact>>Water Cycle and Extreme Weather>>>Freshwater Availability and Consumption
Captions
(1/2): Climate change is projected to reduce water supplies in some parts of the country. This is true in areas where precipitation is projected to decline, and even in some areas where precipitation is expected to increase. Compared to 10% of counties today, by 2050, 32% of counties will be at high or extreme risk of water shortages. Numbers of counties are in parentheses in key. Projections assume continued increases in greenhouse gas emissions through 2050 and a slow decline thereafter (Source: National Climate Assessment 2014).
(2/2): a) Groundwater aquifers are found throughout the U.S., but they vary widely in terms of ability to store and recharge water. The colors on this map illustrate aquifer location and geology (Figure source: USGS).
(b) Ratio of groundwater withdrawals to total water withdrawals from all surface and groundwater sources by county. The map illustrates that aquifers are the main (and often exclusive) water supply source for many U.S. regions, especially in the Great Plains, Misssissippi Valley, east central U.S., Great Lakes region, Florida, and other coastal areas. Groundwater aquifers in these regions are prone to impacts due to combined climate and water-use change. (Data from USGS 2005).
>Climate Change Impact>>Water Cycle and Extreme Weather>>>Extreme Precipitation Map
(take out "interactive" from the button title as we are replacing with two images:
Please download these two images and copy/paste the captions to be included as well:
(1/2): https://nca2014.globalchange.gov/report/our-changing-climate/heavy-downpours-increasing
(2/2) https://nca2014.globalchange.gov/report/sectors/water#narrative-page-16607
>Climate Change Impact>>Water Cycle and Extreme Weather>>>NOAA State of the Climate
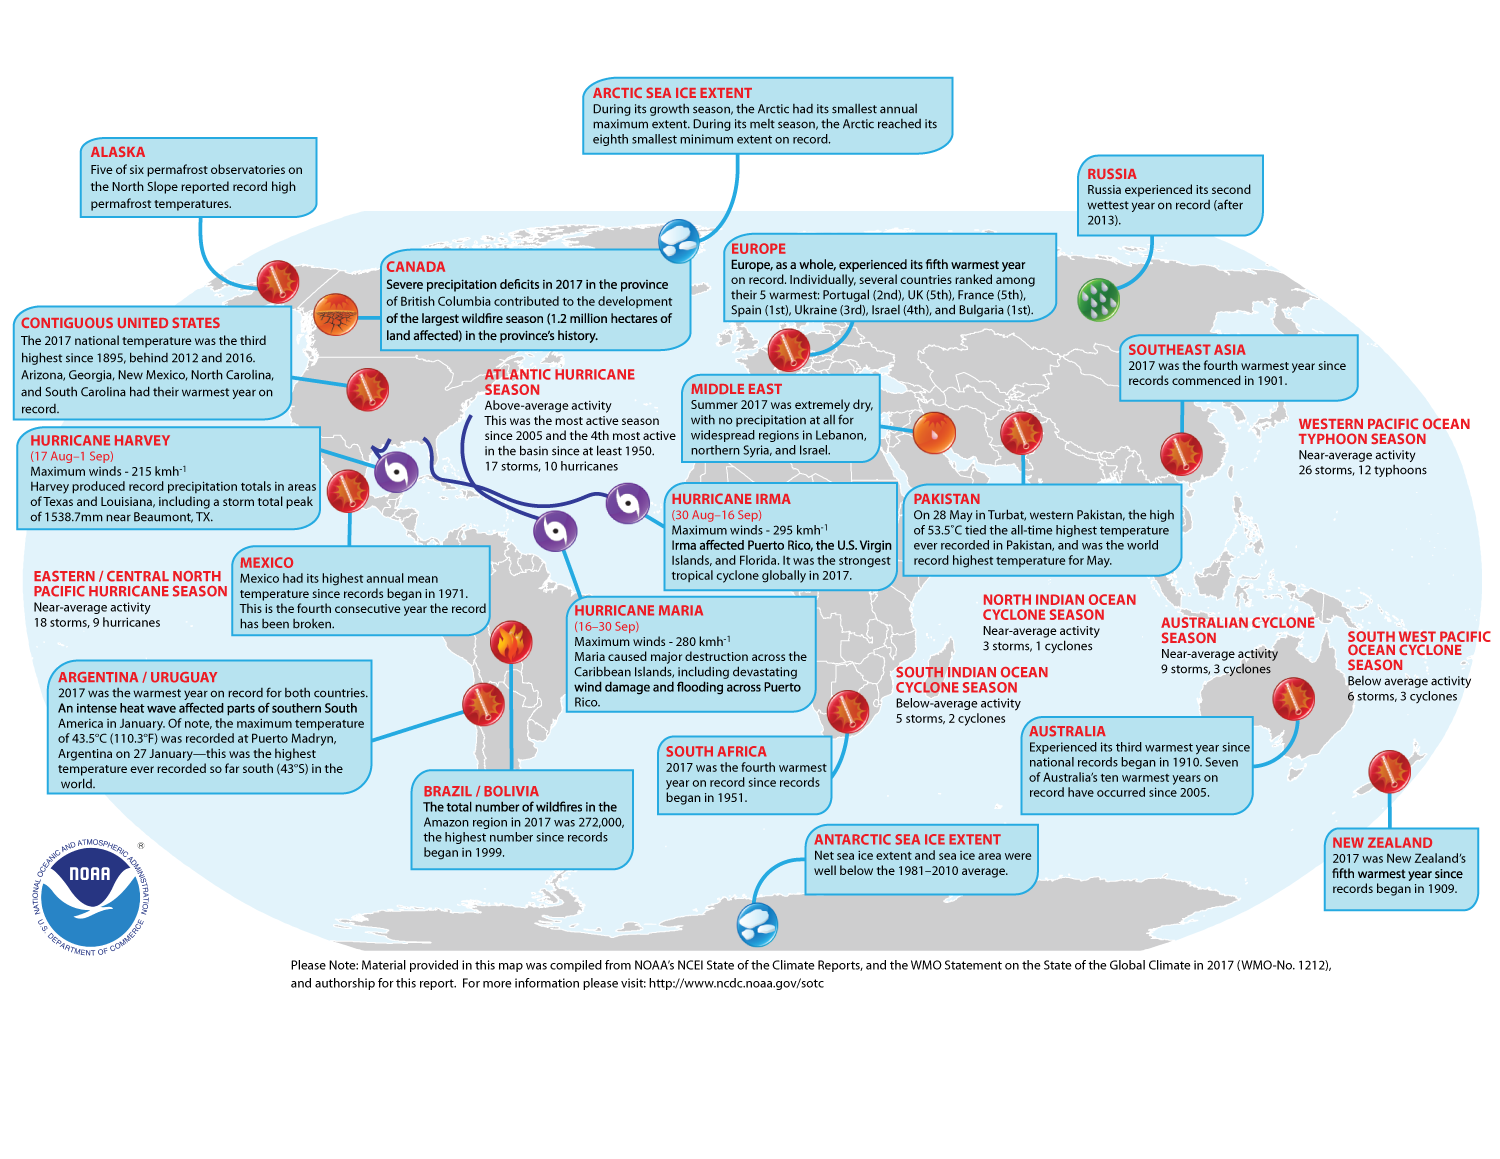
page doesn't load.... if not fixable, maybe just include this static image, downloaded here: https://www.climate.gov/sites/default/files/bigextremes-2017-bams.png
And then change title to say "NOAA State of the Climate: Extreme Weather Events 2017"
Climate Change Impact>>Water Cycle and Extreme Weather>>>The Cost of Extreme Weather
First remove the first two pictures: the flooded subway, and "Observed Change in Heavy Precipitation" as it was now featured in an earlier tab. Once those pics are gone, caption the rest:
(1/9): As extreme precipitation events become more common, so does extreme flooding. Our stormwater infrastructure was not designed for our rapidly changing climate. This slideshow shows the many effects that extreme rain and wind can cause.
(2/9) The map above shows the number of times between 1980 and August 2011 that a U.S. state has been involved in a weather or climate disaster whose region-wide damage totals were at least one billion dollars at the time they occurred. The maps are based on records of economic losses kept by NOAA's National Climatic Data Center.
(3/9): It's official: 2017 was the costliest year on record for the United States when it comes to natural disasters According to NOAA, the disasters caused $306 billion in total damage in 2017, with 16 events that caused more than $1 billion in damage each. The bulk of the damage, at $265 billion, came from hurricanes Harvey, Irma, and Maria, as well as wildfires on the west coast.
(4/9): Once considered 500-year events, storms like Hurricane Katrina (2005) now occur decades apart or less. Hurricane Katrina destroyed much of the Gulf Coast, especially the city of New Orleans. Severe flooding and inadequate response left many without drinking water, food, or proper first aid for days, if not weeks. Over 1,200 deaths are attributed to Katrina and $161 billion in losses.
(5/9) Flooding in Louisiana has become more common in recent years, even in the absence of a hurricane. In August 2016, prolonged rainfall resulted in catastrophic flooding in the state. Thousands of houses and businesses were submerged.
(6/9) Hurricanes and heavy rain events have different impact depending on where they hit and when. Hurricane Irene (2011) brought 16 inches of rain to upstate New York after an already unseasonably wet August. Saturated soils gave out to erosion and roads and bridges were washed out. It is now considered the most costly Category 1 storm in history.
(7/9) Some storms bring surges along the coast from high winds, instead of heavy rain. This was the case for Superstorm Sandy (2012) Winds swept the peak tide into highly developed areas with great population densities. As a result of the salt-water flooding, economic losses topped $65 billion.
(8/9) As the number of billion dollar weather events continues to rise, what do you think that will mean for the cost of goods and services? For taxes and insurance rates? For equitable access to basic needs?
(9/9) Knowing how vulnerable a location is to costly weather disasters is important to the people who live there, and to emergency planners and insurers. Ultimately, records like this should help scientists figure out if, in addition to the known influence of population growth and development, long-term climate change is contributing to the cost of weather-related disasters.
Pic 10: please delete (one with the 5 hurricanes in the gulf)
Climate Change Impact
>>Polar and Glacial Ice
>>>Antarctic & Greenland Land Ice (add c)
>>>Arctic Sea Ice and Albedo Effect (add c)
>>Forests (1 r)
>>Forest Pest Video (1 r)
>>Animal Ranges --> Wildlife (name change)
>>>A Warmer World for Arctic Animals (add c)
Gulp would be nice to have in order to watch this project and recompile the Handlebars templates automatically. Also any other changes, minifying the code etc.
UPDATE: we should consider further the exact tooling requirements
Currently the HRECOS data stream is using a perl script to generate data at a specific url. We should try and have this formatted as JSON or JSON-P for easy consumption.
Cross domain header issues are also present right now and need to be reviewed.
Just went through all the content and here is what needs to be repaired or replaced. Let me know if you need a replacement, bc I have alternatives for a lot of this content, I think. All things considered, I'm impressed with how much loads on this first run through! I think if downloaded content isn't playing bc of a space issue, deleting the Scenic Hudson "Yonkers and Hudson Valley Coastline" software should free up a lot of space (see below)
EDIT: It seems a lot of content that doesn't load or are repeat links are bc they were incorrect on my pdf guide. All the content that you need has already been downloaded and labeled in the folders I emailed you. So please refer to those folders when making corrections. That way you don't have to follow links to find downloads first, etc etc. Also, there were some places where additional pictures for slideshows were added into those folders but not referenced in the pdf guide necessarily. So cross-referencing the folders is best b/c they are MORE right than the pdf, which has definite errors and omissions.
Broken widgets or incorrect links in bold:
Climate Change Impact
>>Water Cycle and Extreme Weather
>>>Extreme Precipitation (interactive map)
>>>NOAA The State of the Climate
>>Oceans and Coasts
	>>>**NOVA Impact of Ocean Acidification** (should be a DL file - repeats previous Youtube
                  video from ACE)
	>>>**Yonkers and the Hudson Valley Coastline** (dnl - DELETE THIS CONTENT SHOULD SAVE
                  A LOT OF SPACE - I have a replacement to try out under a new name)
>>Agriculture
	>>>USDA Plant Hardiness Zone Map (should be a replacement widget on Arbor Day website?)
>>Wildlife (title change)
	>>>**A Warmer World for Arctic Animals** (dnl)
	>>>**Species Range Change Interactive** (dnl - have DL images we could use instead)
	>>>**Bees are feeling the STING** (video can be downloaded... it loads whole NASA page)
>>Human Health and Disease
	>>>**Pathways and Regional Vulnerabilities** (images dnl)
	>>>**Air Quality Map Tool**
	>>>**Water Contamination** (image dnl)
Adaptation and Resilience
>>The Global Effort
>>>Paris Agreement Interactive (times out while loading)
>>Coastal Resilience
>>>Estuary Model and Coastal Resilience (CURB) (dnl)
>>>Coastal Resilience (broken link/page symbol in player)
>>Think Globally, Act Locally
>>>Emergency Preparedness
>>>>Weather Ready Nation Videos (loads carbon footprint
calculator widget instead)
>>>Designing Cities for Resilience
>>>>Sustainable Cities: Nature Based Solutions (broken page symbol in player)
>>>>Be Water Wise (images dnl)
>>>Tracking National Progress
>>>>Climate Progress by State Google Map
Sometimes the iframe and videos take a long time to load, we should add a spinner while loading
There will be a couple of distinct different sections of information that we would like to present. They include:
Starting with Menu 1, now called "Climate Science"
The "Why Data Matters" video, formerly under another tab (Real Time Climate Monitoring) will be migrated to the top of this Menu (1.1)
The Climate versus Weather tab will be migrated from fourth slot to the second slot on this Menu, (1.2)
The content in this tab doesn't need to change.
The Polar and Glacial Ice tab will be migrated to Main Menu 2 (now to be called Climate Impact) to the top spot 2.1
All the sub-tabs can be migrated with it (more content will be added, but we'll get to that later)
A NEW tab will be inserted into the 1.3 spot, to be called "Historical Climate Change: Clues in Trees and Ice"
It will have a new video added and The NOVA Ice Core Video migrated from "Real Time Climate Monitoring" to here:
1.3.1: "Dendrichronology: What tree cores tell us about local climate history." (You Tube link: https://youtu.be/-Vfg4GieRTc)
1.3.2: "Climate History in Ice Cores (NOVA video segment: Extreme Ice)" (downloaded video migrated from Real Time Climate Monitoring to here)
1.4 Real Time Climate Monitoring tab will now take the fourth spot in Menu 1.
The "Why Climate Data Matters" video and the NOVA video have already been migrated out of this tab.
1.4.1 NASA Climate Time Machine will stay and move to the top of this Menu
1.4.2 Local Weather and River Conditions (HRECOS Monitoring System) will be NEW content. Hopefully the graphing tool can be embedded.
1.5 Natural Forces: volcanoes, sunspots, and meteors, oh my! is a NEW tab with NEW content
1.5.1 **Natural Cycles: Evidence of Change (Source: Video by National Academies of Science Engineering and Medicine) ** is a YouTube link: https://youtu.be/2_10jtPCjQw
1.5.2 Natural Climate Forces is a slideshow with captions. The pictures and captions will be in the folder
1.5.3 NASA Video Comparing Natural & Human Factors is a migrated tab originally found under Global Temperatures and Greenhouse Gas Concentrations.
1.6 The Greenhouse Effect and Anthropogenic Warming is now the NEW NAME for the tab Global Temperatures and Greenhouse Gas Concentrations
It will have some new content, and a few tabs that were there that have been migrated out.
1.6.1 The Greenhouse Effect slideshow will gain 2 additional pictures with captions (see folder)
1.6.2 Global Temperature Time Series Map (1884-2012) is a different version (see folder for DL) that includes a temperature scale. There are options for sized to DL on NASA's site if this is too big
1.6.3 CO2 and Global Temperature Correlation (Past 800,000 years) is renamed from "Historical CO2 and Global Temperature Correlation" and has a new picture to replace this one (see folder). The caption can remain the same though. Please make sure the "2" on CO2 is subscripted.
1.6.4 Natural and Human Factors is a NEW tab and will contain only a single picture with a caption (see folder)
1.6.5 Post Industrial CO2 and Temperature (1850-2015) (with the 2 subscripted) is a rename from "Modern Era CO2 and Temperature Correlation) and can keep the caption. Check the folder to see if my new Download is higher resolution that the picture currently on the app.
Dead Links for Fixing or Total Recall:
1) Sea Level Rise Local Scenarios: Scenic Hudson Interactive Map - ISSUE: does not load on Chrome
Currently Found at Climate Monitoring>>Sea Level Rise>>Sea Level Rise Local Scenarios...
We will now use Node, Express, and Twig for the application stack
Although not much use in the setup previously discussed, we can aggregate all information for the different kiosks under a single homepage.
The embed works to bring you to the first screen, but then you can't actually get to the imaging interactive content from there... (Launch Button not showing for some reason)
Can you embed directly from this site:
https://coast.noaa.gov/slr/#/layer/slr
We should have a back button in the top right corner to be able to go between menu levels
Main Menu:
Climate Monitoring
Impact on Biotic Communities
Impact on Water Cycle & Resources
Interesting Idea to display the content in slideshow like style. Two arrows in the side rails of the page. Content in the center.
The exact requirements for the category sub links is still being determined/provided.
Based on the mocks, some of the buttons will be links to external resources, etc??
Lets change the url so people can make sense of what they are actually accessing. We will need to purchase a domain name or make use of some DNS magic with any domain names you currently own if possible.
Can we change the url?
Something more fitting to its content... like:
https://climate-curriculum-resource-app/GHV-data
Or if you would still like your name on it:
https://climate-app/ericksen-GHV-data
Not sure how renaming works and if you need the github part....
No need for my name to be there ;)
Hi all. After a YEAR of putting this aside, we are full speed ahead on some big changes and wrapping up the work before we unveil our distance learning module.
In the next few weeks, we will be reorganizing content to fit into three homepage tabs/links:
In addition, I'm in the process of buying new sizable button icons to possibly change the aesthetic of the main menus, so their is a visual representation to go along with the button text. I'll include those in a different thread, though they are not a priority as much as fixing and updating content is.
We will be removing some dead links altogether. I'll start a CLEAR OUT YOUR DEAD thread for that.
We may repair some links or swap sources. I'll start a WE CAN REBUILD HIM: WE HAVE THE TECHNOLOGY thread for that.
We will definitely be adding content. I'll start a "TRY NOT: DO OR DO NOT, THERE IS NO TRY" thread for that.
In the meantime.... can we try to find ways to display as many images in full screen? I can identify specific ones, but especially graphs that need to be used.... Full screen or close to it is best.
Each slide should be able to have a different title. This is currently not supported.
Climate Change Impact>>Polar and Glacial Ice>>Antarctic and Greenland Land Ice
Add titles and captions:
Pic 1/3 Title: ANTARCTICA MASS VARIATION SINCE 2002
Pic 2/3 Title: GREENLAND MASS VARIATION SINCE 2002
Moving on to Main Menu tab 2: Climate Impact
This menu will consist of the following sub tabs:
2.1 Polar and Glacial Ice
2.2 Water Cycle and Extreme Weather
2.3 Oceans and Coasts
2.4 Agriculture
2.5 Forest Cover
2.6 Wildlife
2.7 Human Health and Disease
All of the tabs currently under Main Menu 3: Adaptation and Resiliency (Deluge and Drought videos, Freshwater, and Water Contamination) EXCEPT for Water and Energy will be migrated into 2.2 Water Cycle and Extreme Weather
2.1 Polar and Glacial Ice
There was material in the first tab before the changeover that seems to have gone missing... In any case, the new layout will be in a zipped folder. This Menu will have 4 tabs:
2.1.1 NASA Images of Change: Muir Glacier (website: [https://climate.nasa.gov/images-of-change?id=376#376-muir-glacier-melt-alaska] )
2.1.2 Land Ice Graphs (slideshow with captions)
2.1.3 National Snow and Ice Data Center _Ch_arctic Sea Ice Graph website widget
2.1.4 Sea Ice (slideshow with captions)
2.2 Water Cycle and Extreme Weather I'm still working out the end of this menu... I want to add new images in a slideshow that include the most recent storms from 2017 and 2018. Most of it will be as it shows up in the zipped folder and pdf file though. This menu had the content that needs to migrate over that I mentioned up top.
_My main question was whether you could combine the deluge and drought videos into 1 tab as a slideshow.
There is also a 3rd video zipped in that folder that is about the water cycle.
If not, skip the 3rd video and keep these two on Deluge and Drought.
Follow the pdf for the rest of the tabs
2.3 Oceans and Coasts The New content here will be at the top, with 2 video links about Ocean Acidification (one to youtube, the other downloaded)
The other 3 tabs are the same that you had before (can't find them with the new edits done) and include a widget for NOAA's Digital Coast, the Scenic Hudson Mapping Tool (if we could get it to load correctly) and the antarctica melting slideshow.
A declarative, efficient, and flexible JavaScript library for building user interfaces.
🖖 Vue.js is a progressive, incrementally-adoptable JavaScript framework for building UI on the web.
TypeScript is a superset of JavaScript that compiles to clean JavaScript output.
An Open Source Machine Learning Framework for Everyone
The Web framework for perfectionists with deadlines.
A PHP framework for web artisans
Bring data to life with SVG, Canvas and HTML. 📊📈🎉
JavaScript (JS) is a lightweight interpreted programming language with first-class functions.
Some thing interesting about web. New door for the world.
A server is a program made to process requests and deliver data to clients.
Machine learning is a way of modeling and interpreting data that allows a piece of software to respond intelligently.
Some thing interesting about visualization, use data art
Some thing interesting about game, make everyone happy.
We are working to build community through open source technology. NB: members must have two-factor auth.
Open source projects and samples from Microsoft.
Google ❤️ Open Source for everyone.
Alibaba Open Source for everyone
Data-Driven Documents codes.
China tencent open source team.