nodejs / benchmarking Goto Github PK
View Code? Open in Web Editor NEWNode.js Benchmarking Working Group
Home Page: https://benchmarking.nodejs.org
Node.js Benchmarking Working Group
Home Page: https://benchmarking.nodejs.org


![dependabot[bot] avatar](https://avatars.githubusercontent.com/in/29110?v=4 "dependabot[bot]")


This is a followup from a conversation I had last night with @littledan.
It would be great if we could put together some benchmarks of "node centric workloads" for the v8 team to profile against.
I've seen some of the WG's re-confirming membership by polling the WG members to make sure people are still interested/willing to be active.
Its probably time to do that for the benchmarking WG meeting.
Please respond to this issue confirming you are still interested and are willing to be active. Based on this information we'll trim down the WG membership to those who will be participating going forward.
@nodejs/benchmarking
The next meeting will be planned for the week of July 5. The draft agenda is:
I'll send out the invite to the participants so far. If you want to be added to the invite just let me know
Doodle poll for those not on the core invite list:
Hi,
I run the acmeair benchmark on ppc with cassandra.
I got an error from the cassandra driver, because
fromDateWeb
is undefined.
The reason is that the date string generated by __generateDate can't be parsed
by javascript Date(). The format for this date string is generated here.
For my time zone it results in a string like this:
Wed Nov 16 00:00:00 CET 2016
In case of mongodb, I don't get an error. However, the query doesn't find any fligts.
After fixing this issue, the through-put is slightly decreased and the footprint after load is higher.
I created a pull request for the acme-driver repository.
Hi, I just wanted to share a project I've been working on, Artillery, which is a Node.js-based load-testing tool. It offers several advantages over jMeter:
npm package making it very easy to installI'm hoping you'll consider using it. I'd be happy to help with writing Artillery load-testing scripts for this project and any other set up and integration tasks.
This issues is to discuss/identify candidate benchmarks. So far what we have on the list is:
We expect that we'll want multiple, with at least one to cover each use case identified in #5
Seem to have been failing since last week:
https://ci.nodejs.org/view/Node.js%20benchmark/job/benchmark-footprint-experimental/283/console
/home/iojs/build/workspace/benchmark-footprint-experimental/node/bin:/home/iojs/build/workspace/benchmark-footprint-experimental/node/out/Release/:/usr/lib/ccache:/usr/local/sbin:/usr/local/bin:/usr/sbin:/usr/bin:/sbin:/bin
Error: Cannot find module '/home/iojs/build/workspace/benchmark-footprint-experimental/node/benchmark/report-startup-memory.js'
at Function.Module._resolveFilename (module.js:440:15)
at Function.Module._load (module.js:388:25)
at Module.runMain (module.js:575:10)
at run (bootstrap_node.js:340:7)
at startup (bootstrap_node.js:132:9)
at bootstrap_node.js:455:3
I periodically compare performance of Node releases with a variety of workloads to identify regressions over time.
In my measurements, I've identified a consistent regression between the v0.12 and v4 releases running the 'Kraken' and 'JSBench' suites
On kraken one of the worst individual metrics is imaging_desaturate where we see it running at around 45% of the speed that it ran on 0.12.
I see this on the community releases of node.
These numbers below are just collected on my laptop running a 64bit copy that i'd compiled locally:
0.12.7:
kraken.imaging_desaturate x 10.52 ops/sec ±3.90% (28 runs sampled)
v4.1.2:
kraken.imaging_desaturate x 6.76 ops/sec ±69.70% (25 runs sampled)
Hello,
I wasn't sure about the high variability above, so I increased the time allowed to run:
0.12.7:
kraken.imaging_desaturate x 5.66 ops/sec ±13.66% (549 runs sampled)
v4.1.2:
kraken.imaging_desaturate x 1.02 ops/sec ±10.11% (101 runs sampled)
Given the large number of changes between the two copies of node, profiles are a little tricky to follow, since there seems to be quite a different code path with take in v4 vs 0.12.7
It would be interesting to know firstly if anyone else runs these benchmarks, and if so if they're seeing similar regressions?
Source for my test:
var benchmark = require('benchmark')
  , benmkzoo = require('./lib/benmkzoo.js');
var suite = new benchmark.Suite;

var bm = new benchmark( benmkzoo.kraken['imaging_desaturate'] );
bm.options.maxTime=200;
bm.options.minCount=200;
suite.push(bm);
//add tests
suite
// add listeners
.on('cycle', function(event) {
  console.log(String(event.target));
})
.on('complete', function() {
  console.log('Fastest is ' + this.filter('fastest').pluck('name'));
console.log(this);
})
// run async
.run({ 'async': true , 'maxTime' : 200});Once v7 becomes current we should add it the benchmark runs/data show
Once 0.10.X goes out of service we should remove it from the benchmark runs/data.
I propose we update the existing 0.10.X job to run against v7 instead (with a new id for the level of course) and then update the charts to show v7 instead of 0.10.X
@nodejs/benchmarking
Based on doodle poll http://doodle.com/poll/bs4qtd27656bbq9g
set for Tuesday June 7 @ 3PM EST
link for participants:https://hangouts.google.com/hangouts/_/hoaevent/AP36tYdJgVyLvEJcjSAgfFguEKxasZD03BHQiTuFA-iRFacF6bPrgA?eid=100598160817214911030&hl=en
For those who just want to watch: http://www.youtube.com/watch?v=K7jHuYxx5Hc
Events page: https://plus.google.com/events/c4igup1ladbd28kdustmjsph6kk
Google doc for minutes: https://docs.google.com/document/d/1E7Om4SkxV_MQkxDCq5ck7A-VqqdG0Vor8sVwZTQV8os/edit?usp=sharing
@gareth-ellis mentioned that in order to investigate differences between versions and/or between the same version between date we should include the commit hash for the build as part of the benchmark data stored.
This issues to remind us to do that.
Michael Paulson
[email protected]
Joined today with Yunong @Netflix. Have spent 6-7 months full time working on Falcor performance.
The V8 team is looking to close the gap on ES.next vs ES5 performance, i.e. make ES2015 and beyond features as fast as their (naive) counterparts in ES5. There's a preliminary performance plan available. This work will be beneficial for the Node community in particular, as users have a dedicated environment, i.e. don't need to transpile to make it work on older browsers.
Is there any interest to add particular ES.next benchmarks? Maybe with special focus on features that matter for Node? We have a partial ES6 port of Octane, but it's unclear how useful that is for real world Node ES6 performance.
Continuing on from nodejs/node#3962, this is an important metric for many users and we have no insight to it over time, at least nobody is tracking it as far as I'm aware.
Following up @mikeal's tweet, I'm here to say a initial hello to this WG. I'm sorry if I'm using the wrong channel. I'm a TC39 member, representing the jQuery Foundation (that's pretty recent), and a maintainer of test262.
We can have performance tests on test262. TC39 just created another test262 sibling repo for parser tests (see https://github.com/tc39/test262-parser-tests and tc39/test262#559) and I can support creating another one for performance/benchmark tests.
What we need is people with available time to maintain and feed this new project. Plus, we can merge or reuse the work from this WG, as you want, but I'm certain that a sort of questions will be asked and we can anticipate this here: can we have these tests available for any runtime or any different implementation? If that's not possible, can we have tests for node without a specific runtime (e.g. node-charka)?
Count on me to support anything on this process.
https://benchmarking.nodejs.org/
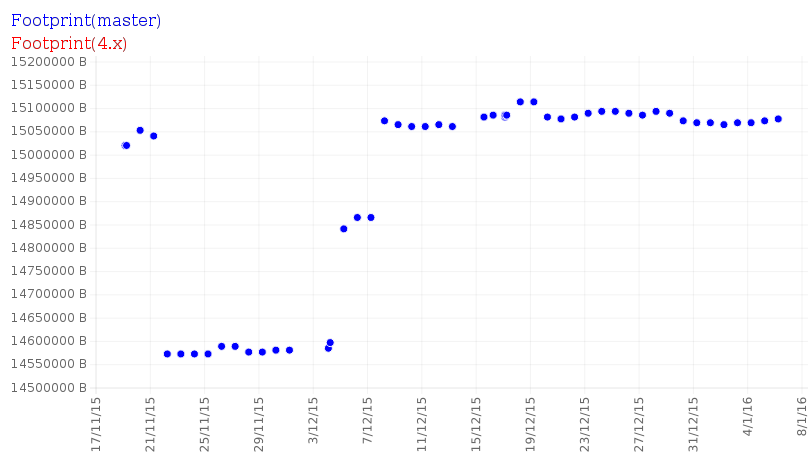
some are showing no ops/s on master with very low memory usage
@nodejs/benchmarking
@nodejs/benchmarking
Feb 25, 2PM EST
Hangout for participants: https://plus.google.com/hangouts/_/hoaevent/AP36tYdQJNUPbL5pEVZV1fJ4waG8ATJXVhGhykCEcrOrhmJUukc12g?hl=en&authuser=0
Youtube link for those who want to watch: http://www.youtube.com/watch?v=aGjxShr1Tw8
Event Page: https://plus.google.com/events/c1laq1b4o35nbeup16s2dkvg4us
Google doc for minutes: https://docs.google.com/document/d/1Vp63LgWJdzmwD5Svd16psmzGeyyqgywukZO4BI7CvTs/edit
I have gotten a softlayer account that I plan to use to bring a bare metal machine into the Node community CI for running the benchmarks.
I'm thinking of starting with a low end machine which is an
E3-1270 (4 cores, 3.4Ghz) with 4G ram and 500G disk running Ubuntu 14
I believe it should be enough to run acme air in a regression test configuration.
I'm creating this issue to see if people think that size machine is a good place to start or if we think we might need more ram/cores/disk to start.
If I don't hear otherwise I'll plan to look at bringing on the machine.
Draft agenda is:
I'll send out the invite to the participants so far. If you want to be added to the invite just let me know
Doodle poll: http://doodle.com/mwbrt5s7sq2ydstm
I'll include everybody on the core list. If you want to be added just let me know.
Hi! It's not clear at a glance whether higher or lower numbers are better for each chart. For example, for the Start + Stop Time chart, viewer has to understand y-axis is time, thus lower numbers are better for that chart.
The graphs at https://benchmarking.nodejs.org/ can be a little misleading if you don't notice that the Y-axis doesn't start at zero. So, for example, the graphs seem to exaggerate the start/stop time differential between 0.12 on the one hand and 4.x and 5.x on the other.
Any chance it's easy enough to make the graph Y-axis start with zero so that these comparisons are more proportional?
Hello,
One of the benchmarks we run contains what is in effect a number of microbenchmarks. We do a number of different actions with buffers, and I noticed in 4.4.0 we have seen a drop in some of these buffer tests.
One of these tests is looking at how long it takes to create a new buffer from an array of data.
var harness = require('./harness.js');

var ARRAY = [1, 2, 23829, 4, 5, 7, 12312321, 2131, 434832, 43792, 23421, 65345, 132210, 77777, 322131, 1, 2, 23829, 4, 5, 7, 12312321, 2131, 434832, 43792, 23421, 65345, 132210, 77777, 322131, 1, 2, 23829, 4, 5, 7, 12312321, 2131, 434832, 43792, 23421, 65345, 132210, 77777, 322131, 1, 2, 23829, 4, 5, 7, 12312321, 2131, 434832, 43792, 23421, 65345, 132210, 77777, 322131];
var ITERATIONS = 300000;
var result;

function test() {
    for(var i=0;i<ITERATIONS;i++) {
        result = new Buffer(ARRAY);
    }
}
harness.run_test(test);
Our harness repeats the test function a number of times, either until we get good consistency in scores, or until a max number of attempts. We then report a number of operations per second.
Comparing 4.3.2 and 4.4.0 we saw quite a drop in the ops/sec for this test. Looking at the changes between the builds, I saw that 4.4.0 had some changes to lib/buffer.js as per nodejs/node#4886 .
I rebuilt node 4.4.0 with the buffer.js from 4.3.2 and saw the performance recover:
4.4.0 with the buffer.js from 4.3.2:
sdk4.4.0_oldbuffer/bin/node new-buffer-from-array-test.js
total time: 5.093s -- iterations: 43 -- ops/sec: 8.44 -- average time: 0.12s -- variance: 2.19%
total time: 5.077s -- iterations: 43 -- ops/sec: 8.47 -- average time: 0.12s -- variance: 0.22%
total time: 5.076s -- iterations: 43 -- ops/sec: 8.47 -- average time: 0.12s -- variance: 0.32%
total time: 5.076s -- iterations: 43 -- ops/sec: 8.47 -- average time: 0.12s -- variance: 0.18%
4.4.0 unmodified
sdk4.40/bin/node new-buffer-from-array-test.js
total time: 5.003s -- iterations: 26 -- ops/sec: 5.2 -- average time: 0.19s -- variance: 4.42%
total time: 5.059s -- iterations: 26 -- ops/sec: 5.14 -- average time: 0.19s -- variance: 7.04%
total time: 5.149s -- iterations: 27 -- ops/sec: 5.24 -- average time: 0.19s -- variance: 0.24%
total time: 5.149s -- iterations: 27 -- ops/sec: 5.24 -- average time: 0.19s -- variance: 0.24%
Looking at the changes in buffer.js, they mainly seem to be changing var to either const or let.
I reverted these ones, and saw the performance improve:
4.4.0 with the const & let changes switched back to var
sdk4.4.0-testfix/bin/node new-buffer-from-array-test.js
total time: 5.062s -- iterations: 42 -- ops/sec: 8.3 -- average time: 0.12s -- variance: 2.11%
total time: 5.039s -- iterations: 42 -- ops/sec: 8.33 -- average time: 0.12s -- variance: 0.13%
total time: 5.045s -- iterations: 42 -- ops/sec: 8.33 -- average time: 0.12s -- variance: 1.09%
total time: 5.039s -- iterations: 42 -- ops/sec: 8.33 -- average time: 0.12s -- variance: 0.29%
Granted not quite to 100%, but much closer. Any ideas why this would cause a regression?
@nodejs/benchmarking
TBD new doogle poll http://doodle.com/poll/uiyhwxb4wp3ndpya
link for participants: https://plus.google.com/hangouts/_/hoaevent/AP36tYcoZvyPbXO1NWe9y5iZAMT7isERQk1rRHqKtSHMxoqm83FXTA?hl=en
For those who just want to watch: http://youtu.be/vdo8Z_T8LyU
Events page: https://plus.google.com/events/cp8coosclreo3s91vh2e9vj1vg0
Google doc for minutes: https://docs.google.com/document/d/1oUSDZM_EeODX4oX82Nagsaggwgf3QKEdNFUmhIo4qTE/edit?usp=sharing
Draft agenda is:
Review actions from last meeting

Review of discussion in issues opened
I'll send out the invite to the participants so far. If you want to be added to the invite just let me know
Doodle poll: http://doodle.com/poll/p52s8hfq4vbhp2ec
We have a few scattered reports of perf regressions in V8. It would be good to know about these before we close in on a major release so having an ongoing comparison with master and the release lines would be good.
@nodejs/benchmarking
Set for Friday Nov 18 at 4PM EST.
TBD Based on doodle poll: http://doodle.com/poll/pqiiexb6fnrtb769 (CLOSED)
link for participants: https://hangouts.google.com/hangouts/_/ytl/U28I1m3rIBX7vUZequdQb2ENxYTDuDO-InqdTSRmYR0=
For those who just want to watch: http://youtu.be/DNBx4YGFa2g
Google doc for minutes :https://docs.google.com/document/d/1PwmuSKGA5Hbnd_8NVbu2pRm3fz4gZYaWD29jzQZ7rlE/edit
@ofrobots suggested that we should include the release dates in the charts, that would help tell if there is a correlation to changes in the charts.
Not sure how easy this will be and wonder if it might get a bit crowded as releases are quite regular but this issue is to investigate that possiblity
Is there a VM image, container, or something similar that I can use to easily test local performance-related changes (for the acmeair benchmarks)?
We had a a recent case where one of our floating patches on v8 caused a performance issue. We believe this could have been caught with octane runs.
I'm thinking this means we should run octane nightly on master and publish the results.
@CurryKitten I know we run octane internally, would you be able to help putting together something that we can use to run in the community builds ?
This issue is for discussion on the existing micro-benchmarks, what we do in order to improve and get the running again.
One suggestion so far is that we make sure they print and display time for single iteration (how many us to complete) were the time is both the wall time as well as the cycles used.
We also discussed coming up with a list of additional micro benchmarks that we might want to add
joyent/node PR nodejs/node-v0.x-archive#5187 proposed some new benchmarks
for events that never landed. Not sure if it was ever reviewed. Going to close the PR there
as it's not going to be able to land but the benchmark should at least be reviewed and
determination made if it should be added to nodejs/node
Draft agenda is:
I'll send out the invite to the participants so far. If you want to be added to the invite just let me know
Doodle poll: http://doodle.com/kiwb6gt47ixbe2ny
I'll include everybody on the core list. If you want to be added just let me know.
Just noticed something strange. Even though the relative relationships between releases make sense in the charts, it looks to me like the x-axis with the value on a given day is off versus what is reported in the benchmark jobs.
May be an issue with the underlying chart generation program, will need to investigate to see what is going on.
Draft agenda is:
I'll send out the invite to the participants so far. If you want to be added to the invite just let me know
Updated doodle poll: http://doodle.com/poll/waab28wye22k92wi
Hallo!
I found some loop constructs in the source that I think are intended for better performance but couldn't find any context for them.
I'm trying to go around some benchmarks for vanilla JavaScript and I couldn't found any on the WG or anywhere else. So bear with me and please let me know if there are holes in the logic here.
Executed the sample snippet 200 times to plot. Watching the output for --print_opt_code, both functions measured are being picked up by Crankshaft and as far I can see they're not running into DCE.
From the graph it appears now that the for-loops are targeted with the same optimizations (why on other versions of V8 they wouldn't?!).
The snippet that I'm running is this one. It might not change from one algorithm to another but the improvements from Node v6 are remarkable. From all three plots seems like the decreasing for-loop gets more stable in the latest versions of V8.
I don't care about changing existing code but I think it would be useful to understand which would be the process for choosing one implementation over another.
Pending questions would be:
I have understood this repo's work. It mainly receive data from benchmark machine and store it to db and turn into charts. But I want to run the benchmark myself.I know this benchmark runs on jenkins,but I do not know how to deploy it and how to get the result like startup time.So if there is any information about this problem.Thanks!
@nodejs/benchmarking
Set for Sep 21 at 12 PM EST.
TBD Based on doodle poll: http://doodle.com/poll/t9dd7etthd3729gq
link for participants: https://hangouts.google.com/hangouts/_/ytl/a3FjUzGVC31cGbF6PkV78TahnSu0HYZcD19LjmNaDwM=?eid=100598160817214911030&hl=en_US&authuser=0
For those who just want to watch: http://youtu.be/CeuQi3S7Siw
Google doc for minutes: https://docs.google.com/document/d/1haDT8im1J-jV94y6qf3UmRZC4H0CVI68lzZjSOQSuMc/edit
From discussion in last benchmarking meeting
Next steps
The goal of this issue is to demonstrate the following:
Micro benchmarking is arguably more important from a library's standpoint than application / integration level benchmarking (I have heard macro benchmark as a term to). Micro benchmarking will quickly flag slowdowns in the system with little noise. This will help diagnosis the issue with little to no investigation needed.
* measured accurately: If a stable platform and multiple runs are used, one gets the most consistent measurements possible from javascript measuring javascript.
After reviewing the set of tests for nodejs/node/benchmark I see an awesome set of micro benchmarks. It really is a great place to start. It appears that the represented set of node specific libraries are here.
The primary reason why the tests are invalid forms of measurement can be found here(for the TL/DR; portion, read how option A and D work). Secondly, it would also reduce potential bugs / learning curve just by using a well known performance measuring library. Especially since the custom benchmark minimally suffers from more than all the same downfalls of benchmark.js.
The downfalls of benchmark.js is its javascript measuring javascript (one of the same downfalls of node/benchmark/common.js). The operating system can do who knows what during performance runs and cause incorrect measurements. Thus a more consistent platform (EC2 as an example) can make results more stable. Multiple runs (say 10), tossing out the high/low will help remove v8 mid-run optimizing, OS context switching, Wednesdays bad weather, etc. etc. issues.
Flamegraphs do not give an absolute number, they give relative numbers. Flamegraphs are amazing for understanding whats taking the most time within a library, not the performance of the library itself..
A side note: This would be a very interesting tool to use for performance charting overtime. One could use the % of samples as an indicator of growth of running time. If all tests were measured for a long enough period of time, a complete picture could be established and used build over build / day over day / some frequency. The only issue I see with this is that there is no out of box solution to this. Secondly writing this library would be a feat in of itself. So we will defer discussions / implementation of this for a later time or never.
require. It may be impossible for require new module code to be tested by benchmark.js due to the caching nature (it really depends if I can muck with the memory or not). It will be trivial to test requires cached result retrieval with benchmark js.buffer, path, urlparse, etc. I would follow suit of node/benchmark.nodejs/node@ae18bbe improves module loading (require) performance. We have 2 benchmarking running regularly that measure that. Initial runs indicate we should expect an increase for the "new" case.
This issue is a reminder to validate that in the graphs after the next run and to document why the change occurred in the graph.
see nodejs/node#906
We need to:
The next meeting will be planned for the week of June 15. The draft agenda is:
I'll send out the invite to the participants so far. If you want to be added to the invite just let me know
Doodle poll for those not on the core invite list:
Sorry for the late notice but meeting was being arranged before repo was available.
The kickoff meeting is scheduled for Wed May 27 2015 at 2:00 PM EST.
If you would like to attend you can add to you calender with this link:
and I believe this is the google hangouts link
The initial agenda will be:
Governance - review boilerplates and agree/disagree to use for this project
https://github.com/nodejs/benchmarking/blob/master/CONTRIBUTING-draft.md
https://github.com/nodejs/benchmarking/blob/master/GOVERNANCE-draft.md
Discuss/Confirm scope we want to tackle
Identify initial next steps, starting ideas are:
I've been experimenting on how to easily capture/publish benchmark data. This is the flow I've been thinking would work.
benchmark machine
benchmark data machine
I have experimental/minimal implementations of a, b and part of c so far.
(b) is implemented with this simple node application here: https://github.com/nodejs/benchmarking/blob/master/experimental/bridge.js which runs on the benchmark data machine. It accepts the connection from the benchmark machine and stores the result in a mysql database. It limits access to the internal ip of the benchmark machine, along with a tls connection and a fixed password. I plan to update this so that it users a certificate instead of the userid/password. At this point it accepts the following url parameters which mirror the database schema (see : for specifics https://github.com/nodejs/benchmarking/blob/master/experimental/dbmachine_setup.txt)
This shell script is used to post the result https://raw.githubusercontent.com/nodejs/benchmarking/master/experimental/postit.sh
This job (https://ci.nodejs.org/job/benchmark-footprint-experimental/) is an experimental version of (a) which runs the existing footprint micro-benchmark .../benchmark/report-startup-memory.js and publishes the result to the benchmark data machine.
(c) is partially implemented in that the files in https://github.com/nodejs/benchmarking/tree/master/experimental/chartGen can be used with phantomjs to generate the graph from the database. With the following being the current output:
Overall this approach would let us publish benchmark results with a small amount of code, results would be persistent as they are published as a png and it will be relatively easy to add new graphs.
Once we get agreement that this approach seems reasonable next steps include:
Background: A couple of weeks ago I was working on performance again for my js http parser, especially with the newer v8 versions that have been released (or are in the pipeline) since I first started working on the parser. Typically I would just use Chrome and jsperf.com, but I noticed that jsperf.com had been down for some time (with no public time table if/when it will be back up) and I needed an equally easy way to do benchmarking. So I took it upon myself to sit down and write something.
The repo for the tool can be found here. It allows you to run benchmarks (using a slightly modified version of benchmark.js to work better with node/io.js) against one or more versions of node.js/io.js (v0.8+) from the browser. The project still has a few items on the TODO, but it is in a mostly working state right now and I have been using it locally for the past few days. One thing that I did discover is that the "vanilla" mode, which uses the vm module to execute benchmarks, may not be as useful when comparing across different node.js/io.js versions because the numbers/trends do not always match that of results under non-"vanilla" mode. That's just something to be aware of if you're trying things out.
I'm not sure if this tool will be of much use for this WG or not, but it was suggested that I post here about it. If people are interested in it, feel free to send some PRs and create issues for bugs and feature requests. :-)
2 of the team members do not have Github usernames listed in the README.
Can they get added?
Tracking the dependency benchmark is also important. Especially the JavaScript engine performance. How node uses the JavaScript engine is or can be different than how it's designed for it's first class citizen: browser.
I had prepared this repo and using it for dirty benchmarking (sunspider and octane runs under the same single instance). As expected, results are a bit different than browser.
However, forcing JS engine benchmarks under trivial conditions is not enough to track the changes entirely. i.e. Call to native, native name resolution, wrap it back to JS land..
This issue is for us to discuss what use cases we need Node benchmark to cover.
Two initial ones are
but we'd like to get more specific and make sure we have one for each of the important ways that Node is used.
I've set up the scripts and tweaked so we don't get a hang or kill the jenkins agent but it seems to spend a lot of time waiting at this point:
Perf logs stored in /home/iojs/workspace/benchmark-footprint-experimental-0.12.x/benchmarking/experimental/benchmarks/results///20160225-164357

Cleaning up

## END acmeair Archiving Thu Feb 25 16:49:26 CST 2016
@gareth-ellis can you take a look ?
The net is that the jobs take ~11 mins versus the ~6 that we expected. For example: https://ci.nodejs.org/job/benchmark-footprint-experimental/120/
A declarative, efficient, and flexible JavaScript library for building user interfaces.
🖖 Vue.js is a progressive, incrementally-adoptable JavaScript framework for building UI on the web.
TypeScript is a superset of JavaScript that compiles to clean JavaScript output.
An Open Source Machine Learning Framework for Everyone
The Web framework for perfectionists with deadlines.
A PHP framework for web artisans
Bring data to life with SVG, Canvas and HTML. 📊📈🎉
JavaScript (JS) is a lightweight interpreted programming language with first-class functions.
Some thing interesting about web. New door for the world.
A server is a program made to process requests and deliver data to clients.
Machine learning is a way of modeling and interpreting data that allows a piece of software to respond intelligently.
Some thing interesting about visualization, use data art
Some thing interesting about game, make everyone happy.
We are working to build community through open source technology. NB: members must have two-factor auth.
Open source projects and samples from Microsoft.
Google ❤️ Open Source for everyone.
Alibaba Open Source for everyone
Data-Driven Documents codes.
China tencent open source team.


