GithubHelp home page GithubHelp logo

nvdnkpr / docker-grafana-graphite Goto Github PK

View Code? Open in Web Editor NEW

This project forked from kamon-io/docker-grafana-graphite

0.0 2.0 0.0 277 KB

Docker image with StatsD, Graphite, Grafana and a Kamon Dashboard

License: Apache License 2.0

docker-grafana-graphite's Introduction

StatsD + Graphite + Grafana + Kamon Dashboard

This image contains a sensible default configuration of StatsD, Graphite and Grafana, and comes bundled with a example dashboard that gives you the basic metrics currently collected by Kamon for both Actors and Traces. There are two ways for using this image:

Using the Docker Index

This image is published under Kamon's repository on the Docker Index and all you need as a prerequisite is having Docker installed on your machine. The container exposes the following ports:

  • 80: the Grafana web interface.
  • 8125: the StatsD port.
  • 8126: the StatsD administrative port.

To start a container with this image you just need to run the following command:

docker run -d -v /etc/localtime:/etc/localtime:ro -p 80:80 -p 8125:8125/udp -p 8126:8126 --name kamon-grafana-dashboard kamon/grafana_graphite

If you already have services running on your host that are using any of these ports, you may wish to map the container ports to whatever you want by changing left side number in the -p parameters. Find more details about mapping ports in the Docker documentation.

Building the image yourself

The Dockerfile and supporting configuration files are available in our Github repository. This comes specially handy if you want to change any of the StatsD, Graphite or Grafana settings, or simply if you want to know how tha image was built. The repo also has build and start scripts to make your workflow more pleasant.

Using the Dashboard

Once your container is running all you need to do is open your browser pointing to the host/port you just published and play with the dashboard at your wish. We hope that you have a lot of fun with this image and that it serves it's purpose of making your life easier. This should give you an idea of how the dashboard looks like when receiving data from one of our toy applications:

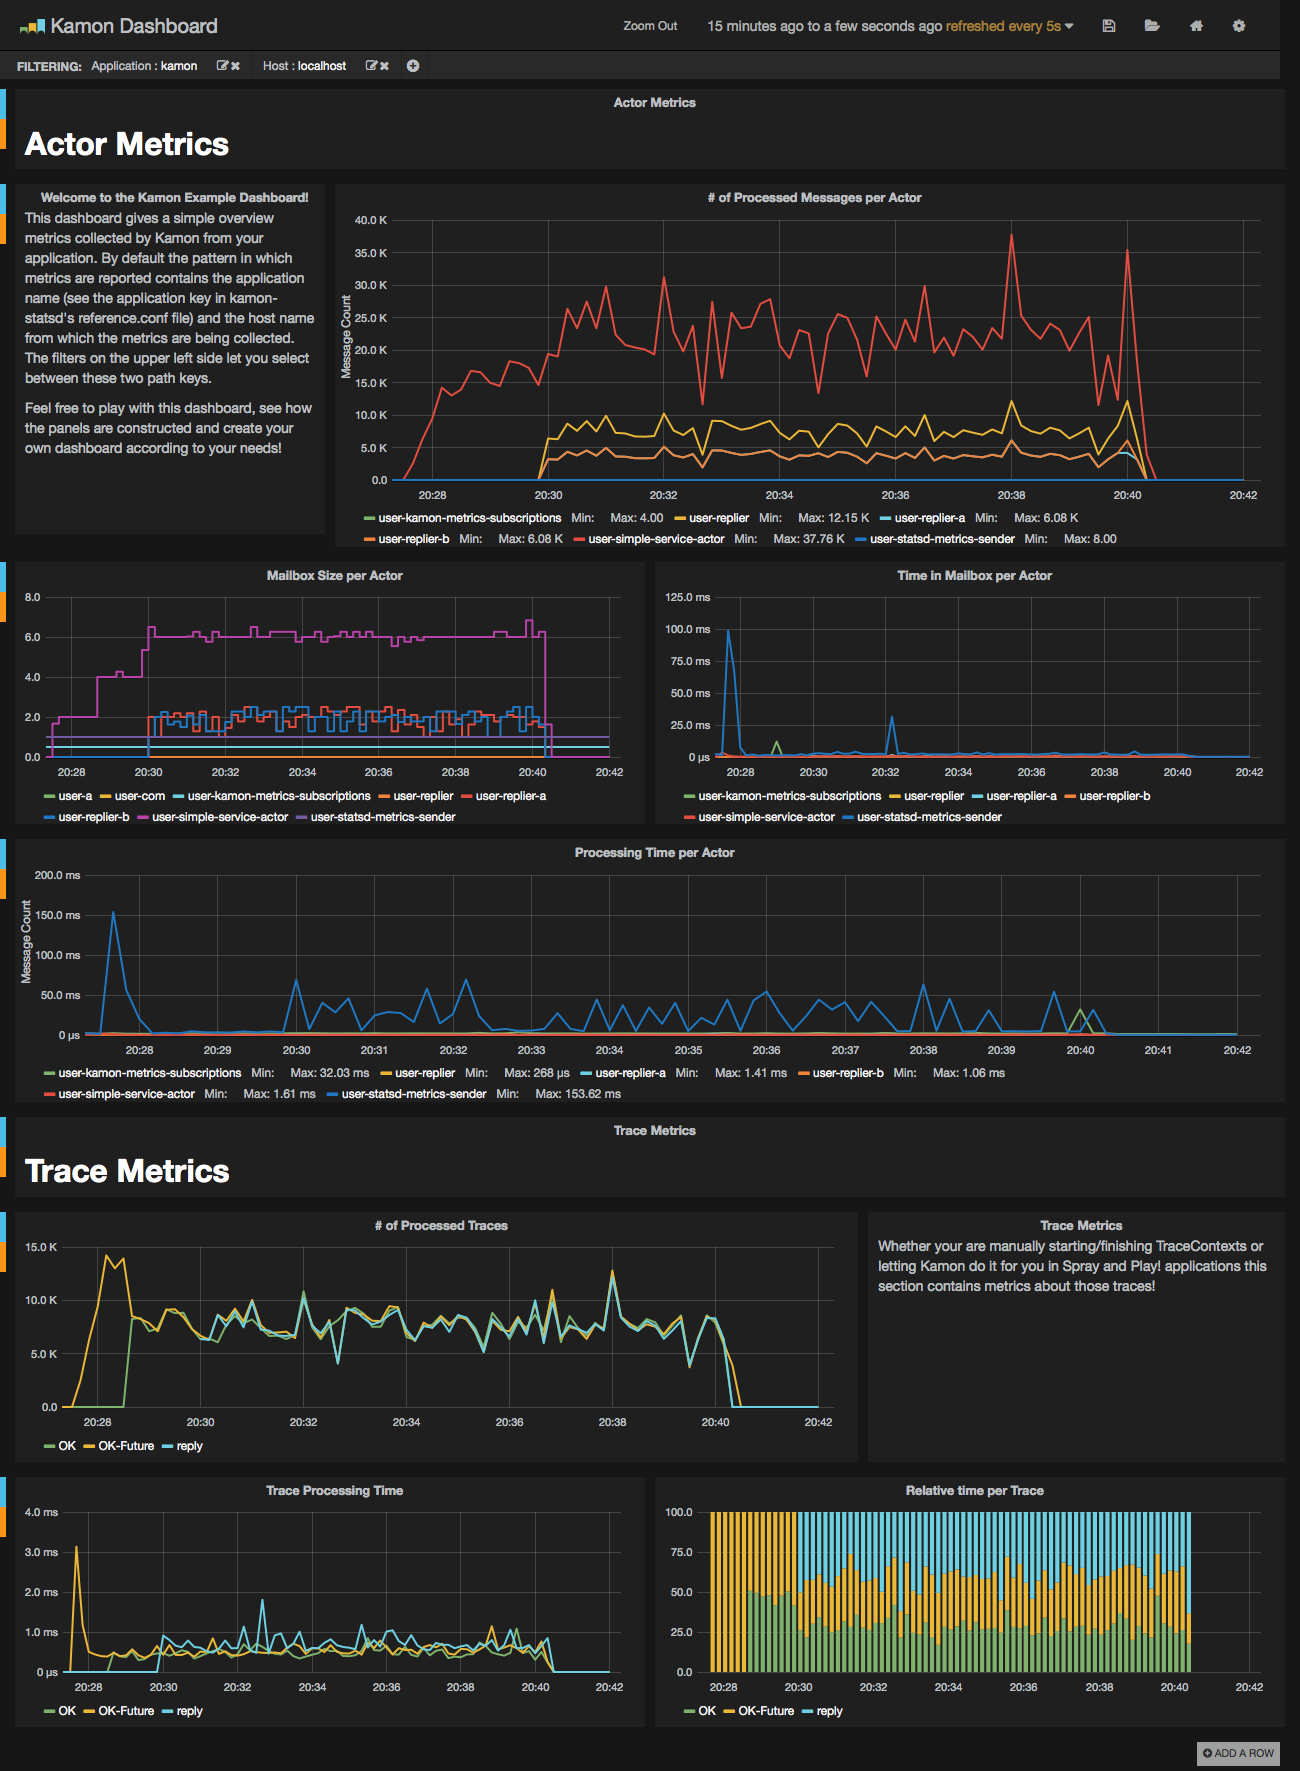
Kamon Dashboard

docker-grafana-graphite's People

Contributors

dpsoft avatar ivantopo avatar muuki88 avatar

Watchers

 avatar  avatar

Recommend Projects

  • React photo React

    A declarative, efficient, and flexible JavaScript library for building user interfaces.

  • Vue.js photo Vue.js

    ๐Ÿ–– Vue.js is a progressive, incrementally-adoptable JavaScript framework for building UI on the web.

  • Typescript photo Typescript

    TypeScript is a superset of JavaScript that compiles to clean JavaScript output.

  • TensorFlow photo TensorFlow

    An Open Source Machine Learning Framework for Everyone

  • Django photo Django

    The Web framework for perfectionists with deadlines.

  • D3 photo D3

    Bring data to life with SVG, Canvas and HTML. ๐Ÿ“Š๐Ÿ“ˆ๐ŸŽ‰

Recommend Topics

  • javascript

    JavaScript (JS) is a lightweight interpreted programming language with first-class functions.

  • web

    Some thing interesting about web. New door for the world.

  • server

    A server is a program made to process requests and deliver data to clients.

  • Machine learning

    Machine learning is a way of modeling and interpreting data that allows a piece of software to respond intelligently.

  • Game

    Some thing interesting about game, make everyone happy.

Recommend Org

  • Facebook photo Facebook

    We are working to build community through open source technology. NB: members must have two-factor auth.

  • Microsoft photo Microsoft

    Open source projects and samples from Microsoft.

  • Google photo Google

    Google โค๏ธ Open Source for everyone.

  • D3 photo D3

    Data-Driven Documents codes.