Python Notebook I made to analyse the genre trends in my liked songs playlist because I was too bored and wanted to see how my music taste has developed over time.
This notebook will load up a playlist with track metadata, and find out the top recurring genres across the song. It even finds out common patterns of genres (example: Indian Hip Hop and Japanese Hip Hop are collectively classified as Hip Hop), and uses that found information to analyse the trends of the playlist songs. If we assume that the playlist is sorted by time, the notebook would provide an accurate information of how the genre have existed, grown or deceased in your playlist.
The logic works in 6 simple steps:
- Create a master list of all the genres that span out in the playlist. This is done by looping over track metadata and appending the genre information in a global set.
- Find out common/recurring genres that fall in the same class. This is done by calculating a parameter I call as '
similarity factor'between 2 genre names. More information on this below. - Once these genres are sorted out and recurring genres are found, calculate the significance of each genre by matching it with each tracks metadata. This will help us count what genre occurs how many times by comparing against a threshold.
- Use this counted genre map to find the top genres.
- For generating the trend data of a specific genre, run a pass over the dataset and for each track and check if the track has the genre in it. This will give us a list which will be containing True/False.
- Finally, run a sliding window of size N over the trend data to count the significance of True and display it as a trend graph.
A very simple formula to check the similarity between 2 strings. For strings, String1 and String2, the formula is defined as follows :
Similarity Factor = (Count of Common Words between String1 and String2) / min(Count of Words in String1, Count of Words in String2)
Example:
String1 = "Indian Hip-Hop", (Word Count = 2)
String2 = "Japanese Old School Hip-Hop", (Word Count = 4)
Common Words = "Hip-Hop", therefore Common Word Count = 1
thus, Similarity Factor = 1 / min(2, 4) = 1/2 = 0.5
Firstly follow the steps mentioned here to get the pkl dataset for your own specific playlist.
Once done, open the notebook and modify the file path in the second cell to correspond to your pkl file. Now you can run the notebook, and analyse your own music taste.
Note: You might need to change the entries in PLOT_GENRES, according to how the data corresponding to your playlist is found to be.
I've added a sample of my very own liked songs playlist as a pkl file. Following is the graph that was generated using it:
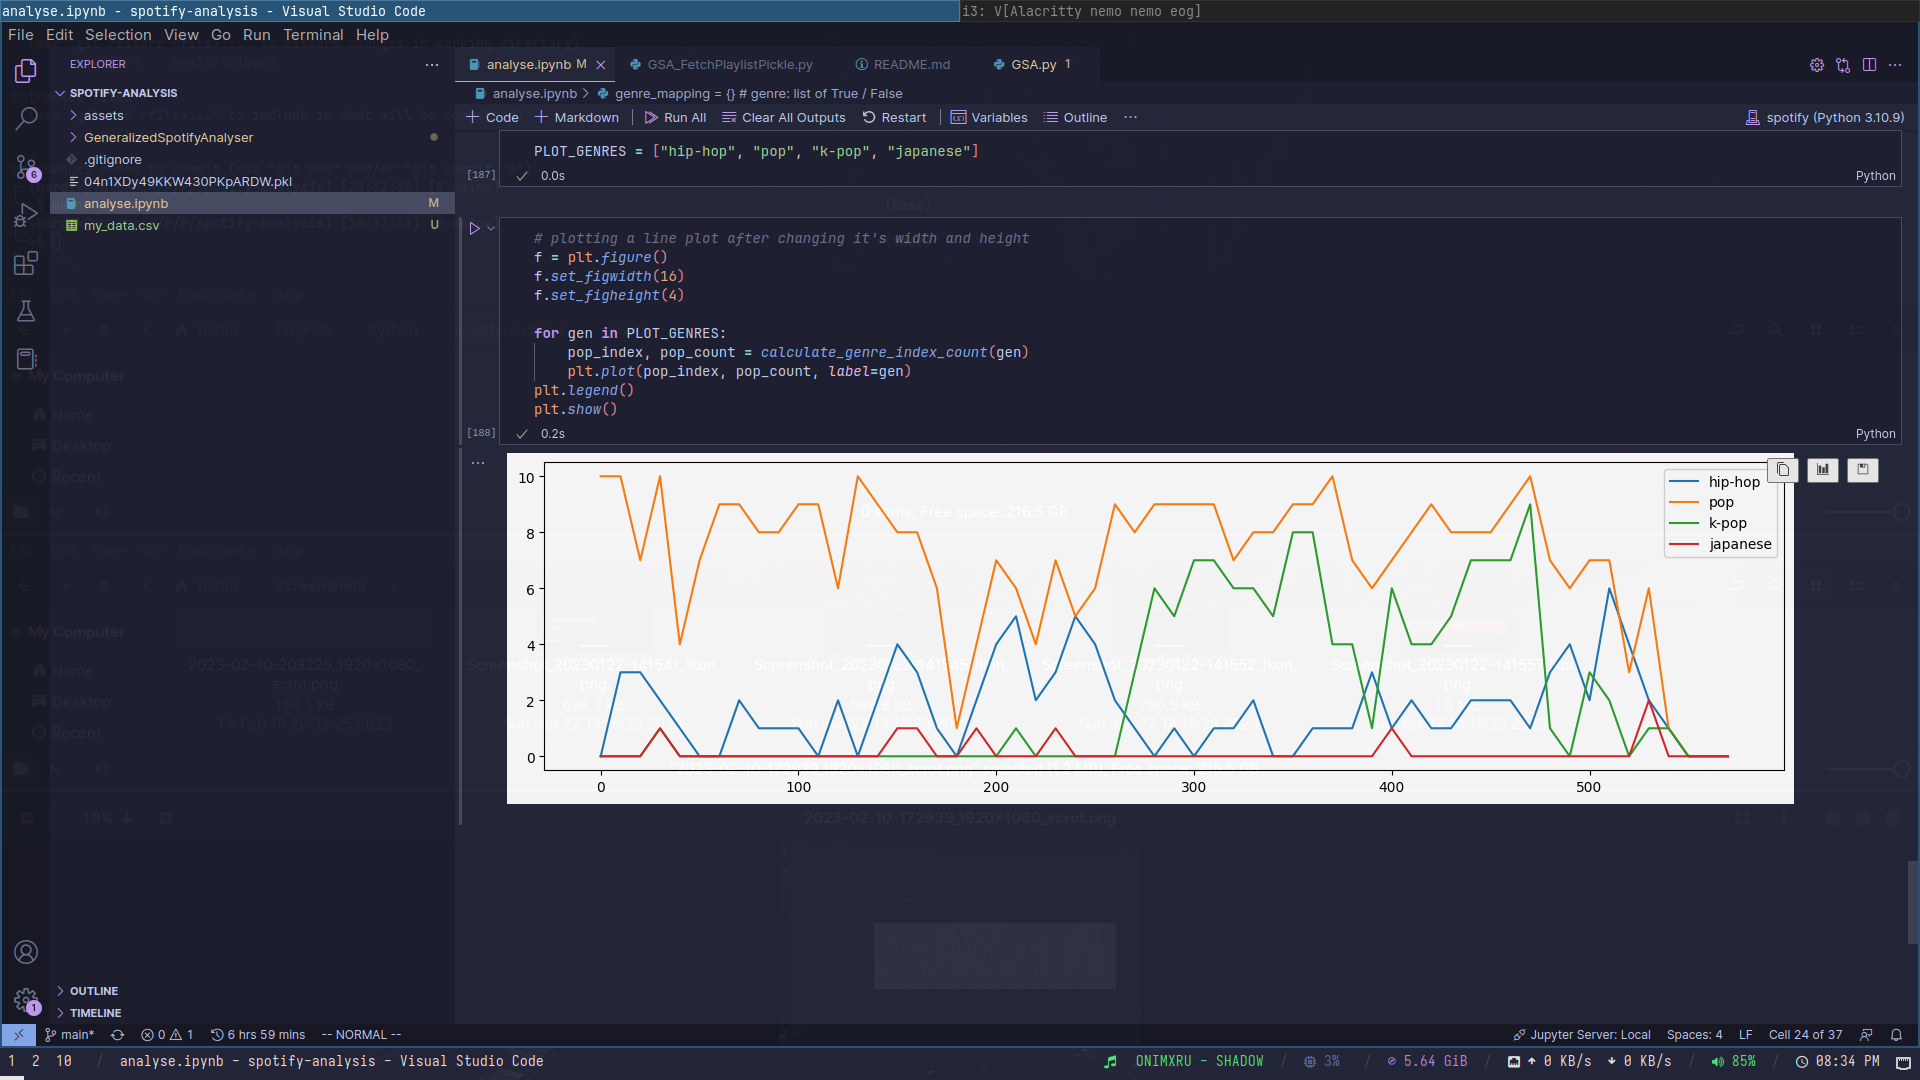
Inference: I've selected Hip Hop, Pop, K-Pop and Japanese as the 4 genres to display in the graph, and each line depicts how my music preference has been throughout. It perfectly describes how I've mostly been into songs in the Pop field, while also getting into K-Pop a while ago. While Hip Hop was my interest for a while it was quickly surpassed as soon as I got into K-Pop. Japanese genre has only had minor peaks because of my dwindling interest mostly.
- pandas
- matplotlib
- Hardik Srivastava (oddlyspaced)


