
Monitoring information for your tmux status line.
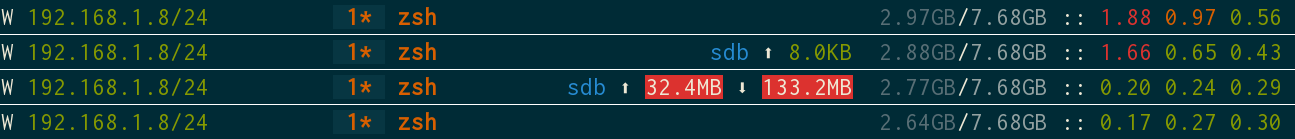
tmux-top allows you to see your:
- load
- memory usage
- network information
- I/O

This tool is written in Go. If you want to compile it, you have to setup your Go environment first.
- linux
go get github.com/TomasTomecek/tmux-top/cli
When the command succeeds, tmux-top is placed in directory ${GOPATH}/bin and named cli. You can rename it easily:
mv ${GOPATH}/bin/{cli,tmux-top}
git clone https://github.com/TomasTomecek/tmux-top.git
Once cloned, compile it using well-known process:
make
sudo make install
There are three subcommands at the moment:
tmux-top load— load of your workstationtmux-top mem— actual memry usage and total memorytmux-top net— network statistics: IP address, network interface and current bandwidthtmux-top io— I/O statistics: current reads and writes
This json contains default configuration. If you want to change something, just override the json and store it in ~/.tmux-top. You can change whatever you want. If the value is not found in your configuration file, it's loaded from default one.
Your configuration may look like this:
{
  "net": {
    "interfaces": {
      "enp0s25": {
        "alias": "E",
        "label_color_fg": "white",
        "label_color_bg": "default",
        "address_color_fg": "colour4",
        "address_color_bg": "default"
      },
      "enp5s0": {
        "alias": "E",
        "label_color_fg": "white",
        "label_color_bg": "default",
        "address_color_fg": "colour4",
        "address_color_bg": "default"
      },
      "wlp3s0": {
        "alias": "W",
        "label_color_fg": "white",
        "label_color_bg": "default",
        "address_color_fg": "green",
        "address_color_bg": "default"
      },
      "tun0": {
        "alias": "V",
        "label_color_fg": "white",
        "label_color_bg": "default",
        "address_color_fg": "colour3",
        "address_color_bg": "default"
      }
    }
  }
}
and tmux configuration:
set -g status-left "#(tmux-top n)"
set -g status-right "#(tmux-top m) #[fg=white]:: #(tmux-top l)"
Layout inspiration from this blog post.


