Caffeinated Graph Exploration for Neo4J
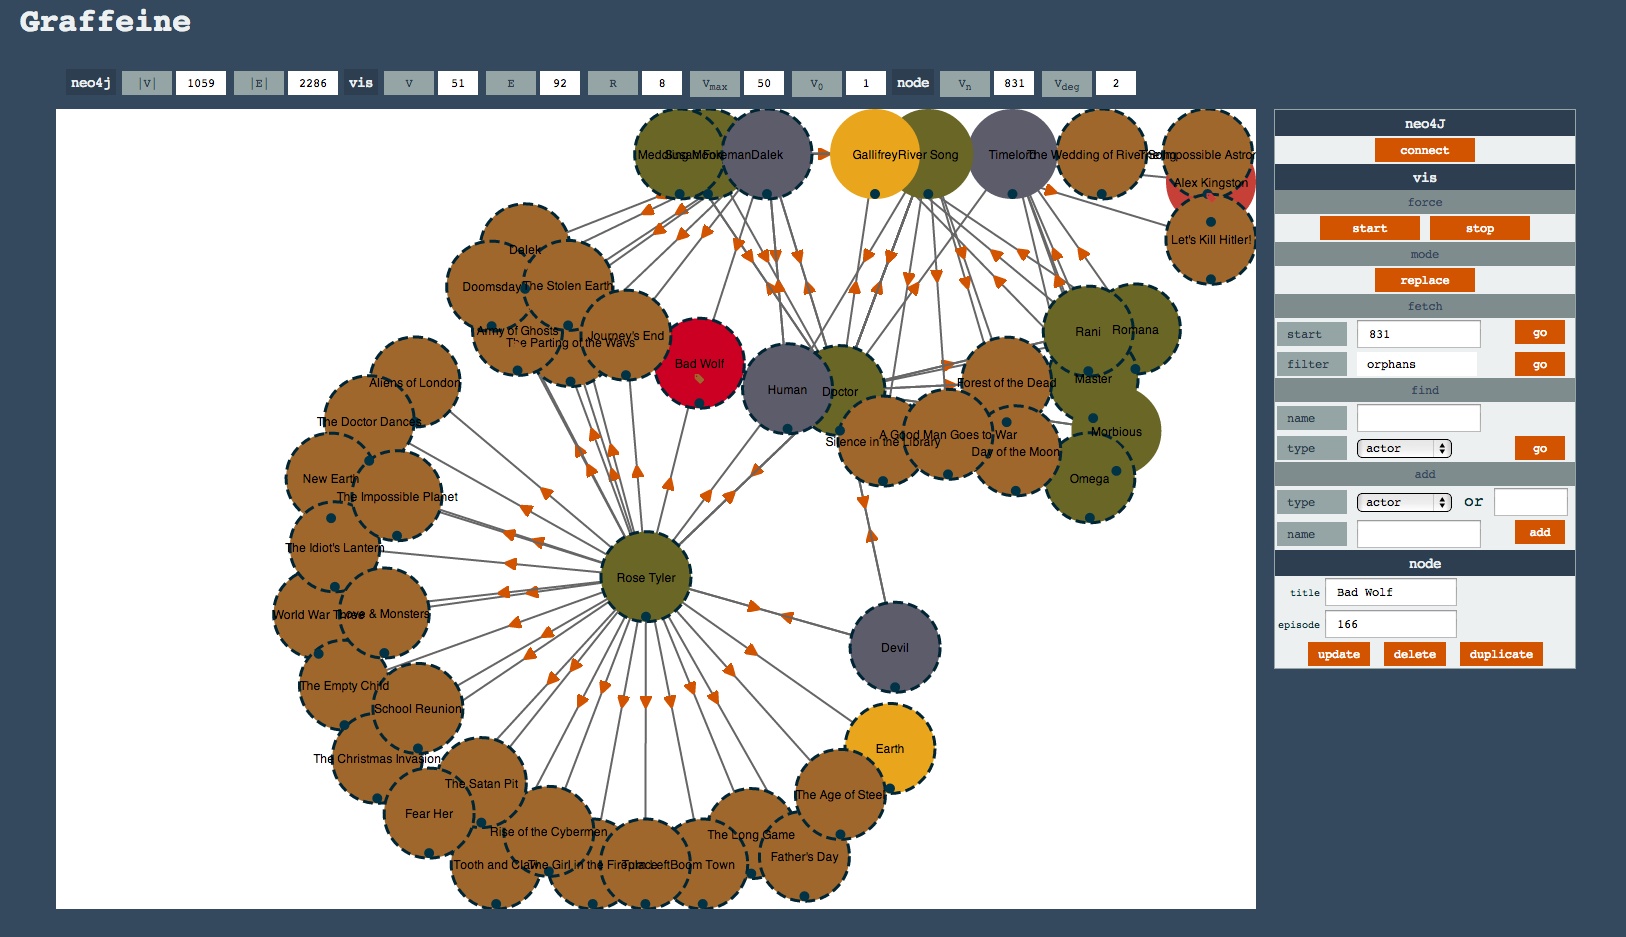
Graffeine is both a useful interactive demonstrator of graph capability and a simple visual administration interface for small graph databases.
Here it is with the, now canonical, Dr Who graph loaded up:
- node.js v0.10+
- neo4j v2.0, V2.1
- a modern browser that is happy with D3 v2, JQuery v1.9.1, JQuery UI, Underscore.JS and Font Awesome
from github:
git clone https://github.com/julianbrowne/graffeine

cd graffeine

node server
from npm:
npm install graffeine

npm start graffeine
point a browser at:
http://localhost:8004
Graph databases are amazing things.
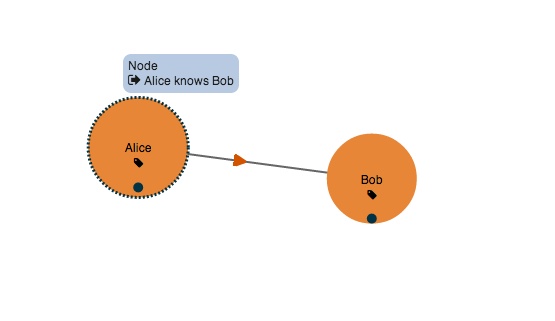
They should be the easiest of all persistence technologies to understand because graphs think like us - human concepts connect together (Alice knows Bob) and these connections have meaning (Alice knows Bob since Tuesday).
Could you get more human than that? And yet, for reasons that are hard to fathom, graphs have taken a back seat to all the other nosql products.
Graffeine was born because I wanted to show people how great graph thinking is and how close to the way we model things in our heads graphs like their data. Neo4J is the best graph tool I know of and despite there being plenty of complimentary tools out there all the ones I played with got in the way a bit when all I wanted to do was add a node (Alice), then another (Bob), and then feel all that graph loveliness coming through when I connected them and extended their relationships.

I felt there was a tool missing. One that promotes the explaining of graphs, exploring of graphs, and above all the seeing of graphs. Graffeine is an initial attempt at this. It won't ever be a suitable tool for hard core admin tasks on large production systems but it could work for small systems, spikes, demos, and generally helping spread the graph awesomeness.
Graffeine plugs into Neo4J and renders nodes and relationships as an interactive D3 SVG graph so you can add, edit, delete and connect nodes. It's not quite as easy as a whiteboard and a pen, but it's close, and all interactions are persisted in Neo4J.
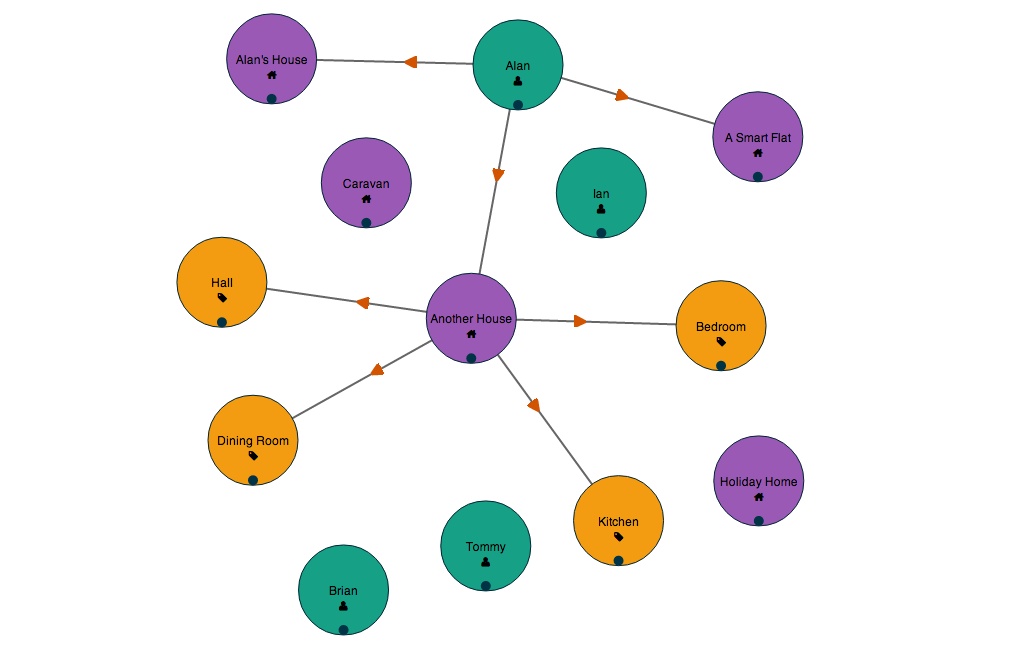
You can either make a graph from scratch or browse an existing one using search and paging. You can even "fold" your graph to bring different aspects of it together on the same screen.
Nodes can be added, updated, and removed. New relationships can be made using drag and drop and existing relationships broken.
It's by no means phpmyadmin for Neo4J, but one day it could be (maybe).
The schema-less nature of nodes and relationships in Neo4J makes them slightly problematic to model visually without some prior knowledge. Graffeine turns Neo4J nodes and relationships into GraffNodes which have name and type fields.
These fields are either from the actual name and type fields in the source graph, or inferred from other fields.
For example, Jim Webber's famous Dr Who graph does not use 'type' fields instead nodes are of the form:
{ character: "Rose Tyler" }
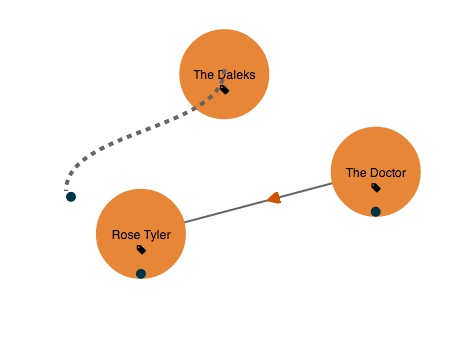
This is a common situation. In fact for many graph applications using types and rigid schemas can be a bit of an anti-pattern (or a smell that the model is trying to be too rdbms-like). In the case of Dr Who, Graffeine uses the field 'character' as the 'type' and the contents ("Rose Tyler") as the display name.
Node-to-GraffNode mappings are done in the graph.json file in {graffeine_home}/conf. In this case by adding character to the list of nameFields (used in priority order to determine names of nodes) and a also setting useNameAsType to true.
Types are not critical to Graffeine though, they're just useful for applying CSS to make the visualisation look nice. Similarly, names are only important because they're used to label the SVG circles in the UI.
The graph.json file has a few other visualisation settings to determine which fields do what. These should be self-explanatory.
- Check out the configuration.md file for more technical detail
- Check out the guide.md file for a basic user guide
- Check out the change log for recent updates
Yes please.
This started as a lunchtime play and grew fast. I've cleaned it up in phases but the code is still a bit untidy. Plus, there's always scope for new features.
Feel free to drop me a line via julianbrowne.com or via Github with bugs, questions, features requests, suggestions, offers of help etc.


