GithubHelp home page GithubHelp logo

plotly / dash-table Goto Github PK

View Code? Open in Web Editor NEW
420.0 52.0 74.0 29.04 MB

OBSOLETE: now part of https://github.com/plotly/dash

Home Page: https://dash.plotly.com

License: MIT License

Python 82.69% Julia 17.31%
plotly-dash plotly dash table data-visualization react python data-science

dash-table's Introduction

Notice

As of Dash 2, the development of Dash Table has been moved to the main Dash repo

This package exists for backward compatibility


Dash Table

An interactive DataTable for Dash.

👉 Documentation

Quickstart

pip install dash-table
import dash
import dash_table
import pandas as pd

df = pd.read_csv('https://raw.githubusercontent.com/plotly/datasets/master/solar.csv')

app = dash.Dash(__name__)

app.layout = dash_table.DataTable(
    id='table',
    columns=[{"name": i, "id": i} for i in df.columns],
    data=df.to_dict('records'),
)

if __name__ == '__main__':
    app.run_server(debug=True)

Interactive Dash DataTable

Background

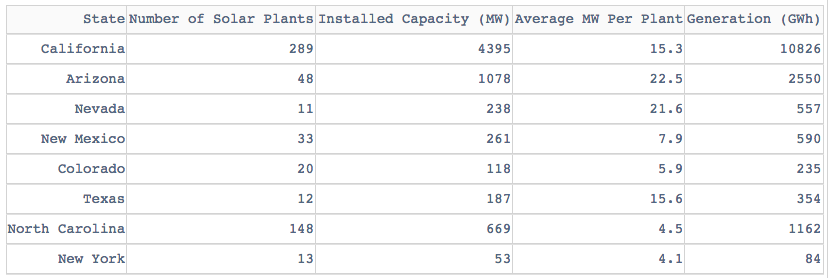
Dash DataTable is an interactive table component designed for viewing, editing, and exploring large datasets.

DataTable is rendered with standard, semantic HTML <table/> markup, which makes it accessible, responsive, and easy to style.

This component was written from scratch in React.js and Typescript specifically for the Dash community. Its API was designed to be ergonomic and its behavior is completely customizable through its properties.

DataTable was designed with a featureset that allows that Dash users to create complex, spreadsheet driven applications with no compromises. We're excited to continue to work with users and companies that invest in DataTable's future.

Please subscribe to dash-table#207 and the CHANGELOG.md to stay up-to-date with any breaking changes. Note: DataTable is currently supported in Chrome, Firefox, Safari, Edge (version 15+), and Internet Explorer 11.

Share your DataTable Dash apps on the community forum!

Contributing

See CONTRIBUTING.md

dash-table's People

Contributors

alexcjohnson avatar alinastarkov avatar ann-marie-ward avatar annmariew avatar bpostlethwaite avatar byronz avatar chriddyp avatar cldougl avatar dependabot[bot] avatar dmt0 avatar hammadtheone avatar harryturr avatar jackparmer avatar jbampton avatar jonmmease avatar josegonzalez avatar marc-andre-rivet avatar ngnpope avatar nicolaskruchten avatar renovate-bot avatar renovate[bot] avatar rothenhouser avatar rpkyle avatar t4rk1n avatar valentijnnieman avatar waralex avatar wbrgss avatar ycaokris avatar

Stargazers

 avatar  avatar  avatar  avatar  avatar  avatar  avatar  avatar  avatar  avatar  avatar  avatar  avatar  avatar  avatar  avatar  avatar  avatar  avatar  avatar  avatar  avatar  avatar  avatar  avatar  avatar  avatar  avatar  avatar  avatar  avatar  avatar  avatar  avatar  avatar  avatar  avatar  avatar  avatar  avatar  avatar  avatar  avatar  avatar  avatar  avatar  avatar  avatar  avatar  avatar  avatar  avatar  avatar  avatar  avatar  avatar  avatar  avatar  avatar  avatar  avatar  avatar  avatar  avatar  avatar  avatar  avatar  avatar  avatar  avatar  avatar  avatar  avatar  avatar  avatar  avatar  avatar  avatar  avatar  avatar  avatar  avatar  avatar  avatar  avatar  avatar  avatar  avatar  avatar  avatar  avatar  avatar  avatar  avatar  avatar  avatar  avatar  avatar  avatar  avatar

Watchers

 avatar  avatar  avatar  avatar  avatar  avatar  avatar  avatar  avatar  avatar  avatar  avatar  avatar  avatar  avatar  avatar  avatar  avatar  avatar  avatar  avatar  avatar  avatar  avatar  avatar  avatar  avatar  avatar  avatar  avatar  avatar  avatar  avatar  avatar  avatar  avatar  avatar  avatar  avatar  avatar  avatar  avatar  avatar  avatar  avatar  avatar  avatar  avatar  avatar  avatar  avatar  avatar

dash-table's Issues

nested header column remove/edit behaviour

Columns should only be simultaneously edited/deleted when header cells are merged. The current behaviour creates an unexpected result as only the single column buttons are activated:
headers

Selected Cells vs Focused Cell vs Active Cell

Spreadsheet programs like Google Sheets has a concept of focused cell, selected cells and active cell.

gifit_2018-05-21_085321

In this example I can select 4 cells but use Enter and Tab to navigate the focused cell within that selection. Pressing keyboard input targets the focused cell and sets that cell as active (receiving keyboard input into its Input).

dash-table currently only supports focused and selected.

TODO

  • Introduce column IDs
columns=[
    {'id': 'col-1', 'name': 'Column 1'},
    {'id': 'col-2', 'name': 'Column 2'},
    {'id': 'col-3', 'name': 'Column 3'},
]
  • Improve multi-line header API
    Currently, it's like:
merge_duplicate_headers: true,
columns=[
    {
        'name': 'Montréal',
        'rows': ['City', 'Canada', 'Montréal'],
    },

    {
        'name': 'New York City',
        'rows': ['City', 'America', 'New York City'],
    },
]

where name acts as an ID and rows acts as a list of column labels. Once we have proper column IDs, this should become something like

merge_duplicate_headers: true,
columns=[
    {
        'id': 'Montréal',
        'name': ['City', 'Canada', 'Montréal'],
    },

    {
        'id': 'New York City',
        'name': ['City', 'America', 'New York City'],
    },
]
  • Filtering and strict data types UI
    To start, we'll just copy the existing dash-table-experiments UI but introduce data types. See the work-in-progress filtering requirements for a client in this document: https://docs.google.com/document/d/1KVfUxVuZtJforuaua58-a2iWrePjKGWS02VCa3mgwQA/edit. These requirements will become more solid after I have a design review with the client at the end of the month
  • Event scope
    Currently, the keyboard handlers are too greedy.
    • They need to only be active when the table is "focused".
    • Should work with mulitple tables on the page
    • Should override the window scroll
  • styling api
    Flexible overrides. Suggested API, in rough order of precedence
style_cell={'color': 'blue'}  // styles the `<td/>` and/or the inner `<input/>
style_column={
    0: {'color': 'blue'}, // styles the cells on the 0th column
    5: {'color': 'blue'}, // styles the cells on the 5th column
}
style_row={
    2: {'color': 'blue'}, // styles the `<tr/>` on the second row
    3: {'color': 'blue'}, // styles the `<tr/>` on the 3rd row
}
style_even_row={'backgroundColor': 'lightgrey'}
style_odd_row={'backgroundColor': 'white'}
style_row_cells={
    2: {'color': 'blue'}, // styles all the cells in the second row
    3: {'color': 'blue'}, // styles the the cells in the 3rd row
}
style_header={'color': 'blue'}  // styles the cells in the header row
style_numeric={'fontFamily': 'monospace'} // styles the columns with 'type': 'numeric'
style_enum={'fontFamily': 'monospace'} // styles the columns with 'type': 'enum'
style_date={'fontFamily': 'monospace'} // styles the columns with 'type': 'date'
style_cells={
   3: {
        5: {'backgroundColor': 'blue'}, // styles the cell in position [3, 5] (row 3, column 5)
        8: {'backgroundColor': 'blue'}, // styles the cell in position [3, 8]
   },
   8: {
        5: {'backgroundColor': 'blue'}, // styles the cell in position [8, 5] (row 8, column 5)
        8: {'backgroundColor': 'blue'}, // styles the cell in position [8, 8]
   }
}
  • smarter shouldComponentUpdate
    I started doing this but then found myself in some buggy situations. felt like it was probably too early to start nailing this down
  • screenshot integration tests
    we could reuse the framework we use with the rest of the dash component libraries: percy + selenium
  • editable columns
    ultimately, we might need a context menu for the columns. for now, we can just make the header names an <input/> that gets rendered when you click /hover on the column name and sets the name onBlur (by calling setProps with the new columns object)
  • per-row checkbox/radio item controls
    similar to the existing dash-table-experiments component. will update a selected_rows property
  • editable=False should work

global copy doesn't work

users cannot copy via the browser (chrome edit->copy)
note: pasting from the browser does work.

Filtering feature

Filter UI with common filter operators (same as plotly.js filtering transform - may be able to reuse code?) and additional optional Server-side filtering callback pathway.

old inputs are still focused

not sure if this is a regression or not, I thought I had fixed this by calling blur() on keyboard presses but maybe not.
Notice the cursor on the USA cell
input focus

Discussion Needed: Behavior upon cell selection

When you select a cell populated with values and start typing, it appends new text to the left of the existing value:

cell-selection

I'm not sure what the best thing to do here is... Excel and google sheets have separate modes for cell highlight and cursor selection, so it's more intuitive what you're doing:

cell-selection-2

If we have one mode, I'm leaning towards defaulting to overwrite, though could see why that might not be preferred.

If we're keeping this default behavior, I think we should append text to the end of the value rather than the beginning, as we do now.

update readme

include dist build instructions and how to run sample table locally

Clean up / rename 'virtualization' props

Virtualization properties are not related to virtualization at all but to paging and are just artifact of a previous effort towards a virtualization prototype. Rename the props so they better represent what they do.

rows can get incorrectly offset

when zooming in on chrome or viewing in edge on the surface the delete and radio column of a given row can become offset from the content columns:

this is cosmetic but can result in issues with usability

Regression: double-clicking a cell focuses on the cell two columns to its left

This is a bug that was previously fixed AFAIK. Upon double-clicking a cell, the wrong column index is selected. Appears in both standalone and Dash apps. GIF below shows (expected) behaviour of single-click followed by (unexpected) behaviour of double clicks.

double click behaviour

Intuitively, I expect a double click event to behave the same way as pressing Enter — i.e. changing the relevant cell state to "Active".

ctrl+c in cell blocks navigation

  1. Navigate to a cell with either keyboard or mouse
  2. Ctrl+c
  3. Notice that you can't navigate out of the cell with the keyboard (need to click another cell)

Expected behavior:
Can navigate normally after ctrl+c

Note: This does not affect ctrl+v
Note: Fix should include e2e test for both ctrl+c/v

column_static_dropdown not producing dropdowns in selectable column

Might be user error on my part, here's the test app I'm trying this out with:

import dash
from dash.dependencies import Input, Output, State

import dash_html_components as html
import dash_table

import pandas as pd

collist = ['one', 'two', 'three', 'category']
categories = ['Great', 'Good', 'Fair', 'Poor']

df = pd.DataFrame({i: [1, 2, 3, 4] if i != 'category'
                   else ['Great', 'Good', 'Poor', 'Fair']
                   for idx, i in enumerate(collist)})
df = df[collist]
df = df.values


app = dash.Dash()
app.css.config.serve_locally = True
app.scripts.config.serve_locally = True

app.layout = html.Div([
    dash_table.Table(
        id='table',
        dataframe=df,
        columns=[{'id': idx, 'name': i} for idx, i in enumerate(collist)],
        editable=True,
        row_deletable=True,
        sorting=True,
        # Toggling this
        n_fixed_rows=1,
        column_static_dropdown=[{
            'id': 'bbb',
            'dropdown': [{'label': i, 'value': i} for i in categories]
        }],
        row_selectable='single'
    )
])


@app.callback(
    Output('table', 'dataframe'),
    [Input('table', 'dataframe_timestamp')],
    [State('table', 'dataframe')]
)
def table_it(df_ts, df):
    print('called it')
    return df


if __name__ == '__main__':
    app.run_server(debug=True)

Clean up column offset usage

offsets are pervasive in the code at the moment to compensate for the delete and selection columns if they exist.. this needs to be cleaned up!

Selection event callback

A way to interact with selection events - similar to how we expose selection events from the plotly.js Dash component.

table can't calc width

when setting
{'selector': '.dash-spreadsheet.freeze-left', 'rule': 'width: 100%;'} the table will extend to 100%
preferably it would only expand to show the amount of columns available.
Option to set static width is not useful when appending columns
screen shot 2018-09-18 at 10 40 12 pm

Paste from excel - cross browser reliablity

Currently, paste from excel into the table works well in firefox. However, in chrome, it looks like the clipboard data doesn't have any newlines in it and the paste event doesn't work for multiple rows.

We might need to rethink how we are doing pasting to solve this one.

Here's how it works (correctly) in firefox:
paste-firefox

Multi row copy/paste inserts '\r' on paste for the last selected column

Found while working on Issue #75.

Select at least two rows of cells and copy paste -- the inner html of the cell-value element contains pending '\r' that was inserted by our custom copy logic here:

    const value = R.slice(
        R.head(selectedRows) as any,
        R.last(selectedRows) as any + 1,
        dataframe
    ).map(row =>
        R.props(selectedCols, R.props(R.pluck('id', columns) as any, row) as any)
    ).map(row => R.values(row).join('\t')
    ).join('\r\n');

SheetClip provides a stringify function along with the parse function, we should use that instead of our custom logic.

click and double click behaviour to mimic excel

in order to have behaviour be consistent with excel:

  • on single click: remove current content and overwrite with new content
  • on double click: add cursor and append (currently prepends) to content

right now we have the reverse: single click prepends content and double click overwrites

Tab is still greedy

tabbing through a form on the page ends up tabbing the cells in the table, even if unfocussed

Recommend Projects

  • React photo React

    A declarative, efficient, and flexible JavaScript library for building user interfaces.

  • Vue.js photo Vue.js

    🖖 Vue.js is a progressive, incrementally-adoptable JavaScript framework for building UI on the web.

  • Typescript photo Typescript

    TypeScript is a superset of JavaScript that compiles to clean JavaScript output.

  • TensorFlow photo TensorFlow

    An Open Source Machine Learning Framework for Everyone

  • Django photo Django

    The Web framework for perfectionists with deadlines.

  • D3 photo D3

    Bring data to life with SVG, Canvas and HTML. 📊📈🎉

Recommend Topics

  • javascript

    JavaScript (JS) is a lightweight interpreted programming language with first-class functions.

  • web

    Some thing interesting about web. New door for the world.

  • server

    A server is a program made to process requests and deliver data to clients.

  • Machine learning

    Machine learning is a way of modeling and interpreting data that allows a piece of software to respond intelligently.

  • Game

    Some thing interesting about game, make everyone happy.

Recommend Org

  • Facebook photo Facebook

    We are working to build community through open source technology. NB: members must have two-factor auth.

  • Microsoft photo Microsoft

    Open source projects and samples from Microsoft.

  • Google photo Google

    Google ❤️ Open Source for everyone.

  • D3 photo D3

    Data-Driven Documents codes.