GithubHelp home page GithubHelp logo

pnkraemer / tueplots Goto Github PK

View Code? Open in Web Editor NEW
637.0 4.0 25.0 6.62 MB

Figure sizes, font sizes, fonts, and more configurations at minimal overhead. Fix your journal papers, conference proceedings, and other scientific publications.

Home Page: https://tueplots.readthedocs.io

License: MIT License

Python 100.00%
matplotlib scientific-visualization

tueplots's Introduction

TUEplots: Extend matplotlib for scientific publications

PyPi Version Docs GitHub stars gh-actions License Badge PyPI - Downloads

Why?

tueplots helps you to create scientific plots that can be used in papers, presentations, posters, or other publications. tueplots does not try to make your plots as beautiful as possible (who are we to judge your favourite color). Instead, it makes it effortless to avoid common issues like too-small figures, inappropriate fontsizes, or inconsistencies among figures. Because good-looking figures are important.

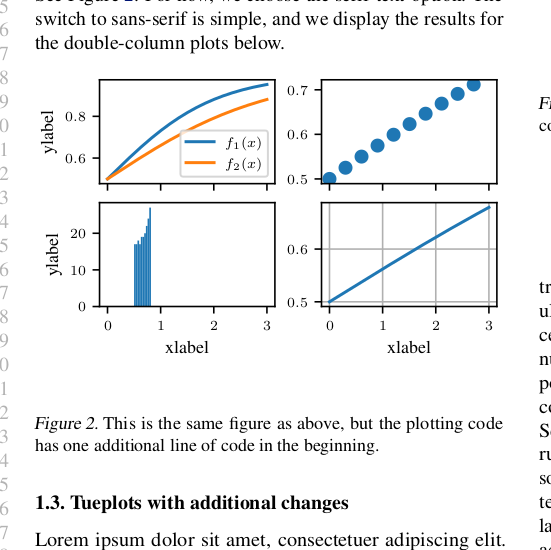
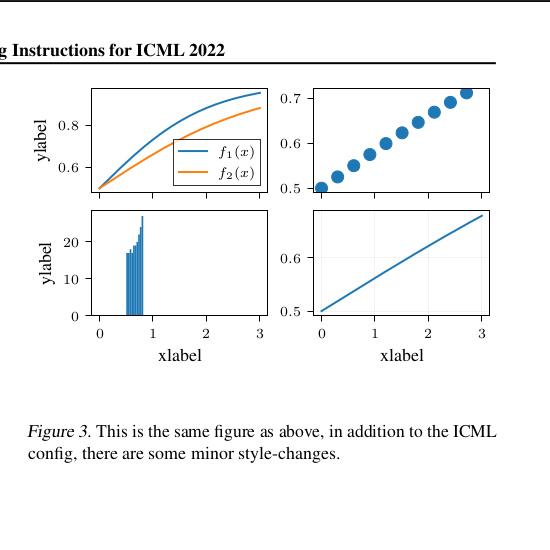
For example, consider the style tailored to the ICML2022 template. (Left: default matplotlib, middle: one line of tueplots-code, right: two lines of tueplots-code)

Principles

tueplots has no internal state: It only passes around dictionaries, whose key-value pairs match those that matplotlib uses. Instead of updating global state, it makes it easy for you to do it yourself! If you want to globally change settings, pass them to matplotlib.pyplot.rcParams.update(). If you only need them for specific contexts, pass them to matpltlib.pyplot.rc_context(). tueplots makes the change easy, so you can make the easy change. This should make tueplots naturally compatible with other matplotlib extensions. Usage examples are given below.

tueplots has no opinions: It does not tell you what your figures should look like in the end, but helps you to tailor your plots to your own needs. We like all the colors, frame-styles, markers, or linewidths. But we do think that figure sizes should match the text-width in your publication, and that the font-size in the plot should be readable, and similar to the rest of the paper/presentation/....

Getting started

Installing tueplots is explained here. Some usage examples are given at this url. A more specific tutorial, applying tueplots to figures intended for ICML 2022, is on this page. If something is not working as promised, please refer to the troubleshooting site. For more advanced tutorials, you may refer to the example notebooks.

Related packages

There are similar packages to tueplots (with different foci, respectively):

The matplotlib third-party plots contains a more comprehensive list. If you know of any others, please feel invited to open an issue/PR.

Miscellaneous

tueplotshas been started at the University of Tübingen (hence the name).

tueplots's People

Contributors

braun-steven avatar georg-wolflein avatar jkbjh avatar kianmeng avatar libbylbaker avatar marvinpfoertner avatar nathanaelbosch avatar not-a-feature avatar philipphennig avatar pitmonticone avatar pnkraemer avatar runame avatar tdsimao avatar timweiland avatar

Stargazers

 avatar  avatar  avatar  avatar  avatar  avatar  avatar  avatar  avatar  avatar  avatar  avatar  avatar  avatar  avatar  avatar  avatar  avatar  avatar  avatar  avatar  avatar  avatar  avatar  avatar  avatar  avatar  avatar  avatar  avatar  avatar  avatar  avatar  avatar  avatar  avatar  avatar  avatar  avatar  avatar  avatar  avatar  avatar  avatar  avatar  avatar  avatar  avatar  avatar  avatar  avatar  avatar  avatar  avatar  avatar  avatar  avatar  avatar  avatar  avatar  avatar  avatar  avatar  avatar  avatar  avatar  avatar  avatar  avatar  avatar  avatar  avatar  avatar  avatar  avatar  avatar  avatar  avatar  avatar  avatar  avatar  avatar  avatar  avatar  avatar  avatar  avatar  avatar  avatar  avatar  avatar  avatar  avatar  avatar  avatar  avatar  avatar  avatar  avatar  avatar

Watchers

 avatar  avatar  avatar  avatar

tueplots's Issues

ICLR 2024

If someone would like to add the styles for ICLR, that would be very much appreciated!

The numbers should be similar (if not identical) to the ones for the recent iclr ones.

Readme vs Documentation

At the moment, there is too much overlap between readme and documentation.

It would be much more useful, if the readme summarised the relevant pieces of the docs, and pointed to, for example, some "getting started" notebooks.

ICML 2023

I would happily review a PR including a contribution of the ICML 2023 files. The call for papers (including a style file) is out now: https://icml.cc/Conferences/2023/CallForPapers.

Most, if not all of the configurations should be the same as in the last year(s).

Documentation?

Do we want some (very simple) sphinx doc? Of course that is always interesting, but especially here, it could display the example notebooks nicely.

Usage of tex

The usetex flag in fonts.py is a little bit cumbersome at the moment:

  • when specific fonts do not exist in the specific matplotlib setup (e.g. Times), usetex=True would allow including them via \includepackage{times}. It is probably much easier to use them this way if usetex=True is set.
  • Since then the function behaves quite differently than the non-tex ones, they should be different functions (not one function with different inputs).

Colors

Feature request:
I would like to propose to store the colors in colors.py not as a tuple, but as an np.array.

Reasoning:
I'm planning to add the entire Uni Tü color palette. If they're stored as np.arrays, that makes it easier to interpolate between colors, in particular to create lighter versions of existing colors.

Package index

would be great to have it as pip install tueplots. This would make it so much easier to use.

continuous integration

Let's establish some very basic CI: linting, tests, and running the notebooks. Perhaps via tox?

ICML tutorial

With the ICML deadline approaching, it might be a good idea to have a minimal working example about tueplots-for-icml somewhere.

Presumably the readme? A notebook would also be neat, but a readme is easier to update in the future (i.e., after the conference). Deleting a file (a notebook) might be less fun.

_Inches_per_Point is inverted

The Variable _INCHES_PER_POINT = 1.0 * 72.27 in line 5 of figsizes.py is the wrong way round. It should either be renamed to _POINTS_PER_INCH or be set to 1.0 / 72.27.

Fontsize flexibility

Currently, most of the fontsizes are computed via

def _from_base(*, base):
    return {
        "font.size": base - 1,
        "axes.labelsize": base - 1,
        "legend.fontsize": base - 3,
        "xtick.labelsize": base - 3,
        "ytick.labelsize": base - 3,
        "axes.titlesize": base - 1,
    }

which has some fairly generic defaults. It would be very useful for me to be able to change the "1" and "3" values in my application.
For example, via

def _from_base(*, base, normalsize_offset=1, small_offset=3):
    return {
        "font.size": base - normalsize_offset,
        "axes.labelsize": base - normalsize_offset,
        "legend.fontsize": base - small_offset,
        "xtick.labelsize": base - small_offset,
        "ytick.labelsize": base - small_offset,
        "axes.titlesize": base - normalsize_offset,
    }

Collect "opinionated" modules in a dedicated subpackage

What

Tueplots centres around the content of figsizes.py, fonts.py, fontsizes.py, and bundles.py.

Other modules, namely axes.py, cycler.py, and markers.py, provide easy access to some plot-style changes that are otherwise a bit more involved to update. For example, axes.lines() changes all linewidths to a consistent base_width via rcParams. This functionality is helpful but somewhat opinionated.

Why

I would like to collect modules with such (potentially) opinionated content in a dedicated subpackage, e.g., tueplots.style.*, to distinguish them from the core content: figure sizes, font sizes, and so on.
This would simplify the API a little bit:

  • Make it easier to find the "important" content in the online docs
  • Add a new template by adding a function to all of the (then) top-level modules
  • Guarantee that the top-level content does not contain any opinionated configurations
  • We could split the tutorial notebooks into tutorials for the central content and tutorials for using the style (name undecided) subpackage

How

The current API looks like

import matplotlib.pyplot as plt
from tueplots import bundles, axes

plt.rcParams.update(bundles.icml2022())
plt.rcParams.update(axes.lines(base_width=0.75))

The new API would look like

import matplotlib.pyplot as plt 
from tueplots import bundles
from tueplots.style import axes

plt.rcParams.update(bundles.icml2022())
plt.rcParams.update(axes.lines(base_width=0.75))

To be decided

  • Is this change useful? (I think yes, but I would love to hear what people think)
  • What should the name of the subpackage be? (Currently, I think style is decent but there might be a more suitable one, maybe something like tueplots.opinion)
  • Do we use a deprecation policy or just go ahead with it?
  • Do we bump the patch version afterwards, or do we go to v0.1.0 (which should happen soon anyway in my opinion)

Everyone's feedback is welcome!

Resulting media size differs from declared one

          I'm afraid that this issue introduced a regression: resulting media size differs from declared one.
import matplotlib as mpl
import matplotlib.pyplot as plt

def save_fig(what: str, rc: dict):
    with mpl.rc_context(rc):
        fig, ax = plt.subplots(figsize=(3.25, 2.01), layout='constrained')
        ax.plot([i ** 2 for i in range(10)], '-..', label=r'$x^2$')
        ax.legend()
        ax.set_xlabel(r'$x$')
        ax.set_ylabel(r'$f(x)$')
        fig.savefig(f'{what}.pdf')
        fig.savefig(f'{what}.png')
        fig.savefig(f'{what}.svg')

save_fig('standard', {'savefig.bbox': 'standard', 'savefig.pad_inches': 0.015})
save_fig('tight', {'savefig.bbox': 'tight', 'savefig.pad_inches': 0.015})

Then we get images with different size in pixels while DPI is the same and equals to 100.

$ file *.png
standard.png: PNG image data, 325 x 200, 8-bit/color RGBA, non-interlaced
tight.png:    PNG image data, 319 x 195, 8-bit/color RGBA, non-interlaced

Bounding boxes of generated PDFs differs too.

$ echo {standard,tight}.pdf | xargs -n1 pdfinfo | grep -i 'page size'       
Page size:       234 x 144.72 pts
Page size:       230.16 x 140.88 pts

From my perspective matplotlib documentation is a little bit vague and unclear at this point but it seems that savefig.bbox/bbox_inches tweak somehow shape of bounding box of Artist's on Figure and use it instead of bounding box of original canvas.

UPD I don't know what figsize and dpi was in your sample abut sizes of generated PDFs follow.

$ echo {before,after}.pdf | xargs -n1 pdfinfo | grep -i 'page size'
Page size:       494.4 x 158.582 pts
Page size:       482.16 x 146.342 pts

Originally posted by @daskol in #101 (comment)

Dated implementations

the icml() or neurips() functions will be outdated once these conferences update their style files in future years. They should rather be dated as icml2021 or neurips2020. Same, I guess, for JMLR, which could be updated with the last time the style file was changed (200X?)

Updates to the beamer styles

Updates to the beamer styles:

  • The 0.8 in beamer should be replaced by rel_width, which should default to 0.8. (do we want to default rel_height=0.9 and rel_width=0.6?)
  • The font-weights of the beamer_moml() setting should be set to "light", akin to
plt.rcParams["font.weight"] = "light"
plt.rcParams["axes.labelweight"] = "light"
plt.rcParams["axes.titleweight"] = "light"
  • The figure size could use a reference. At the moment it seems a bit like black magic, where the figure sizes stem from. (Is it \textwidth? Is it \linewidth? is is the slide-size? That is not clear.)

Whitespace around figures when saving

To avoid unnecessary whitespace around a figure, we should look into setting "savefig.bbox": "tight", and maybe even play around with "savefig.pad_inches", to automatically crop whitespaces around figures.

This setting could be provided as part of the content in tueplots.figsizes, on the same level as constrained_layout.

While this issue has not been resolved yet: a user should consider saving figures as `plt.savefig(..., bbox="tight")``, which accomplishes the same task.

https://matplotlib.org/stable/api/_as_gen/matplotlib.pyplot.savefig.html

Tagging @philipphennig here, who brought this to my attention.

Contributions are welcome :)

Windows compatibility and doctests

It seems that tueplots is not windows compatible, likely because byexample is not.

This can be fixed rather easily. The steps could be:

  • Add windows-latest and macos-latest platforms to tests (to detect those issues)
  • Replace byexample runs with doctest (it can do the same, but should be compatible with all platforms)

Font installation tutorial

It would be great to have a few links regarding how to install the fonts required to make the font choices work (i.e. roboto, times, etc.). Perhaps in the readme? Maybe we also want to make transparent which fonts we make use of by creating a list of all "assumed" fonts?

The issue is that when the fonts dont exist, matplotlib often falls back to default font styles, which nullifies the font-height settings at times.

Neurips 2022 style

The style file instructions for Neurips 2022 have been published: https://neurips.cc/Conferences/2022/PaperInformation/StyleFiles.

It would be great to have them here. The only thing that might need changing is the figsize component: the figures must be 5.5 inches wide. I would guess the other parameters can be taken verbatim from neurips2021.

What do we need?

  • fontsizes.neurips2022 (I guess same as fontsizes.neurips2021, but should be double-checked against the style guide above)
  • figsizes.neurips2022 (base_width_in=5.5, rest should be identical to figsizes.neurips2022, but should be double-checked against the style guide above)
  • fonts.neurips2022 (I guesssame as fonts.neurips2021, but should be double-checked against the style guide above)
  • bundles.neurips2022 (similar to bundles.neurips2021, but pointing to all the 2022 versions)

plus tests for each bit.

Explain `overfull hbox` in troubleshooting section

Even though the figsizes delivered by tueplots match the figure sizes in style files exactly, sometimes, figures can be a few pt wider than what latex allows. This is not tueplots fault, but likely due to the optimisation that matplotlib carries out as part of constrained_layout=True or tight_layout=True.

The solution is usually to apply \includegraphics[width=\textwidth] in the latex code (to fix the final few millimeters -- the visual difference is zero), or to set the rel_width parameter (see #84) to rel_width=0.97.

Figure sizes

Currently, there are two suboptimalities in the figsize module:

  • switching "column={half,full}" affects 100% of the code, so why not make two different functions. this would also allow potentially setting ncols=2 as a default for full-width-figures
  • height-per-width-ratio = golden_ratio / 2 for full-width figures is an error

Bundle up the linting-requirements in tox with the pre-commit hook

Unify formatting, linting, and continuous integration.
There should only be one way of linting the code, not two (pre-commit and tox).

The likely solution would be to move all formatting and linting to the pre-commit hook and to call pre-commit run --all-files in the GitHub Action. It might also be time to move to Ruff instead of pylint+black+isort. Remember to update the developer guidelines.

Inconsistency in font-family defaults

The bundles use the default family="sans-serif", but the functions in fonts use the default family="serif". This is a bit unexpected, and should be resolved.

Which one to choose?

This is very subjective.

  • Pro sans-serif: I personally prefer this style, and it is arguably more readable at small sizes [example-ref1, example-ref2]
  • Pro serif: This is closer to the actual font used in each paper, which may be desirable.

Thoughts on this are welcome. Intuitively, I would choose the font that mirrors the paper font most closely as the default. Then, users like me can change their chosen font family anyway.

Pinging @ltatzel here, who notified me about this.

Figsizes for multiple rows

For plots with multiple rows, inferring the figure height by multiplying the default height with the number of rows, creates a rather skewed plot.

IMO, the solution should be that each subplot has the golden ratio as a height-width-ratio, and that the overall figure height is governed by the linewidth and this criterion.

AISTATS

It would be great to have the AISTATS 2022 sizes available.

Font seems off

Hi,

I tried using tueplots but encountered some weird bug, where my plot got from this:
im1
to this:
im2
just by removing defined figsize and adding:

from tueplots import bundles 

plt.rcParams.update(bundles.neurips2021(usetex=False, ncols=2, nrows=1))

Example code can be found here.

Is this a bug or am I missing something?

Teaser image in readme.md

Purely for PR purposes, I think there should be a teaster image right under the headline in readme.md.

For example, it could show two snapshots from the example ipynb's. A "before and after" shot side by side, with a big green arrow in between.

That would get the message across in under a second, I think.

mathit in beamer_moml is too fat

beamer_moml uses Roboto Condensed, which matches our style for beamer. But math variables (i.e. the \mathit font) is set in regular roboto.

MWE:

import numpy as np
from matplotlib import pyplot as plt
from tueplots import bundles

plt.rcParams.update({"figure.dpi": 150})
plt.rcParams.update(bundles.beamer_moml())

def f_b(x):
    return 2 ** (x / 2 - 2)


fig, ax = plt.subplots()

x = np.linspace(0, 12, num=120)
ax.plot(x, f_b(x), "-k")

ax.set_xlabel("$x$ (note that text is fine, mathit is not)")
ax.set_ylabel("$\log f(x)=6$")

I have no clue how to fix this. Anyone?

Font types

Often, conference and journal style files require Type-1 fonts. Per default, matplotlib uses type 3 fonts.

One thing that one could do would be to change the rcparams to pdf.fonttype=42,

plt.rcParams["pdf.fonttype"] = 42  # alternative would be 3

which generates type 42 fonts. It is not clear entirely whether this is sufficient for the type 1 rule. That would require checking, though.

Unified API

I think at the moment, this API is not perfectly unified. For example, the functions in figsize return tuples, almost all other function return dictionaries compatible with plt.rcParams.update or plt.rc_context, and there are the context functions that compute the context straightaway.

In my opinion, it would be way more intuitive if all functions (except for the RBG constants in color) would return outputs of the same types: dicts compatible with the plt.rcParam functions. This would entail the following changes

  • context.py becomes something like bundles.py: the bundling functionality (i.e., all icml configs in one) remain there, but they can now be called flexibly with either plt.rc_context or plt.rcParams.update
  • figsize.py would return a dictionary with a figure.figsize key, which can then be called straightforwardly.

Stylesheets

It might be very convenient to bundle together different settings to a matplotlib stylesheet.
I.e. with tueplots.context.icml2021(): plt..... This should not be very difficult to do in principle.

Recommend Projects

  • React photo React

    A declarative, efficient, and flexible JavaScript library for building user interfaces.

  • Vue.js photo Vue.js

    🖖 Vue.js is a progressive, incrementally-adoptable JavaScript framework for building UI on the web.

  • Typescript photo Typescript

    TypeScript is a superset of JavaScript that compiles to clean JavaScript output.

  • TensorFlow photo TensorFlow

    An Open Source Machine Learning Framework for Everyone

  • Django photo Django

    The Web framework for perfectionists with deadlines.

  • D3 photo D3

    Bring data to life with SVG, Canvas and HTML. 📊📈🎉

Recommend Topics

  • javascript

    JavaScript (JS) is a lightweight interpreted programming language with first-class functions.

  • web

    Some thing interesting about web. New door for the world.

  • server

    A server is a program made to process requests and deliver data to clients.

  • Machine learning

    Machine learning is a way of modeling and interpreting data that allows a piece of software to respond intelligently.

  • Game

    Some thing interesting about game, make everyone happy.

Recommend Org

  • Facebook photo Facebook

    We are working to build community through open source technology. NB: members must have two-factor auth.

  • Microsoft photo Microsoft

    Open source projects and samples from Microsoft.

  • Google photo Google

    Google ❤️ Open Source for everyone.

  • D3 photo D3

    Data-Driven Documents codes.