GithubHelp home page GithubHelp logo

prometheus-community / node-exporter-textfile-collector-scripts Goto Github PK

View Code? Open in Web Editor NEW
455.0 16.0 181.0 211 KB

Scripts for node-exporter's textfile collector

License: Apache License 2.0

Shell 32.19% Python 65.89% Awk 1.92%

node-exporter-textfile-collector-scripts's Introduction

Textfile Collector Example Scripts

These scripts are examples to be used with the Node Exporter textfile collector.

To use these scripts, we recommend using sponge to atomically write the output.

<collector_script> | sponge <output_file>

Sponge comes from moreutils

Caveat: sponge cannot write atomically if the path specified by the TMPDIR environment variable is not on the same filesystem as the target output file.

For more information see: https://github.com/prometheus/node_exporter#textfile-collector

node-exporter-textfile-collector-scripts's People

Contributors

0mp avatar 0x5a17ed avatar anarcat avatar avk999 avatar badrabubker avatar bdrung avatar candlerb avatar dswarbrick avatar hansmi avatar jcpunk avatar kennethso168 avatar kyrofa avatar lheckemann avatar lstrojny avatar manas-rust avatar mattbostock avatar mjtrangoni avatar mpursley avatar mulbc avatar ntavares avatar otwieracz avatar paol avatar pgier avatar prombot avatar richih avatar rtreffer avatar saj avatar superq avatar szeestraten avatar vetal4444 avatar

Stargazers

 avatar  avatar  avatar  avatar  avatar  avatar  avatar  avatar  avatar  avatar  avatar  avatar  avatar  avatar  avatar  avatar  avatar  avatar  avatar  avatar  avatar  avatar  avatar  avatar  avatar  avatar  avatar  avatar  avatar  avatar  avatar  avatar  avatar  avatar  avatar  avatar  avatar  avatar  avatar  avatar  avatar  avatar  avatar  avatar  avatar  avatar  avatar  avatar  avatar  avatar  avatar  avatar  avatar  avatar  avatar  avatar  avatar  avatar  avatar  avatar  avatar  avatar  avatar  avatar  avatar  avatar  avatar  avatar  avatar  avatar  avatar  avatar  avatar  avatar  avatar  avatar  avatar  avatar  avatar  avatar  avatar  avatar  avatar  avatar  avatar  avatar  avatar  avatar  avatar  avatar  avatar  avatar  avatar  avatar  avatar  avatar  avatar  avatar  avatar  avatar

Watchers

 avatar  avatar  avatar  avatar  avatar  avatar  avatar  avatar  avatar  avatar  avatar  avatar  avatar  avatar  avatar  avatar

node-exporter-textfile-collector-scripts's Issues

nvme_metrics.sh does not work at crontab

When launch nvme_metrics.sh manually from shell, the script successfully returns metrics. But when I launch it from crontab using bash script, the execution fails with the error nvme_metrics.sh: nvme is not installed. Aborting. which is not true at all - I have nvme-cli installed and working, as well as jq.

As a temporary fix I have commented this if block, but this should be properly fixed at upstream, however I cannot figure out why this is happening.

md_info_detail.sh: `CheckStatus` is not suitable as a label

Example:

node_md_info{md_device="md127", ... CheckStatus="75% complete", ...} 1

This value keeps changing, so we get 100 different timeseries as it goes from 0% to 100%. Although it's nice to be able to see this, I think it's label abuse.

Here's the raw mdadm --detail output:

# mdadm --detail /dev/md127
/dev/md127:
        Version : 1.2
  Creation Time : Wed Mar 15 14:32:11 2017
     Raid Level : raid10
     Array Size : 39069470720 (37259.55 GiB 40007.14 GB)
  Used Dev Size : 7813894144 (7451.91 GiB 8001.43 GB)
   Raid Devices : 10
  Total Devices : 11
    Persistence : Superblock is persistent

  Intent Bitmap : Internal

    Update Time : Mon Dec  9 18:13:48 2019
          State : clean, checking
 Active Devices : 10
Working Devices : 11
 Failed Devices : 0
  Spare Devices : 1

         Layout : near=2
     Chunk Size : 4096K

   Check Status : 75% complete

           Name : 127
           UUID : 00993e52:41fc1f0d:1f4457b0:a748d110
         Events : 618588

    Number   Major   Minor   RaidDevice State
       0       8       16        0      active sync set-A   /dev/sdb
       1       8       32        1      active sync set-B   /dev/sdc
       2       8       96        2      active sync set-A   /dev/sdg
       3       8      128        3      active sync set-B   /dev/sdi
       4       8      112        4      active sync set-A   /dev/sdh
       5       8       48        5      active sync set-B   /dev/sdd
       6       8        0        6      active sync set-A   /dev/sda
       7       8      144        7      active sync set-B   /dev/sdj
       8       8      160        8      active sync set-A   /dev/sdk
       9       8       64        9      active sync set-B   /dev/sde

      10       8       80        -      spare   /dev/sdf

smartmon scripts: quote in value

I fiddle with extracting data out of smartctl.

A disk gives me this:

smartmon_device_info{device="/dev/bus/0",disk="megaraid,5",model_family="Toshiba 3.5\" DT01ACA... Desktop HDD",device_model="TOSHIBA DT01ACA100",serial_number="75NHT0MNS",firmware_version="MS2OA7C0"} 1

The problem is in

model_family="Toshiba 3.5\" DT01ACA... Desktop HDD"

There's an escaped quote after "3.5", this leads to issues with the text exporter.
I browsed for various forks and versions of smartmon.sh and smartmon.py.

I currently seem to have the extraction fixed, but I seem to have some problematic data lines /metrics in prometheus.
Sorry for being a bit offtopic: how can I delete these smartmon-related time series without deleting too much? I need to clean this up before I can dig further and check if the scripts work now.

I don't know if having quotes in the SMART values is OK.

Add nolog to storcli.py text collector

Hello team.
Thank you for your work.

Just a little request.
When I use storcli.py, it generate a .log
This log file is still quite "big" (250Kb for each request).
Would it be possible to add this option directly in the script?

Regards,

freeipmi collector?

Hi,
I've been using ipmitool collector and I've found an issue where ipmitool sensor is slow to run locally (long timeouts for sensors not found) while ipmi-sensors (from freeipmi) works well. A new collector adapted from the existing ipmitool one is easy enough to do, would you be interested in such a collector? I'm happy to send a PR if that's the case

remove md_info, as node exporter supports it with v1.0.0-rc0

The issue for the md_adm statistics can be considered closed with node exporter v1.0.0-rc0. See:
prometheus/node_exporter#261

We got now the relevant metrics. e.g.:

node_md_disks{device="md0",state="active"} 2
node_md_disks{device="md0",state="failed"} 0
node_md_disks{device="md0",state="spare"} 0
# HELP node_md_disks_required Total number of disks of device.
# TYPE node_md_disks_required gauge
node_md_disks_required{device="md0"} 2
# HELP node_md_state Indicates the state of md-device.
# TYPE node_md_state gauge
node_md_state{device="md0",state="active"} 1
node_md_state{device="md0",state="inactive"} 0
node_md_state{device="md0",state="recovering"} 0
node_md_state{device="md0",state="resync"} 0

Therefore we can remove the textfile scripts: md_info.sh and md_info_detailled.sh.

Cheers!

nvme_metrics.sh invalidly quotes numbers.

jq on my system (debian sid) outputs numbers in a quoted format. eg:

# HELP nvme_host_write_commands_total SMART metric host_write_commands_total
# TYPE nvme_host_write_commands_total counter
nvme_host_write_commands_total{device="nvme0n1"} "432007"

This causes errors in the journal:

Dec 03 20:28:25 windy prometheus-node-exporter[771]: ts=2022-12-03T20:28:25.693Z caller=textfile.go:227 level=error collector=textfile msg="failed to collect textfile data" file=nvme.prom err="failed to parse textfile data from \"/var/lib/prometheus/node-exporter/nvme.prom\": text format parsing error in line 12: expected float as value, got \"\\\"1\\\"\""

Patching the script to call "jq -r" (raw output) resolves this problem.

This appears to be because nvme smart-log -o json for some reason quotes some of the numbers.

nvme_metrics: Typo in temperature metric

# ./nvme_metrics.sh | grep temp
# HELP nvme_temperature_celcius SMART metric temperature_celcius
# TYPE nvme_temperature_celcius gauge
nvme_temperature_celcius{device="nvme0"} 36

I think it should say:

nvme_temperature_celsius{device="nvme0"} 36

apt cache age computed incorrectly

in #182, @julian-klode said:

This has all a bit too fast for me to actually give any feedback (I'm afk all week except this morning more or less), but pkgcache.bin will also get updated whenever you install or upgrade or remove a package. srcpkgcache.bin is rebuilt whenever the sources.list changes, you ran clean, or the lists actually changed.

The best approach arguably is to check /var/lib/apt/periodic/update-success-stamp to see when the last succesful update was - but it is only set by the periodic script, so that only makes sense if the option is set (querying that with apt_pkg.init_config(); apt_pkg.config["APT::Periodic::Update-Package-Lists"] is nicest if you want to use python3-apt, but could do apt-config get too).

The best proxy otherwise is just the mtime of the /var/lib/apt/lists directory as we always rename() files from the partial directory into there, so it should always be updated as far as I understand directory modification times. The modification times of the files meanwhile are the modification times on the server and hence not meaningful.

This is a common issue that other tools also have and APT itself will need to deal with, I think we're going to end up adding actual stamp files to the apt code itself so you can always tell when the last update was and whether there were errors. Maybe just dump a (machine-readable) update.log in there, once we have machine-readable error codes.

Originally posted by @julian-klode in #182 (comment)

So we need to tweak our cache age metric to check the mtime on /var/lib/apt/lists until APT standardizes this. I don't feel like relying on APT::Periodic stuff is sufficiently flexible to cover most use cases (few people seem aware of that feature in the first place...)

Looking at mirror files is still interesting, I think. Reporting on out-of-date mirrors is a worthwhile, but separate goal, so let's not get bogged down on that here.

apt.sh: warning: regexp escape sequence `\"' is not a known regexp operator

When running under Ubuntu 20.04:

# /usr/local/libexec/node_exporter/apt.sh
awk: cmd. line:1: warning: regexp escape sequence `\"' is not a known regexp operator
# HELP apt_upgrades_pending Apt package pending updates by origin.
# TYPE apt_upgrades_pending gauge
apt_upgrades_pending{origin="",arch=""} 0
# HELP node_reboot_required Node reboot is required for software updates.
# TYPE node_reboot_required gauge
node_reboot_required 0

# shasum /usr/local/libexec/node_exporter/apt.sh
66e466f6e5526ca61d14cfbeed1593ebf0466dc0  /usr/local/libexec/node_exporter/apt.sh

# awk --version
GNU Awk 5.0.1, API: 2.0 (GNU MPFR 4.0.2, GNU MP 6.2.0)
Copyright (C) 1989, 1991-2019 Free Software Foundation.
...

apt.sh includes stats about packages that aren't even installed

I have an alert setup to notify me if any of my machines are failing to install security updates. Today I'm getting alerts for a machine that actually has no security updates available:

$ apt list --upgradable
Listing... Done
apport/focal-updates 2.20.11-0ubuntu27.14 all [upgradable from: 2.20.11-0ubuntu27.13]
cloud-init/focal-updates 20.4.1-0ubuntu1~20.04.1 all [upgradable from: 20.3-2-g371b392c-0ubuntu1~20.04.1]
libasound2-data/focal-updates 1.2.2-2.1ubuntu2.3 all [upgradable from: 1.2.2-2.1ubuntu2.2]
libasound2/focal-updates 1.2.2-2.1ubuntu2.3 amd64 [upgradable from: 1.2.2-2.1ubuntu2.2]
libdrm-common/focal-updates 2.4.102-1ubuntu1~20.04.1 all [upgradable from: 2.4.101-2]
libdrm2/focal-updates 2.4.102-1ubuntu1~20.04.1 amd64 [upgradable from: 2.4.101-2]
libnetplan0/focal-updates 0.101-0ubuntu3~20.04.2 amd64 [upgradable from: 0.100-0ubuntu4~20.04.3]
libnss-systemd/focal-updates 245.4-4ubuntu3.4 amd64 [upgradable from: 245.4-4ubuntu3.3]
libpam-systemd/focal-updates 245.4-4ubuntu3.4 amd64 [upgradable from: 245.4-4ubuntu3.3]
libsystemd0/focal-updates 245.4-4ubuntu3.4 amd64 [upgradable from: 245.4-4ubuntu3.3]
libudev1/focal-updates 245.4-4ubuntu3.4 amd64 [upgradable from: 245.4-4ubuntu3.3]
lsof/focal-updates 4.93.2+dfsg-1ubuntu0.20.04.1 amd64 [upgradable from: 4.93.2+dfsg-1]
netplan.io/focal-updates 0.101-0ubuntu3~20.04.2 amd64 [upgradable from: 0.100-0ubuntu4~20.04.3]
python3-apport/focal-updates 2.20.11-0ubuntu27.14 all [upgradable from: 2.20.11-0ubuntu27.13]
python3-problem-report/focal-updates 2.20.11-0ubuntu27.14 all [upgradable from: 2.20.11-0ubuntu27.13]
sosreport/focal-updates 4.0-1~ubuntu0.20.04.3 amd64 [upgradable from: 4.0-1~ubuntu0.20.04.2]
systemd-sysv/focal-updates 245.4-4ubuntu3.4 amd64 [upgradable from: 245.4-4ubuntu3.3]
systemd-timesyncd/focal-updates 245.4-4ubuntu3.4 amd64 [upgradable from: 245.4-4ubuntu3.3]
systemd/focal-updates 245.4-4ubuntu3.4 amd64 [upgradable from: 245.4-4ubuntu3.3]
udev/focal-updates 245.4-4ubuntu3.4 amd64 [upgradable from: 245.4-4ubuntu3.3]
update-notifier-common/focal-updates 3.192.30.4 all [upgradable from: 3.192.30]

I found this very confusing until I looked closer at apt.sh and realized it was using apt-get --just-print dist-upgrade to extract its information. I checked the output of that command, and there is indeed something coming from -security:

$ apt-get --just-print dist-upgrade
NOTE: This is only a simulation!
      apt-get needs root privileges for real execution.
      Keep also in mind that locking is deactivated,
      so don't depend on the relevance to the real current situation!
Reading package lists... Done
Building dependency tree       
Reading state information... Done
Calculating upgrade... Done
The following package was automatically installed and is no longer required:
  libfreetype6
Use 'apt autoremove' to remove it.
The following NEW packages will be installed:
  alsa-utils libatopology2 libfftw3-single3 libgomp1 libpciaccess0 libsamplerate0 python3-xkit ubuntu-drivers-common
The following packages will be upgraded:
  apport cloud-init libasound2 libasound2-data libdrm-common libdrm2 libnetplan0 libnss-systemd libpam-systemd libsystemd0 libudev1 lsof
  netplan.io python3-apport python3-problem-report sosreport systemd systemd-sysv systemd-timesyncd udev update-notifier-common
21 upgraded, 8 newly installed, 0 to remove and 0 not upgraded.
<snip>
Inst libgomp1 (10.2.0-5ubuntu1~20.04 Ubuntu:20.04/focal-updates, Ubuntu:20.04/focal-security [amd64])
<snip>
Conf libgomp1 (10.2.0-5ubuntu1~20.04 Ubuntu:20.04/focal-updates, Ubuntu:20.04/focal-security [amd64])
<snip>

However, take a closer look at that output:

The following NEW packages will be installed:
alsa-utils libatopology2 libfftw3-single3 libgomp1 libpciaccess0 libsamplerate0 python3-xkit ubuntu-drivers-common

Which means this isn't actually a security update at all-- libgomp1 isn't even installed. It's a new dependency added by something that isn't a security update, and thus will not be installed (because my production instances only install security updates automatically).

This makes me think that apt-get --just-print dist-upgrade isn't the right tool for the job. Thoughts?

Is it possible to run apt_info.py inside a container?

I'm running my node exporter via Kube Prometheus Stack directly inside Kubernetes. Including all other monitoring related stuff.

It would be nice if I could also run apt_info.py directly inside my cluster. Is it possible? Would it be enough to mount some host directories like /var/cache/apt/archives/ and /var/lib/apt/?

smartmon.sh and parsing of LUN IDs

Looking at the code in smartmon.sh, here:

  while read -r line; do
    info_type="$(echo "${line}" | cut -f1 -d: | tr ' ' '_')"
    case "${info_type}" in
    โ€ฆ
    Logical_Unit_id) lun_id="${info_value}" ;;

However, on all systems I have access to, the actual info contains LU WWN Device ID, and I suppose smartctl made an output change since this code was written.

The fix is rather trivial, but since I don't know if there are still old - or many just different - smartctl versions are there, needs to handle both.

Can you please link to a tutorial/guide on how I'm actually supposed to implement these?

I'm having issues transitioning from smartmon.sh to smartmon.py and would appreciate some guidance.

I have copied smartmon.py into /usr/local/bin and made it an executable file. I have installed the prometheus python client from here: https://github.com/prometheus/client_python. I have added the --collector.textfile.directory=/var/state/prometheus flag to my node exporter and I was previously successfully scraping metrics using the smartmon.sh program but once I switched the smartmon.py I can't get my service file to work correct.

When I was using smartmon.sh, I was running this service file successfully:

[Unit]
Description=Export smartctl metrics to Prometheus Node Exporter
[Service]
Nice=-10
ExecStart=/bin/sh -c 'exec /usr/local/bin/smartmon.py > /var/state/prometheus/smartmon.prom'

# Write nothing except the output file
ProtectSystem=strict
ReadWritePaths=/var/state/prometheus
# Shell needs a temp directory
PrivateTmp=true
ProtectHome=tmpfs

[Install]
WantedBy=multi-user.target

I've tried two other iterations shown below, but ultimately the python script runs one time and then shuts off. What am I doing wrong?

[Unit]
Description=Export smartctl metrics to Prometheus Node Exporter
[Service]
Nice=-10
#ExecStart=/bin/sh -c 'exec /usr/local/bin/smartmon.py > /var/state/prometheus/smartmon.prom'
#ExecStart=/usr/local/bin/smartmon.py
ExecStart=/bin/sh -c '/usr/local/bin/smartmon.py | sponge /var/state/prometheus/smartmon.prom'

[the rest is the same as the above service file]

Here is also my node_exporter service file:

  GNU nano 5.4                          /etc/systemd/system/node_exporter.service                                   
[Unit]
Description=Node Exporter
After=network.target

[Service]
User=node_exporter
Group=node_exporter
Type=simple
ExecStart=/usr/local/bin/node_exporter --collector.textfile.directory=/var/state/prometheus

[Install]
WantedBy=multi-user.target

Thank you for the help!

nvme_metrics breaks on systems with more than 10 NVME drives

disk="$(echo "${device}" | cut -c6-10)"

The line that parses disk name will truncate when it reaches 10 (e.g. /dev/nvme10). This will cause the output to contain duplicate entries with different values.

In my use case, node_exporter will fill my logs with error gathering metrics... was collected before with the same name and label values and degrade the scrapes as a result.

apt.sh regex --- can output duplicate metrics

Using the latest apt.sh script in node exporter. specific version

Node Exporter Logs:
level=error msg="error gathering metrics: [from Gatherer #2] collected metric \"apt_upgrades_pending\" { label:<name:\"arch\" value:\"main\" > label:<name:\"origin\" value:\"*****The\" > gauge:<value:30 > } was collected before with the same name and label values\n" source="log.go:172"

Duplicate metrics in the resulting apt text log:
apt_upgrades_pending{origin="*****The",arch="main"} 2 apt_upgrades_pending{origin="*****The",arch="main"} 30

The output of apt-get --just-print dist-upgrade shows the issue for the php ppa (ondrej-ubuntu-php-bionic)
(truncated)

Inst php7.4-json [7.4.3-4+ubuntu18.04.1+deb.sury.org+1] (7.4.4-1+ubuntu18.04.1+deb.sury.org+1 ***** The main PPA for supported PHP versions with many PECL extensions *****:18.04/bionic [amd64]) []
Inst php7.4-opcache [7.4.3-4+ubuntu18.04.1+deb.sury.org+1] (7.4.4-1+ubuntu18.04.1+deb.sury.org+1 ***** The main PPA for supported PHP versions with many PECL extensions *****:18.04/bionic [amd64]) []
Inst libapache2-mod-php7.4 [7.4.3-4+ubuntu18.04.1+deb.sury.org+1] (7.4.4-1+ubuntu18.04.1+deb.sury.org+1 ***** The main PPA for supported PHP versions with many PECL extensions *****:18.04/bionic [amd64]) []
Inst php7.4-xml [7.4.3-4+ubuntu18.04.1+deb.sury.org+1] (7.4.4-1+ubuntu18.04.1+deb.sury.org+1 ***** The main PPA for supported PHP versions with many PECL extensions *****:18.04/bionic [amd64]) []
Inst php7.4-readline [7.4.3-4+ubuntu18.04.1+deb.sury.org+1] (7.4.4-1+ubuntu18.04.1+deb.sury.org+1 ***** The main PPA for supported PHP versions with many PECL extensions *****:18.04/bionic [amd64]) []
Inst php7.4-mbstring [7.4.3-4+ubuntu18.04.1+deb.sury.org+1] (7.4.4-1+ubuntu18.04.1+deb.sury.org+1 ***** The main PPA for supported PHP versions with many PECL extensions *****:18.04/bionic [amd64]) []
Inst php7.4-mysql [7.4.3-4+ubuntu18.04.1+deb.sury.org+1] (7.4.4-1+ubuntu18.04.1+deb.sury.org+1 ***** The main PPA for supported PHP versions with many PECL extensions *****:18.04/bionic [amd64]) []
Inst php7.4-dev [7.4.3-4+ubuntu18.04.1+deb.sury.org+1] (7.4.4-1+ubuntu18.04.1+deb.sury.org+1 ***** The main PPA for supported PHP versions with many PECL extensions *****:18.04/bionic [amd64]) []
Inst php7.4-gd [7.4.3-4+ubuntu18.04.1+deb.sury.org+1] (7.4.4-1+ubuntu18.04.1+deb.sury.org+1 ***** The main PPA for supported PHP versions with many PECL extensions *****:18.04/bionic [amd64]) []
Inst php7.4-ldap [7.4.3-4+ubuntu18.04.1+deb.sury.org+1] (7.4.4-1+ubuntu18.04.1+deb.sury.org+1 ***** The main PPA for supported PHP versions with many PECL extensions *****:18.04/bionic [amd64]) []
Inst php7.4-cli [7.4.3-4+ubuntu18.04.1+deb.sury.org+1] (7.4.4-1+ubuntu18.04.1+deb.sury.org+1 ***** The main PPA for supported PHP versions with many PECL extensions *****:18.04/bionic [amd64]) []
Inst php7.4-common [7.4.3-4+ubuntu18.04.1+deb.sury.org+1] (7.4.4-1+ubuntu18.04.1+deb.sury.org+1 ***** The main PPA for supported PHP versions with many PECL extensions *****:18.04/bionic [amd64])
Inst php7.2-mysql [7.2.28-3+ubuntu18.04.1+deb.sury.org+1] (7.2.29-1+ubuntu18.04.1+deb.sury.org+1 ***** The main PPA for supported PHP versions with many PECL extensions *****:18.04/bionic [amd64]) []
Inst php7.2-opcache [7.2.28-3+ubuntu18.04.1+deb.sury.org+1] (7.2.29-1+ubuntu18.04.1+deb.sury.org+1 ***** The main PPA for supported PHP versions with many PECL extensions *****:18.04/bionic [amd64]) []

storcli.py generate no metrics

Hi to everybody,
I was trying to generate metrics with the script, only they are not generated.
Trying to direct the output of the script to a normal text file makes it empty.
Other scripts I installed work perfectly.
Does anyone have any idea what it might be?
Using python3 and storecli 1.21.06
Thanks to anybody wo will take a look.

Davide

storcli.py fails on cards without ROC temp sensor or Cachevault_info

I have some servers with older Megaraid cards for which the current storcli.py only returns one metric: megaraid_controller_info

The reason is that JSON output from storcli64 does not include these keys:

  • ROC temperature(Degree Celsius) (instead has "Temperature Sensor for ROC" : "Absent")
  • Cachevault_info

The first exception propagates upwards to the top-level except KeyError: in main() function, which silences the error but causes early termination.

storcli could not extract drive temperature

The storcli script has given us errors when trying to extract the temperature of a drive. our output looks like this.

$ sudo /opt/MegaRAID/storcli/storcli64 /cALL/eALL/sALL show all J | grep "Drive Temperature"
"Drive Temperature" : " 41C (105.80 F)",
"Drive Temperature" : " 42C (107.60 F)",
"Drive Temperature" : " 41C (105.80 F)",
"Drive Temperature" : "N/A",
"Drive Temperature" : " 39C (102.20 F)",
"Drive Temperature" : " 40C (104.00 F)",
"Drive Temperature" : " 39C (102.20 F)",
"Drive Temperature" : " 26C (78.80 F)",

notice the Temperature "N/A" of one of the drives. Our server is old so it is possible that the drive is either broken or doesn't have the sensors to measure this.

I'll have up a pull request shortly trying to remedy this issue. For now I suggest making a small check if the drive temperature is even a number and skipping it if it isn't. I am open to different ideas.

sponge only writes atomically when TMPDIR is on the same filesystem

Using sponge to atomically write files does not work if the environment variable TMPDIR is unset or located on a different file system. See its man page.

On default setups TMPDIR is undefined and sponge then creates a file in /tmp, which is a different file system. Using strace we can see that sponge creates a file in /tmp, attempts to rename() it to the destination, which fails with EXDEV and then moves it non-atomically.

$ echo | strace sponge foo
[โ€ฆ]
openat(AT_FDCWD, "/tmp/sponge.wCnFVZ", O_RDWR|O_CREAT|O_EXCL, 0600) = 3
umask(022)                              = 077
rt_sigprocmask(SIG_SETMASK, [], NULL, 8) = 0
fcntl(3, F_GETFL)                       = 0x8002 (flags O_RDWR|O_LARGEFILE)
read(0, "\n", 8192)                     = 1
read(0, "", 8191)                       = 0
lstat("foo", {st_mode=S_IFREG|0644, st_size=1, ...}) = 0
fstat(3, {st_mode=S_IFREG|0600, st_size=0, ...}) = 0
write(3, "\n", 1)                       = 1
chmod("/tmp/sponge.wCnFVZ", 0100644)    = 0
rename("/tmp/sponge.wCnFVZ", "foo")     = -1 EXDEV (Invalid cross-device link)
openat(AT_FDCWD, "foo", O_WRONLY|O_CREAT|O_TRUNC, 0666) = 4
lseek(3, 0, SEEK_SET)                   = 0
read(3, "\n", 8192)                     = 1
fstat(4, {st_mode=S_IFREG|0644, st_size=0, ...}) = 0
read(3, "", 8192)                       = 0
close(3)                                = 0
write(4, "\n", 1)                       = 1
close(4)                                = 0
rt_sigprocmask(SIG_BLOCK, [HUP INT QUIT PIPE ALRM TERM XCPU XFSZ VTALRM PROF IO], [], 8) = 0
unlink("/tmp/sponge.wCnFVZ")            = 0
[โ€ฆ]

Please either mention that sponge needs a properly configured TMPDIR variable or recommend a different tool/method for atomical writing.

apt.sh totals do not agree with update-notifier/apt-check

Welcome to Ubuntu 16.04.6 LTS (GNU/Linux 4.4.0-142-generic x86_64)

 * Documentation:  https://help.ubuntu.com
 * Management:     https://landscape.canonical.com
 * Support:        https://ubuntu.com/advantage

178 packages can be updated.
122 updates are security updates.

New release '18.04.3 LTS' available.
Run 'do-release-upgrade' to upgrade to it.


Last login: Fri Nov 22 20:24:29 2019 from 192.168.7.71
root@inbound:~# /usr/lib/update-notifier/apt-check
178;122root@inbound:~# /usr/lib/update-notifier/apt-check --human-readable
178 packages can be updated.
122 updates are security updates.
root@inbound:~# /usr/local/libexec/node_exporter/apt.sh
# HELP apt_upgrades_pending Apt package pending updates by origin.
# TYPE apt_upgrades_pending gauge
apt_upgrades_pending{origin="Ubuntu:16.04/xenial-updates",arch="all"} 21
apt_upgrades_pending{origin="Ubuntu:16.04/xenial-updates",arch="amd64"} 59
apt_upgrades_pending{origin="Ubuntu:16.04/xenial-updates,Ubuntu:16.04/xenial-security",arch="all"} 12
apt_upgrades_pending{origin="Ubuntu:16.04/xenial-updates,Ubuntu:16.04/xenial-security",arch="amd64"} 77
# HELP node_reboot_required Node reboot is required for software updates.
# TYPE node_reboot_required gauge
node_reboot_required 0

21+59+12+77 = 169, so apt.sh report is missing 9 packages

The inconsistency comes from the underlying tools:

root@inbound:~# /usr/lib/update-notifier/apt-check --package-names 2>&1 | sort | wc -l
178
root@inbound:~# /usr/bin/apt-get --just-print upgrade | grep '^Inst ' | wc -l
169
root@inbound:~# /usr/bin/apt-get --just-print upgrade | grep '^Conf ' | wc -l
169
root@inbound:~# /usr/bin/apt-get --just-print dist-upgrade | grep '^Inst ' | wc -l
180

And more specifically:

root@inbound:~# /usr/lib/update-notifier/apt-check --package-names 2>&1 | sort >a
root@inbound:~# /usr/bin/apt-get --just-print upgrade | grep '^Inst ' | cut -f2 -d" " | sort >b
root@inbound:~# diff -u a b
--- a	2019-11-23 09:24:31.646002682 +0000
+++ b	2019-11-23 09:24:48.506976158 +0000
@@ -18,7 +18,6 @@
 bzip2
 console-setup
 console-setup-linux
-containerd
 cpio
 cpp-5
 curl
@@ -28,7 +27,6 @@
 dh-python
 distro-info-data
 dnsutils
-docker.io
 dpkg
 dpkg-dev
 e2fslibs
@@ -115,15 +113,7 @@
 libuuid1
 libxslt1.1
 linux-firmware
-linux-generic
-linux-headers-4.4.0-169
-linux-headers-4.4.0-169-generic
-linux-headers-generic
-linux-image-4.4.0-169-generic
-linux-image-generic
 linux-libc-dev
-linux-modules-4.4.0-169-generic
-linux-modules-extra-4.4.0-169-generic
 login
 lshw
 lxc-common
@@ -153,13 +143,14 @@
 python-apt-common
 resolvconf
 rsyslog
-runc
 snapd
 software-properties-common
+sosreport
 sudo
 systemd
 systemd-sysv
 tzdata
+ubuntu-core-launcher
 ubuntu-fan
 ubuntu-minimal
 ubuntu-release-upgrader-core

Using "dist-upgrade" rather than "upgrade" we get much closer:

root@inbound:~# /usr/bin/apt-get --just-print dist-upgrade | grep '^Inst ' | cut -f2 -d" " | sort >c
root@inbound:~# wc -l c
180 c
root@inbound:~# diff -u a c
--- a	2019-11-23 09:24:31.646002682 +0000
+++ c	2019-11-23 09:26:22.036376114 +0000
@@ -156,10 +156,12 @@
 runc
 snapd
 software-properties-common
+sosreport
 sudo
 systemd
 systemd-sysv
 tzdata
+ubuntu-core-launcher
 ubuntu-fan
 ubuntu-minimal
 ubuntu-release-upgrader-core

But now we report 2 too many.

There are several points in /usr/lib/update-notifier/apt-check which skip packages. I made a small patch to find out which ones:

root@inbound:~# diff -u /usr/lib/update-notifier/apt-check my-apt-check
--- /usr/lib/update-notifier/apt-check	2018-12-07 13:09:15.000000000 +0000
+++ my-apt-check	2019-11-23 09:37:01.057273720 +0000
@@ -129,6 +129,7 @@
             inst_ver = pkg.current_ver
             cand_ver = depcache.get_candidate_ver(pkg)
             if cand_ver == inst_ver:
+                print("%r: skipping cand_ver == inst_ver" % pkg)
                 continue
             # check for security upgrades
             if isSecurityUpgrade(cand_ver):
@@ -143,6 +144,7 @@
                 ignored = ul._is_ignored_phased_update(aptcache[pkg.get_fullname()])
                 if ignored:
                     depcache.mark_keep(pkg)
+                    print("%r: ignored phased update" % pkg)
                     continue
             except ImportError:
                 pass
@@ -153,7 +155,7 @@
             # candidate version from another repo (-proposed or -updates)
             for ver in pkg.version_list:
                 if (inst_ver and apt_pkg.version_compare(ver.ver_str, inst_ver.ver_str) <= 0):
-                    #print("skipping '%s' " % ver.VerStr)
+                    #print("%r: skipping version %r < %r" % (pkg, ver.ver_str, inst_ver.ver_str))
                     continue
                 if isSecurityUpgrade(ver):
                     security_updates += 1

Result:

root@inbound:~# ./my-apt-check
<apt_pkg.Package object: name:'ubuntu-core-launcher' id:11321>: ignored phased update
<apt_pkg.Package object: name:'sosreport' id:11328>: ignored phased update
178;122

Function _is_ignored_phased_update comes from /usr/lib/python3/dist-packages/UpdateManager/Core/UpdateList.py. It's a bit odd: it seems to be pseudo-random whether this update is installed or not.

            if apt.apt_pkg.config.find_b(
                    self.NEVER_INCLUDE_PHASED_UPDATES, False):
                logging.info("holding back phased update per configuration")
                return True

            # its important that we always get the same result on
            # multiple runs of the update-manager, so we need to
            # feed a seed that is a combination of the pkg/ver/machine
            self.random.seed("%s-%s-%s" % (
                pkg.candidate.source_name, pkg.candidate.version,
                self.machine_uniq_id))
            threshold = pkg.candidate.record[self.PHASED_UPDATES_KEY]
            percentage = self.random.randint(0, 100)
            if percentage > int(threshold):
                logging.info("holding back phased update %s (%s < %s)" % (
                    pkg.name, threshold, percentage))
                return True

So I'm fine if those get included in the totals from apt.sh, since they'll have to be installed sooner or later.

ISTM, the simplest fix here is simply to change --just-print upgrade to --just-print dist-upgrade. With that change applied:

root@inbound:~# /usr/local/libexec/node_exporter/apt.sh
# HELP apt_upgrades_pending Apt package pending updates by origin.
# TYPE apt_upgrades_pending gauge
apt_upgrades_pending{origin="Ubuntu:16.04/xenial-updates",arch="all"} 21
apt_upgrades_pending{origin="Ubuntu:16.04/xenial-updates",arch="amd64"} 59
apt_upgrades_pending{origin="Ubuntu:16.04/xenial-updates,Ubuntu:16.04/xenial-security",arch="all"} 13
apt_upgrades_pending{origin="Ubuntu:16.04/xenial-updates,Ubuntu:16.04/xenial-security",arch="amd64"} 87
# HELP node_reboot_required Node reboot is required for software updates.
# TYPE node_reboot_required gauge
node_reboot_required 0

21+59+13+87 = 180. Note that the additional packages found are in the xenial-security groups.

storcli.py shows battery_backup_healthy when it needs attention

I have some megaraid controllers which are returning the following:

megaraid_healthy 0   <== there's a problem
megaraid_failed 0
megaraid_degraded 0
megaraid_battery_backup_healthy 1

This is odd: the controller says it needs attention, but it's not obvious why.

On closer inspection: storcli.py returns battery_backup_healthy 1 if the BBU state is 0 or 32. I'm getting 32, and the battery is also "Degraded":

# /opt/MegaRAID/storcli/storcli64 /cALL show all J | less
...
                "Status" : {
                  ==>   "Controller Status" : "Needs Attention",
                        "Memory Correctable Errors" : 0,
                        "Memory Uncorrectable Errors" : 0,
                        "ECC Bucket Count" : 0,
                        "Any Offline VD Cache Preserved" : "No",
                  ==>   "BBU Status" : 32,
                        "PD Firmware Download in progress" : "No",
                        "Support PD Firmware Download" : "No",
                        "Lock Key Assigned" : "No",
                        "Failed to get lock key on bootup" : "No",
                        "Lock key has not been backed up" : "No",
                        "Bios was not detected during boot" : "No",
                        "Controller must be rebooted to complete security operation" : "No",
                        "A rollback operation is in progress" : "No",
                        "At least one PFK exists in NVRAM" : "No",
                        "SSC Policy is WB" : "No",
                        "Controller has booted into safe mode" : "No",
                        "Controller shutdown required" : "No"
                },
...
                "BBU_Info" : [
                        {
                                "Model" : "iBBU",
                         ==>    "State" : "Dgd (Needs Attention)",
                                "RetentionTime" : "48 hours +",
                                "Temp" : "29C",
                                "Mode" : "-",
                                "MfgDate" : "2014/02/10",
                                "Next Learn" : "2019/06/27  01:33:42"
                        }
                ]

My best guess is that the controller "Needs Attention" because of the battery status, but I can't find documentation for what status=32 means. Can you point to some info which says that 32 is healthy?

For comparison, here's what MegaCLI says on the same controller:

# /opt/MegaRAID/MegaCli/MegaCli64 -AdpBbuCmd -GetBbuStatus -aALL

BBU status for Adapter: 0

BatteryType: iBBU
Voltage: 4014 mV
Current: 0 mA
Temperature: 29 C
Battery State: Degraded(Need Attention)
		A manual learn is required.
BBU Firmware Status:

  Charging Status              : None
  Voltage                                 : OK
  Temperature                             : OK
  Learn Cycle Requested	                  : Yes
  Learn Cycle Active                      : No
  Learn Cycle Status                      : OK
  Learn Cycle Timeout                     : No
  I2c Errors Detected                     : No
  Battery Pack Missing                    : No
  Battery Replacement required            : No
  Remaining Capacity Low                  : No
  Periodic Learn Required                 : No
  Transparent Learn                       : No
  No space to cache offload               : No
  Pack is about to fail & should be replaced : No
  Cache Offload premium feature required  : No
  Module microcode update required        : No


GasGuageStatus:
  Fully Discharged        : No
  Fully Charged           : No
  Discharging             : Yes
  Initialized             : Yes
  Remaining Time Alarm    : No
  Discharge Terminated    : No
  Over Temperature        : No
  Charging Terminated     : No
  Over Charged            : No
  Relative State of Charge: 75 %
  Charger System State: 49169
  Charger System Ctrl: 0
  Charging current: 512 mA
  Absolute state of charge: 77 %
  Max Error: 9 %

Exit Code: 0x00

Perhaps 32 means "manual learn is required"? But in that case, I'd say it's not "healthy", in the sense that some attention is required.

On another controller, which is healthy, the BBU state is 0. This one has CacheVault_Info rather than BBU_Info:

                "Cachevault_Info" : [
                        {
                                "Model" : "CVPM02",
                                "State" : "Optimal",
                                "Temp" : "30C",
                                "Mode" : "-",
                                "MfgDate" : "2014/05/30"
                        }
                ]

(Aside 1: storcli.py provides a metric megaraid_cv_temperature for the temperature from Cachevault_Info, but not the temperature from BBU_Info)

On a different controller, which doesn't have a BBU at all, I get megaraid_battery_backup_healthy 0. In other words: it's flagging as a battery "bad" even though the controller is healthy and there's no action required. The JSON contains:

                        "BBU Status" : "NA",

(Aside 2: I would be inclined in this state to drop the megaraid_battery_backup_healthy metric entirely. Otherwise we get a false alarm about a bad battery, especially since there's no other metric saying whether the BBU is present or not. On the other hand, I can suppress this alarm if megaraid_healthy is 1, which is is)

So in summary:

  • Can anyone confirm what BBU status 32 means?
  • Is it correct for storcli.py to report the battery as "healthy" in this condition, even though the overall controller health is "needs attention"?
  • Should we return BBU_Info temperature as a different metric, e.g. megaraid_bbu_temperature?
  • Should we suppress the megaraid_battery_backup_healthy metric if the BBU is not present (status="NA")? Or have a different metric for BBU present/absent?

Issues with smartmon.py

  1. smartmon.py does not return the "raw" values of metrics (only cooked value/threshold/worst): but almost always the raw values are the meaningful ones. e.g.
# HELP smartmon_attr_value SMART metric attr_value
# TYPE smartmon_attr_value gauge
smartmon_attr_value{name="reallocated_sector_ct",disk="/dev/sda"} 100
smartmon_attr_value{name="power_on_hours",disk="/dev/sda"} 97
smartmon_attr_value{name="power_cycle_count",disk="/dev/sda"} 99
smartmon_attr_value{name="wear_leveling_count",disk="/dev/sda"} 87
smartmon_attr_value{name="erase_fail_count_total",disk="/dev/sda"} 100
smartmon_attr_value{name="airflow_temperature_cel",disk="/dev/sda"} 70
smartmon_attr_value{name="total_lbas_written",disk="/dev/sda"} 99

None of those are meaningful. For example, the power-on time is not 97 hours, and the temperature is not 70 degrees. You have to trust that the nearer to zero it is, the worse it is.

Compare smartmon.sh:

smartmon_airflow_temperature_cel_raw_value{disk="/dev/sda",type="sat",smart_id="190"} 3.000000e+01
smartmon_airflow_temperature_cel_value{disk="/dev/sda",type="sat",smart_id="190"} 70
smartmon_erase_fail_count_total_raw_value{disk="/dev/sda",type="sat",smart_id="182"} 0.000000e+00
smartmon_erase_fail_count_total_value{disk="/dev/sda",type="sat",smart_id="182"} 100
smartmon_power_cycle_count_raw_value{disk="/dev/sda",type="sat",smart_id="12"} 6.000000e+00
smartmon_power_cycle_count_value{disk="/dev/sda",type="sat",smart_id="12"} 99
smartmon_power_on_hours_raw_value{disk="/dev/sda",type="sat",smart_id="9"} 1.094000e+04
smartmon_power_on_hours_value{disk="/dev/sda",type="sat",smart_id="9"} 97
smartmon_reallocated_sector_ct_raw_value{disk="/dev/sda",type="sat",smart_id="5"} 0.000000e+00
smartmon_reallocated_sector_ct_value{disk="/dev/sda",type="sat",smart_id="5"} 100
smartmon_total_lbas_written_raw_value{disk="/dev/sda",type="sat",smart_id="241"} 4.342395e+11
smartmon_total_lbas_written_value{disk="/dev/sda",type="sat",smart_id="241"} 99
smartmon_wear_leveling_count_raw_value{disk="/dev/sda",type="sat",smart_id="177"} 2.670000e+02
smartmon_wear_leveling_count_value{disk="/dev/sda",type="sat",smart_id="177"} 87

The cooked values are there too, but the raw ones are the useful ones (e.g. airflow temperature 30 degrees, power on hours 10940)

Aside: using named metrics like this is I think also better practice than having a shared metric "smartmon_attr_value" containing unrelated metrics (although since they are all cooked it's arguably OK)

  1. With drives downstream of a megaraid card, smartmon.py doesn't give unique labels to each metric:
# HELP smartmon_device_active SMART metric device_active
# TYPE smartmon_device_active gauge
smartmon_device_active{disk="/dev/bus/0"} 1
...

Compare with smartmon.sh:

# HELP smartmon_device_active SMART metric device_active
# TYPE smartmon_device_active gauge
smartmon_device_active{disk="/dev/bus/0",type="sat+megaraid,10"} 1
smartmon_device_active{disk="/dev/bus/0",type="sat+megaraid,11"} 1
smartmon_device_active{disk="/dev/bus/0",type="sat+megaraid,12"} 1
smartmon_device_active{disk="/dev/bus/0",type="sat+megaraid,13"} 1
smartmon_device_active{disk="/dev/bus/0",type="sat+megaraid,14"} 1
...

WORKAROUND: use smartmon.sh instead. (Bonus: it also works on older systems that don't have python3)

monitor LVM cache usage

LVM can have caches of other logical volumes, for example a SSD cache of a slower HDD drive.

let's monitor that in lvm-prom-collector.

md_info.sh / md_info_detail.sh: /dev/md/ directory does not exist on newer kernels

On some newer machines, I find that /dev/mdXXX exists but the /dev/md directory does not. This includes Ubuntu 20.04 and Debian 10, both with 5.4.0 kernel.

# ls -l /dev/md*
brw-rw---- 1 root disk 9, 127 Mar 31 08:46 /dev/md127
# 

Unfortunately the textfile collector scripts are hard-wired to look for /dev/md/* and so they don't pick up any arrays.

The array is visible under /dev/disk/by-id/md-name-<HOSTNAME>:<ARRAYNAME>

# find /dev -lname '*md*'
/dev/log
/dev/disk/by-uuid/f36588df-7e7f-446a-9be4-c0c6d092dcf4
/dev/disk/by-id/md-name-CORE-ELASTIC-VM1:127
/dev/disk/by-id/md-uuid-f6641f8b:65b425e9:298e0ac2:b6c3c83e
/dev/block/9:127
# find /dev -lname '*md*' | xargs ls -l
lrwxrwxrwx 1 root root  8 Mar 31 08:46 /dev/block/9:127 -> ../md127
lrwxrwxrwx 1 root root 11 Mar 31 08:46 /dev/disk/by-id/md-name-CORE-ELASTIC-VM1:127 -> ../../md127
lrwxrwxrwx 1 root root 11 Mar 31 08:46 /dev/disk/by-id/md-uuid-f6641f8b:65b425e9:298e0ac2:b6c3c83e -> ../../md127
lrwxrwxrwx 1 root root 11 Mar 31 08:46 /dev/disk/by-uuid/f36588df-7e7f-446a-9be4-c0c6d092dcf4 -> ../../md127
lrwxrwxrwx 1 root root 28 Mar 31 08:46 /dev/log -> /run/systemd/journal/dev-log

This path also exists for Ubuntu 18.04 (4.15.0). Checking the oldest machine I have, which is CentOS 6 (2.6.32):

# find /dev -lname '*md*'
/dev/md/scratch1_0
/dev/disk/by-uuid/a6444e5e-6ee7-49bd-8973-970756366b30
/dev/disk/by-id/md-uuid-962cbdcc:b9482b4a:c9971b8d:e2b43c68
/dev/disk/by-id/md-name-scratch1
/dev/block/9:127
/dev/.udev/watch/61
/dev/.udev/links/disk\x2fby-uuid\x2fa6444e5e-6ee7-49bd-8973-970756366b30/b9:127
/dev/.udev/links/md\x2fscratch1_0/b9:127
/dev/.udev/links/disk\x2fby-id\x2fmd-uuid-962cbdcc:b9482b4a:c9971b8d:e2b43c68/b9:127
/dev/.udev/links/disk\x2fby-id\x2fmd-name-scratch1/b9:127

In this host, mdadm -E shows the name as just

           Name : scratch1

although it's currently picked up as md_name="scratch1_0", and so changing to /dev/disk/by-id/md-name-* would change the label set.

However, I think this is probably the right long-term fix. To demonstrate:

--- a/roles/prometheus_node_exporter/files/node-exporter-textfile-collector-scripts/md_info_detail.sh
+++ b/roles/prometheus_node_exporter/files/node-exporter-textfile-collector-scripts/md_info_detail.sh
@@ -6,7 +6,7 @@

 set -eu

-for MD_DEVICE in /dev/md/*; do
+for MD_DEVICE in /dev/disk/by-id/md-name-*; do
   if [ -b "$MD_DEVICE" ]; then
   # Subshell to avoid eval'd variables from leaking between iterations
   (
@@ -15,7 +15,7 @@ for MD_DEVICE in /dev/md/*; do

     # Remove /dev/ prefix
     MD_DEVICE_NUM=${MD_DEVICE_NUM#/dev/}
-    MD_DEVICE=${MD_DEVICE#/dev/md/}
+    MD_DEVICE=${MD_DEVICE#/dev/disk/by-id/md-name-}

     # Query sysfs for info about md device
     SYSFS_BASE="/sys/devices/virtual/block/${MD_DEVICE_NUM}/md"

apt info should report cache age

We cannot alert on stale apt caches. Combined with #179, we can quickly end up in a situation where critical security upgrades are delayed or never installed.

We should have a timestamp metric showing when the last apt update was ran. Optionnally, we could have that metric per mirror as well.

apt_info.py - wrong cache timestamps

Hi,

Since feb943f, I have encountered multiple issues with the cache timestamp:

  • at least on debian 12 cloud images, APT::Periodic::Update-Package-Lists doesn't mean that /var/lib/apt/periodic/update-success-stamp exists:

    >>> import apt_pkg
    >>> apt_pkg.init_config()
    >>> apt_pkg.config.find_b("APT::Periodic::Update-Package-Lists")
    True
    
    user@server:~# ls /var/lib/apt/periodic/
    download-upgradeable-stamp  unattended-upgrades-stamp  update-stamp  upgrade-stamp
    

    This leads to a null timestamp in the metric (apt_package_cache_timestamp_seconds 0.0).
    Maybe we can fallback on the other method if the file doesn't exist?

  • The mtime of /var/lib/apt/lists is not necessarily updated when running apt update (perhaps only if there are modifications?). This behavior differs from the previous use of /var/cache/apt/pkgcache.bin, which was consistently modified upon each update. Perhaps /var/lib/apt/lists/partial could serve as a suitable substitute in this case?

    user@server:~ date 
    Wed Dec 13 20:35:39 UTC 2023
    
    user@server:~ sudo apt update
    
    user@server:~ sudo ls -la /var/lib/apt/lists | grep "Dec 13"
    drwxr-xr-x 4 root root     4096 Dec 13 16:44 .
    drwx------ 2 _apt root     4096 Dec 13 20:35 partial
    
    user@servfer:~ sudo ls -la /var/cache/apt/pkgcache.bin       
    -rw-r--r-- 1 root root 35241413 Dec 13 20:35 /var/cache/apt/pkgcache.bin
    

apt_info.py - pending_upgrades always empty

Hi,

Since #181, the script apt_info.py never returns any apt_upgrades_pending. Instead, all the packages are counted in the apt_upgrades_held.

I think this is because the cache.upgrade(True) call marks the packages that could be upgraded, and without it, no package has the marked_upgrade boolean set to true.

mellanox_hca_temp: suppress errors when virtual functions present

VFs appear as additional infiniband devices, but obviously don't report temperatures. The logs are then flooded with:

Dec 17 00:00:53 penny sh[1151952]: mopen: Operation not supported
Dec 17 00:00:53 penny sh[1151947]: mellanox_hca_temp: Failed to get temperature from InfiniBand HCA 'mlx5_2'!
Dec 17 00:00:53 penny sh[1151953]: mopen: Operation not supported
Dec 17 00:00:53 penny sh[1151947]: mellanox_hca_temp: Failed to get temperature from InfiniBand HCA 'mlx5_3'!

and so on.

The only clue I could find to recognise them as virtual is that node_guid is 0000:0000:0000:0000. I'm not sure if this is supposed to change when setting the mac address on the interfaces.

So far, with the virtual function interfaces unconfigured, the following patch suppresses the errors for me:

--- mellanox_hca_temp.orig      2021-06-27 08:55:33.406292246 +0200
+++ mellanox_hca_temp   2023-12-22 15:18:46.072149247 +0100
@@ -41,6 +41,10 @@
     if test ! -d "$dev"; then
         continue
     fi
+    # node_guid is all zeros for Virtual Functions, which report no temp.
+    if [ "$(cat $dev/node_guid)" = "0000:0000:0000:0000" ]; then
+       continue
+    fi
     device="${dev##*/}"
 
     # get temperature

nvme_metrics.sh does not write in given file

The nvme_metrics.sh script does not write to my log file. The file is empty. Other scripts are working - what am I missing?

My file is located in /root/nvme_metrics.sh:

-rwxr-xr-x 1 root root 3700 Mar 7 11:26 nvme_metrics.sh

My Crontab:

* * * * * /bin/bash /root/nvme_metrics.sh > /var/lib/node_exporter/textfile_collector/disk_health.prom

My target file:

-rw-r--r-- 1 root root 0 Mar 7 11:54 /var/lib/node_exporter/textfile_collector/disk_health.prom

The syslog when the cronjob was executed:

Mar 7 11:55:01 ebay CRON[807]: (root) CMD (/bin/bash /root/nvme_metrics.sh > /var/lib/node_exporter/textfile_collector/disk_health.prom)

Ii also tried the following crontabs:

* * * * * /bin/bash /root/nvme_metrics.sh | sponge /var/lib/node_exporter/textfile_collector/disk_health.prom
* * * * * /bin/bash /root/nvme_metrics.sh | tee /var/lib/node_exporter/textfile_collector/disk_health.prom

Anyone else facing the same problem? I am running Debian 10:

Distributor ID: Debian
Description: Debian GNU/Linux 10 (buster)
Release: 10
Codename: buster

script file naming

I think filename of scripts should be equal metric prefix

For example:
metric=node_ipmi_temperature_celsius
script=node_ipmi

or vice versa:
script=ipmitool
metric=ipmitool_temperature_celsius

storcli.py ignores a controller

I am using storcli.py on a system where are 2 controllers, but I get metrics only for the first one: the other one seems completely ignored by the collector.
The same happens on a different host with the same hardware configuration.

Here is the output when running storcli64 /c1 show

Generating detailed summary of the adapter, it may take a while to complete.

CLI Version = 007.1017.0000.0000 May 10, 2019
Operating system = Linux 5.3.0-26-generic
Controller = 1
Status = Success
Description = None

Product Name = AVAGO MegaRAID SAS 9361-8i
Serial Number = (hidden)
SAS Address =  500605b00ed3fb50
PCI Address = 00:d8:00:00
System Time = 02/20/2020 11:50:02
Mfg. Date = 11/02/18
Controller Time = 02/20/2020 11:49:57
FW Package Build = 24.21.0-0095
BIOS Version = 6.36.00.3_4.19.08.00_0x06180203
FW Version = 4.680.00-8454
Driver Name = megaraid_sas
Driver Version = 07.710.50.00-rc1
Current Personality = RAID-Mode
Vendor Id = 0x1000
Device Id = 0x5D
SubVendor Id = 0x1000
SubDevice Id = 0x9361
Host Interface = PCI-E
Device Interface = SAS-12G
Bus Number = 216
Device Number = 0
Function Number = 0
Drive Groups = 21

TOPOLOGY :
========

----------------------------------------------------------------------------
DG Arr Row EID:Slot DID Type  State BT      Size PDC  PI SED DS3  FSpace TR
----------------------------------------------------------------------------
 0 -   -   -        -   RAID0 Optl  N  12.732 TB enbl N  N   dflt N      N
 0 0   -   -        -   RAID0 Optl  N  12.732 TB enbl N  N   dflt N      N
 0 0   0   8:0      10  DRIVE Onln  Y  12.732 TB enbl N  N   dflt -      N
 1 -   -   -        -   RAID0 Optl  N  12.732 TB enbl N  N   dflt N      N
 1 0   -   -        -   RAID0 Optl  N  12.732 TB enbl N  N   dflt N      N
 1 0   0   8:2      18  DRIVE Onln  Y  12.732 TB enbl N  N   dflt -      N
 2 -   -   -        -   RAID0 Optl  N  12.732 TB enbl N  N   dflt N      N
 2 0   -   -        -   RAID0 Optl  N  12.732 TB enbl N  N   dflt N      N
 2 0   0   8:3      22  DRIVE Onln  Y  12.732 TB enbl N  N   dflt -      N
 3 -   -   -        -   RAID0 Optl  N  12.732 TB enbl N  N   dflt N      N
 3 0   -   -        -   RAID0 Optl  N  12.732 TB enbl N  N   dflt N      N
 3 0   0   8:4      26  DRIVE Onln  Y  12.732 TB enbl N  N   dflt -      N
 4 -   -   -        -   RAID0 Optl  N  12.732 TB enbl N  N   dflt N      N
 4 0   -   -        -   RAID0 Optl  N  12.732 TB enbl N  N   dflt N      N
 4 0   0   8:5      29  DRIVE Onln  Y  12.732 TB enbl N  N   dflt -      N
 5 -   -   -        -   RAID0 Optl  N  12.732 TB enbl N  N   dflt N      N
 5 0   -   -        -   RAID0 Optl  N  12.732 TB enbl N  N   dflt N      N
 5 0   0   8:6      11  DRIVE Onln  Y  12.732 TB enbl N  N   dflt -      N
 6 -   -   -        -   RAID0 Optl  N  12.732 TB enbl N  N   dflt N      N
 6 0   -   -        -   RAID0 Optl  N  12.732 TB enbl N  N   dflt N      N
 6 0   0   8:7      15  DRIVE Onln  Y  12.732 TB enbl N  N   dflt -      N
 7 -   -   -        -   RAID0 Optl  N  12.732 TB enbl N  N   dflt N      N
 7 0   -   -        -   RAID0 Optl  N  12.732 TB enbl N  N   dflt N      N
 7 0   0   8:8      19  DRIVE Onln  Y  12.732 TB enbl N  N   dflt -      N
 8 -   -   -        -   RAID0 Optl  N  12.732 TB enbl N  N   dflt N      N
 8 0   -   -        -   RAID0 Optl  N  12.732 TB enbl N  N   dflt N      N
 8 0   0   8:9      23  DRIVE Onln  Y  12.732 TB enbl N  N   dflt -      N
 9 -   -   -        -   RAID0 Optl  N  12.732 TB enbl N  N   dflt N      N
 9 0   -   -        -   RAID0 Optl  N  12.732 TB enbl N  N   dflt N      N
 9 0   0   8:10     27  DRIVE Onln  Y  12.732 TB enbl N  N   dflt -      N
10 -   -   -        -   RAID0 Optl  N  12.732 TB enbl N  N   dflt N      N
10 0   -   -        -   RAID0 Optl  N  12.732 TB enbl N  N   dflt N      N
10 0   0   8:11     30  DRIVE Onln  Y  12.732 TB enbl N  N   dflt -      N
11 -   -   -        -   RAID0 Optl  N  12.732 TB enbl N  N   dflt N      N
11 0   -   -        -   RAID0 Optl  N  12.732 TB enbl N  N   dflt N      N
11 0   0   8:13     16  DRIVE Onln  Y  12.732 TB enbl N  N   dflt -      N
12 -   -   -        -   RAID0 Optl  N  12.732 TB enbl N  N   dflt N      N
12 0   -   -        -   RAID0 Optl  N  12.732 TB enbl N  N   dflt N      N
12 0   0   8:14     20  DRIVE Onln  Y  12.732 TB enbl N  N   dflt -      N
13 -   -   -        -   RAID0 Optl  N  12.732 TB enbl N  N   dflt N      N
13 0   -   -        -   RAID0 Optl  N  12.732 TB enbl N  N   dflt N      N
13 0   0   8:15     24  DRIVE Onln  Y  12.732 TB enbl N  N   dflt -      N
14 -   -   -        -   RAID0 Optl  N  12.732 TB enbl N  N   dflt N      N
14 0   -   -        -   RAID0 Optl  N  12.732 TB enbl N  N   dflt N      N
14 0   0   8:16     28  DRIVE Onln  Y  12.732 TB enbl N  N   dflt -      N
15 -   -   -        -   RAID0 Optl  N  12.732 TB enbl N  N   dflt N      N
15 0   -   -        -   RAID0 Optl  N  12.732 TB enbl N  N   dflt N      N
15 0   0   8:17     31  DRIVE Onln  Y  12.732 TB enbl N  N   dflt -      N
16 -   -   -        -   RAID0 Optl  N  12.732 TB enbl N  N   dflt N      N
16 0   -   -        -   RAID0 Optl  N  12.732 TB enbl N  N   dflt N      N
16 0   0   8:18     13  DRIVE Onln  Y  12.732 TB enbl N  N   dflt -      N
17 -   -   -        -   RAID0 Optl  N  12.732 TB enbl N  N   dflt N      N
17 0   -   -        -   RAID0 Optl  N  12.732 TB enbl N  N   dflt N      N
17 0   0   8:19     17  DRIVE Onln  Y  12.732 TB enbl N  N   dflt -      N
18 -   -   -        -   RAID0 Optl  N  12.732 TB enbl N  N   dflt N      N
18 0   -   -        -   RAID0 Optl  N  12.732 TB enbl N  N   dflt N      N
18 0   0   8:20     21  DRIVE Onln  Y  12.732 TB enbl N  N   dflt -      N
19 -   -   -        -   RAID0 Optl  N  12.732 TB enbl N  N   dflt N      N
19 0   -   -        -   RAID0 Optl  N  12.732 TB enbl N  N   dflt N      N
19 0   0   8:21     25  DRIVE Onln  Y  12.732 TB enbl N  N   dflt -      N
20 -   -   -        -   RAID0 Optl  N  12.732 TB enbl N  N   dflt N      N
20 0   -   -        -   RAID0 Optl  N  12.732 TB enbl N  N   dflt N      N
20 0   0   8:1      35  DRIVE Onln  Y  12.732 TB enbl N  N   dflt -      N
----------------------------------------------------------------------------

DG=Disk Group Index|Arr=Array Index|Row=Row Index|EID=Enclosure Device ID
DID=Device ID|Type=Drive Type|Onln=Online|Rbld=Rebuild|Dgrd=Degraded
Pdgd=Partially degraded|Offln=Offline|BT=Background Task Active
PDC=PD Cache|PI=Protection Info|SED=Self Encrypting Drive|Frgn=Foreign
DS3=Dimmer Switch 3|dflt=Default|Msng=Missing|FSpace=Free Space Present
TR=Transport Ready

Virtual Drives = 21

VD LIST :
=======

--------------------------------------------------------------
DG/VD TYPE  State Access Consist Cache Cac sCC      Size Name
--------------------------------------------------------------
0/0   RAID0 Optl  RW     Yes     RAWBD -   ON  12.732 TB
20/1  RAID0 Optl  RW     Yes     RAWBD -   ON  12.732 TB VD_1
1/2   RAID0 Optl  RW     Yes     RAWBD -   ON  12.732 TB
2/3   RAID0 Optl  RW     Yes     RAWBD -   ON  12.732 TB
3/4   RAID0 Optl  RW     Yes     RAWBD -   ON  12.732 TB
4/5   RAID0 Optl  RW     Yes     RAWBD -   ON  12.732 TB
5/6   RAID0 Optl  RW     Yes     RAWBD -   ON  12.732 TB
6/7   RAID0 Optl  RW     Yes     RAWBD -   ON  12.732 TB
7/8   RAID0 Optl  RW     Yes     RAWBD -   ON  12.732 TB
8/9   RAID0 Optl  RW     Yes     RAWBD -   ON  12.732 TB
9/10  RAID0 Optl  RW     Yes     RAWBD -   ON  12.732 TB
10/11 RAID0 Optl  RW     Yes     RAWBD -   ON  12.732 TB
11/13 RAID0 Optl  RW     Yes     RAWBD -   ON  12.732 TB
12/14 RAID0 Optl  RW     Yes     RAWBD -   ON  12.732 TB
13/15 RAID0 Optl  RW     Yes     RAWBD -   ON  12.732 TB
14/16 RAID0 Optl  RW     Yes     RAWBD -   ON  12.732 TB
15/17 RAID0 Optl  RW     Yes     RAWBD -   ON  12.732 TB
16/18 RAID0 Optl  RW     Yes     RAWBD -   ON  12.732 TB
17/19 RAID0 Optl  RW     Yes     RAWBD -   ON  12.732 TB
18/20 RAID0 Optl  RW     Yes     RAWBD -   ON  12.732 TB
19/21 RAID0 Optl  RW     Yes     RAWBD -   ON  12.732 TB
--------------------------------------------------------------

EID=Enclosure Device ID| VD=Virtual Drive| DG=Drive Group|Rec=Recovery
Cac=CacheCade|OfLn=OffLine|Pdgd=Partially Degraded|Dgrd=Degraded
Optl=Optimal|RO=Read Only|RW=Read Write|HD=Hidden|TRANS=TransportReady|B=Blocked|
Consist=Consistent|R=Read Ahead Always|NR=No Read Ahead|WB=WriteBack|
AWB=Always WriteBack|WT=WriteThrough|C=Cached IO|D=Direct IO|sCC=Scheduled
Check Consistency

Physical Drives = 21

PD LIST :
=======

-----------------------------------------------------------------------------
EID:Slt DID State DG      Size Intf Med SED PI SeSz Model            Sp Type
-----------------------------------------------------------------------------
8:0      10 Onln   0 12.732 TB SAS  HDD N   N  512B WUH721414AL5204  U  -
8:1      35 Onln  20 12.732 TB SAS  HDD N   N  512B WUH721414AL5204  U  -
8:2      18 Onln   1 12.732 TB SAS  HDD N   N  512B WUH721414AL5204  U  -
8:3      22 Onln   2 12.732 TB SAS  HDD N   N  512B WUH721414AL5204  U  -
8:4      26 Onln   3 12.732 TB SAS  HDD N   N  512B WUH721414AL5204  U  -
8:5      29 Onln   4 12.732 TB SAS  HDD N   N  512B WUH721414AL5204  U  -
8:6      11 Onln   5 12.732 TB SAS  HDD N   N  512B WUH721414AL5204  U  -
8:7      15 Onln   6 12.732 TB SAS  HDD N   N  512B WUH721414AL5204  U  -
8:8      19 Onln   7 12.732 TB SAS  HDD N   N  512B WUH721414AL5204  U  -
8:9      23 Onln   8 12.732 TB SAS  HDD N   N  512B WUH721414AL5204  U  -
8:10     27 Onln   9 12.732 TB SAS  HDD N   N  512B WUH721414AL5204  U  -
8:11     30 Onln  10 12.732 TB SAS  HDD N   N  512B WUH721414AL5204  U  -
8:13     16 Onln  11 12.732 TB SAS  HDD N   N  512B WUH721414AL5204  U  -
8:14     20 Onln  12 12.732 TB SAS  HDD N   N  512B WUH721414AL5204  U  -
8:15     24 Onln  13 12.732 TB SAS  HDD N   N  512B WUH721414AL5204  U  -
8:16     28 Onln  14 12.732 TB SAS  HDD N   N  512B WUH721414AL5204  U  -
8:17     31 Onln  15 12.732 TB SAS  HDD N   N  512B WUH721414AL5204  U  -
8:18     13 Onln  16 12.732 TB SAS  HDD N   N  512B WUH721414AL5204  U  -
8:19     17 Onln  17 12.732 TB SAS  HDD N   N  512B WUH721414AL5204  U  -
8:20     21 Onln  18 12.732 TB SAS  HDD N   N  512B WUH721414AL5204  U  -
8:21     25 Onln  19 12.732 TB SAS  HDD N   N  512B WUH721414AL5204  U  -
-----------------------------------------------------------------------------

EID=Enclosure Device ID|Slt=Slot No.|DID=Device ID|DG=DriveGroup
DHS=Dedicated Hot Spare|UGood=Unconfigured Good|GHS=Global Hotspare
UBad=Unconfigured Bad|Onln=Online|Offln=Offline|Intf=Interface
Med=Media Type|SED=Self Encryptive Drive|PI=Protection Info
SeSz=Sector Size|Sp=Spun|U=Up|D=Down|T=Transition|F=Foreign
UGUnsp=Unsupported|UGShld=UnConfigured shielded|HSPShld=Hotspare shielded
CFShld=Configured shielded|Cpybck=CopyBack|CBShld=Copyback Shielded
UBUnsp=UBad Unsupported

storcli.py duplicates metric for megaraid_controller_info

Example:

# HELP megaraid_controller_info MegaRAID controller info
# TYPE megaraid_controller_info gauge
megaraid_controller_info{controller="0",model="LSI MegaRAID SAS 9260-4i",serial="SVxxxxxxxx",fwversion="2.130.383-2315"} 1.0
megaraid_controller_info{controller="1",model="LSI MegaRAID SAS 9280-24i4e",serial="SVyyyyyyyy",fwversion="2.130.353-1663"} 1.0

This causes node_exporter to emit a warning about duplicated metrics.

Appears to be because get_basic_controller_info is called from both handle_common_controller and handle_megaraid_controller / handle_sas_controller

apt.sh include kept-back packages

Hi. My use-case for this script was to check if we have updates for our mongodb server machines. However, to reduce the risk of accidentally running apt upgrade and upgrading the mongodb binaries, we have kept them back. These are the exact packages I wanted their results in my metrics, but because of them not being upgraded by apt upgrade, they are not shown in the captured result by this script.
I tried adding --with-new-pkgs to the executed apt --just-print upgrade command, but it complains:

E: Command line option --with-new-pkgs is not understood in combination with the other options

Is there any solution to what I want here?

apt_info.py can hang for hours

We have a situation here where numerous machines are seeing the apt_info.py script hang for hours. This has been reported in Debian as bug https://bugs.debian.org/cgi-bin/bugreport.cgi?bug=1028212 and is being tracked in our internal tracker as https://gitlab.torproject.org/tpo/tpa/team/-/issues/41355

This is possibly an upstream issue, part of python-apt, requires further investigation. Current workaround includes installing a TimeoutStartSec=30s in the systemd unit [Service] block.

InvalidOperation exception in smartmon.py

# HELP smartmon_attr_threshold SMART metric attr_threshold
# TYPE smartmon_attr_threshold gauge
Traceback (most recent call last):
  File "smartmon.py", line 378, in <module>
    main()
  File "smartmon.py", line 375, in main
    metric_print(m, 'smartmon_')
  File "smartmon.py", line 115, in metric_print
    print(metric_format(metric, prefix))
  File "smartmon.py", line 101, in metric_format
    value = decimal.Decimal(metric.value)
decimal.InvalidOperation: [<class 'decimal.ConversionSyntax'>]

apt.sh outputs wrong arch label

Original issue prometheus/node_exporter#1462

Current apt.sh script:

/usr/bin/apt-get --just-print upgrade \
  | /usr/bin/awk -F'[()]' \
      '/^Inst/ { sub("^[^ ]+ ", "", $2); sub("\\[", " ", $2);
                 sub(" ", "", $2); sub("\\]", "", $2); print $2 }' \
  | /usr/bin/sort \
  | /usr/bin/uniq -c \
  | awk '{ gsub(/\\\\/, "\\\\", $2); gsub(/\"/, "\\\"", $2);
           gsub(/\[/, "", $3); gsub(/\]/, "", $3);
           print "apt_upgrades_pending{origin=\"" $2 "\",arch=\"" $3 "\"} " $1}'

Outputs wrong arch => arch="Debian/Ubuntu".

apt_upgrades_pending{origin="PostgreSQLfor",arch="Debian/Ubuntu"} 2
apt_upgrades_pending{origin="PostgreSQLfor",arch="Debian/Ubuntu"} 4
apt_upgrades_pending{origin="Ubuntu:18.04/bionic-updates",arch="all"} 19
apt_upgrades_pending{origin="Ubuntu:18.04/bionic-updates",arch="amd64"} 54
apt_upgrades_pending{origin="Ubuntu:18.04/bionic-updates,Ubuntu:18.04/bionic-security",arch="all"} 13
apt_upgrades_pending{origin="Ubuntu:18.04/bionic-updates,Ubuntu:18.04/bionic-security",arch="amd64"} 42
apt_upgrades_pending{origin="universe-updates/201907312020bionic:bionic",arch="all"} 2
apt_upgrades_pending{origin="universe-updates/201907312020bionic:bionic",arch="amd64"} 3

The raw data that the script processes (I took only the PostgreSQLfor parts which relate to the duplication):

$ /usr/bin/apt-get --just-print upgrade |grep 'PostgreSQL for'
Inst postgresql-common [199.pgdg18.04+1] (204.pgdg18.04+1 PostgreSQL for Debian/Ubuntu repository:bionic-pgdg [all]) []
Inst postgresql-client-common [199.pgdg18.04+1] (204.pgdg18.04+1 PostgreSQL for Debian/Ubuntu repository:bionic-pgdg [all]) []
Inst libpq5 [11.2-1.pgdg18.04+1] (11.5-1.pgdg18.04+1 PostgreSQL for Debian/Ubuntu repository:bionic-pgdg [amd64])
Inst postgresql-contrib-9.6 [9.6.12-1.pgdg18.04+1] (9.6.15-1.pgdg18.04+1 PostgreSQL for Debian/Ubuntu repository:bionic-pgdg [amd64]) []
Inst postgresql-client-9.6 [9.6.12-1.pgdg18.04+1] (9.6.15-1.pgdg18.04+1 PostgreSQL for Debian/Ubuntu repository:bionic-pgdg [amd64]) []
Inst postgresql-9.6 [9.6.12-1.pgdg18.04+1] (9.6.15-1.pgdg18.04+1 PostgreSQL for Debian/Ubuntu repository:bionic-pgdg [amd64])
Conf postgresql-common (204.pgdg18.04+1 PostgreSQL for Debian/Ubuntu repository:bionic-pgdg [all])
Conf postgresql-client-common (204.pgdg18.04+1 PostgreSQL for Debian/Ubuntu repository:bionic-pgdg [all])
Conf libpq5 (11.5-1.pgdg18.04+1 PostgreSQL for Debian/Ubuntu repository:bionic-pgdg [amd64])
Conf postgresql-contrib-9.6 (9.6.15-1.pgdg18.04+1 PostgreSQL for Debian/Ubuntu repository:bionic-pgdg [amd64])
Conf postgresql-client-9.6 (9.6.15-1.pgdg18.04+1 PostgreSQL for Debian/Ubuntu repository:bionic-pgdg [amd64])
Conf postgresql-9.6 (9.6.15-1.pgdg18.04+1 PostgreSQL for Debian/Ubuntu repository:bionic-pgdg [amd64])

storcli: "BBU Status" field not available in HPE MegaRID controller

We have a HPE MR416i-a Gen10+ RAID controller in a HPE ProLiant DL385 Gen10+ Server.

Those systems don't have a Battery Backup Unit on the RAID controller, instead they have a backup battery in the system (Energy pack aka HPE Smart Storage Battery).

storcli.py stops collecting metrics when it does not find the "BBU Status" field. storcli on those servers receives following status data:

                "Status" : {
                        "Controller Status" : "Optimal",
                        "Memory Correctable Errors" : 0,
                        "Memory Uncorrectable Errors" : 0,
                        "ECC Bucket Count" : 0,
                        "Any Offline VD Cache Preserved" : "No",
                        "Energy Pack Status" : 0,
                        "PD Firmware Download in progress" : "No",
                        "Support Drive Firmware Download" : "Yes",
                        "Lock Key Assigned" : "No",
                        "Failed to get lock key on bootup" : "No",
                        "Lock key has not been backed up" : "No",
                        "Bios was not detected during boot" : "No",
                        "Controller must be rebooted to complete security operation" : "No",
                        "A rollback operation is in progress" : "No",
                        "At least one PFK exists in NVRAM" : "No",
                        "SSC Policy is WB" : "No",
                        "Controller has booted into safe mode" : "No",
                        "Controller shutdown required" : "No",
                        "Controller has booted into certificate provision mode" : "No",
                        "Current Personality" : "RAID-Mode "
                },

If I skip the BBU Status field, storcli.py runs without errors. In the output it looks like "Energy Pack Status" is a replacement for "BBU Status" although I don't find official documentation what status values are possible and what they mean.

I'm currently preparing a pull request with a simple fix (skip BBU Status if it does not exist) and will link it here when it's submitted.

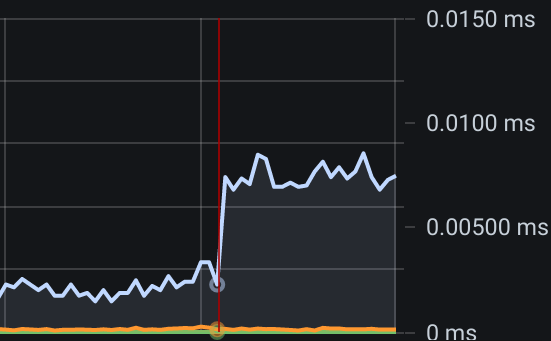
smartmon.py increases IO time

Smartmon.py seems to add to the overall IO time measurements. It can't be the script executing, right? So perhaps it is the smartctl call itself.

return subprocess.run(
['smartctl', *args], stdout=subprocess.PIPE, check=check
).stdout.decode('utf-8')

I've tried this out on an idle machine. The red line is where I added this collector:

image

sum by (instance) (irate(node_disk_io_time_seconds_total[5m]))

How come smartctl adds disk IO?

Script for Wireguard interface metrics

Motivation

Im using wireguard as a vpn on my server and would like to be able to easily load at least basic metrics for it into prometheus.

Proposition

I would like to add a new script that exports metrics regarding wireguard interface metrics. This should be possible by using the wg show all dump command to get the Data to export some information about it

apt_info.py, security updates, rules and dashboards

Hello,

with the script apt_info.py replacing apt.sh I'm trying to create the following :

  • grafana dashboard
  • alertmanager PromQL rules
    that would allow me to list the
  • total packages to upgrade "regular" (0 for each host if none)
  • number of "security" packages to upgrade (0 for each host if none), (and send alerts if some are to be upgraded)

I found a suggested PromQL by @dswarbrick (here)
but with sum by(job) (apt_upgrades_pending{origin=~".*Security.*"}) or vector(0) the result is {} 0 (only once, as a global result) when there are no match / no security upgrades on any instance:

image

  • Is it possible to still have a vector with 0 for each original value of apt_upgrades_pending instead without modifying apt_info.py to export it explicitly ?

  • side question : are there a set of alertmanager rules and grafana dashboards available somewhere to be used along the textfile-collector scripts in this repo ? Or is it possible to generate something just from the HELP and TYPE messages ?

Thanks in advance for your help !

Issue with smartmon data

After installing node_exporter I see following error in the logs:

May 16 23:49:35 odroidn2 prometheus-node-exporter[96276]: level=error ts=2021-05-16T21:49:35.076Z caller=textfile.go:209 collector=textfile msg="failed to collect textfile data" file=smartmon.prom err="failed to parse textfile data from \"/var/lib/prometheus/node-exporter/smartmon.prom\": text format parsing error in line 6: expected float as value, got \"0,000000e+00\""

Line 6 in the file contains following:

smartmon_current_pending_sector_raw_value{disk="/dev/sda",type="sat",smart_id="197"} 0,000000e+00

I have following locale set:

LC_MESSAGES=en_US.UTF-8
LANG=pl_PL.UTF-8

This is an armbian (debian based) installation.

Failed to read textfile collector directory

Hi

I have a kubernetes cluster running in Amazon EKS, we are using the prometheus node-exporter docker image and running it as daemonset across all k8s nodes to fetch the node metrics. We had a use case to monitor the docker volumes usage on each node, I have written a shell script to fetch the data in the prometheus readable format

#! /bin/bash
hostip=$(curl -fs http://169.254.169.254/latest/meta-data/local-ipv4)

voulume_size=`df -Ph /var/lib/docker | awk '{if(NR>1)print $2}' | sed 's/G//g'`
voulume_usage=`df -Ph /var/lib/docker | awk '{if(NR>1)print $5}' | sed 's/%//g'`

`mkdir -p /home/ec2-user/node_exporter/textfile_collector`
`rm -f /home/ec2-user/node_exporter/textfile_collector/docker_volume.prom`

echo "# HELP _docker_volume_usage hostip usage." >> /home/ec2-user/node_exporter/textfile_collector/docker_volume.prom 2>&1
echo "# TYPE _docker_volume_usage gauge" >> /home/ec2-user/node_exporter/textfile_collector/docker_volume.prom 2>&1

echo "_docker_volume_usage{hostip=\"$hostip\",host=\"`hostname`\"} $voulume_usage" >> /home/ec2-user/node_exporter/textfile_collector/docker_volume.prom 2>&1


echo "# HELP _docker_volume_size hostip size." >> /home/ec2-user/node_exporter/textfile_collector/docker_volume.prom 2>&1
echo "# TYPE _docker_volume_size gauge" >> /home/ec2-user/node_exporter/textfile_collector/docker_volume.prom 2>&1

echo "_docker_volume_size{hostip=\"$hostip\",host=\"`hostname`\"} $voulume_size" >> /home/ec2-user/node_exporter/textfile_collector/docker_volume.prom 2>&1

I'm running the script on each node and adding the data to
/home/ec2-user/node_exporter/textfile_collector/docker_volume.prom file.

On the docker logs I see the below ERROR:

level=error ts=2021-01-21T08:44:45.125Z caller=textfile.go:197 collector=textfile msg="failed to read textfile collector directory" path=/home/ec2-user/node_exporter/textfile_collector err="open /home/ec2-user/node_exporter/textfile_collector: no such file or directory"

Let me know where am I going wrong, I now had a doubt that whether the textfile-collector from the docker container colect data from the node in which the container is running!

Any help over here would be appreciated.
Thanks,
Rohith Vallabhaneni.

Don't maintain two smartmon scripts

I'm confused by the current state that this repo maintains two smartmon scripts (one shell, one pythons script).
I'd like to propose to decide on one that should be maintained, and remove/deprecate the other, to bundle the efforts and also not confuse users (which one should I use ? what are the differences ?). Or at least indicate very clearly which one is/will get deprecated.
Debian packages (still) use the shell script by default. The last commit to the shell script was 2 years ago, the last commit for the python script 1 year ago.

smartmon collector missing node info

Hello,

Using the smartmon collector (bash version), I noticed that a quite important info is missing for me: the node name.

Indeed, I have about 30 disks in like 10 nodes, a couple of them being identical, and all called of course "/dev/sda" etc.
How can I know which node contains specific disk "/dev/sda" when there are multiple ones ?

Wouldn't adding hostname / nodename to all smart metrics be good ?

Best regards.

Recommend Projects

  • React photo React

    A declarative, efficient, and flexible JavaScript library for building user interfaces.

  • Vue.js photo Vue.js

    ๐Ÿ–– Vue.js is a progressive, incrementally-adoptable JavaScript framework for building UI on the web.

  • Typescript photo Typescript

    TypeScript is a superset of JavaScript that compiles to clean JavaScript output.

  • TensorFlow photo TensorFlow

    An Open Source Machine Learning Framework for Everyone

  • Django photo Django

    The Web framework for perfectionists with deadlines.

  • D3 photo D3

    Bring data to life with SVG, Canvas and HTML. ๐Ÿ“Š๐Ÿ“ˆ๐ŸŽ‰

Recommend Topics

  • javascript

    JavaScript (JS) is a lightweight interpreted programming language with first-class functions.

  • web

    Some thing interesting about web. New door for the world.

  • server

    A server is a program made to process requests and deliver data to clients.

  • Machine learning

    Machine learning is a way of modeling and interpreting data that allows a piece of software to respond intelligently.

  • Game

    Some thing interesting about game, make everyone happy.

Recommend Org

  • Facebook photo Facebook

    We are working to build community through open source technology. NB: members must have two-factor auth.

  • Microsoft photo Microsoft

    Open source projects and samples from Microsoft.

  • Google photo Google

    Google โค๏ธ Open Source for everyone.

  • D3 photo D3

    Data-Driven Documents codes.