pslmodels / c-tam Goto Github PK
View Code? Open in Web Editor NEWThis repository provides code scripts and description for CPS Transfer Augmentation Model (C-TAM). This is an Open Source Model.
This repository provides code scripts and description for CPS Transfer Augmentation Model (C-TAM). This is an Open Source Model.


CBO includes CHIP in their definition of "income after taxes and transfers," per https://www.cbo.gov/system/files/115th-congress-2017-2018/workingpaper/53345-workingpaper.pdf.
The ASEC logs this as the PCHIP variable, per https://www.census.gov/topics/health/health-insurance/guidance/cps-asec.html.
CBO lumps in CHIP with Medicaid for their underreporting correction: https://www.cbo.gov/system/files?file=2018-07/54234-workingpaper.pdf

Seems like it'd be useful for bounding UI imputations based on state: https://github.com/ganong-noel/ui_calculator
@Amy-Xu, There is a Tax-Calculator issue about adding benefit reduction rates, but I can't seem to find any information about those estimates in the C-TAM repository. So, for example, where are the benefit reduction rates estimated for the SNAP program or for veterans' benefits?
print list(train_x[maxes].columns.values) is throwing out an error in Rf_probs.py which is a part of WC and UC. So far it seems all results can be generated properly when commenting out this line.Rf_prob.ipynb in PR #54 because they don't exist in the first place.Along the line:
The Stanford Center on Poverty & Inequality produces a California Poverty Measure, which does some tasks also done in C-TAM. Here are relevant sections of their methodology, for comparison to C-TAM and in case there's value in reaching out to them. Note that ACS is their base dataset.
We assign eligibility for SNAP at the simulated program unit-level based on income less than 175% of FPL for SNAP and 125% of FPL for TANF. We take self-reported participation as given and randomly assign participation to other income-eligible units within county-race-household size cells to match administrative totals [...] we predict the probability of participation for each eligible non-reporting unit in the ACS. We then order the data based on the predicted probability within the county-race-composition cell, and assign SNAP or TANF participation to enough units until we match administrative totals.

Max note: In a previous version they assigned eligible units randomly within cells to meet targets.
We thus impute housing subsidy receipt by first developing a linear regression model predicting subsidy receipt in 3-year California CPS data, Technical Appendices 12 then applying the regression coefficients to the pool of renter household heads in our ACS data. We assign housing subsidy receipt to household heads identified as having the highest probability of subsidy receipt until we match the percentage of renters reporting subsidies in the CPS data. We disallow receipt for households where all individuals are identified as likely unauthorized immigrants. We then estimate the value of the imputed subsidy as equal to the county-specific Fair Market Rent for the housing unit size, less the tenant payment, estimated at 30 percent of household income. The housing subsidy amount plus the tenant payment is capped at the value of the shelter portion of the poverty threshold, following Census SPM procedures.
We compute eligibility using age of child (age 0-5 in the data, which covers the 12 months prior to the survey month). Women ages 16-44 who meet other criteria are deemed eligible, as are women who have infants (age 0-1 in the data). Income eligibility is defined as family income less than 1.33 times the eligibility ceiling (185 percent of FPL). All those who report Medicaid, or who are foster children, or who are imputed to get SNAP or TANF benefits are also deemed income eligible. We then randomly assign receipt to match administrative totals for women, infants, and children served by county. Months on WIC are also assigned randomly, assuming that a constant share of infants and children will age into and out of eligibility throughout the year, and that a constant proportion of women will become pregnant throughout the year. Monthly benefit amounts are based on Vericker and Zhen (2013).
They also impute school lunch programs and medical out of pocket expenses, and form tax units from ACS data based partly on strategically maximizing EITC.
Just wanted a place to share this study: "Errors in Survey Reporting and Imputation and their Effects on Estimates of Food Stamp Program Participation"
https://www.nber.org/papers/w25143
The Pandas developers seem to be planning to quit supporting Python 2.7 at the end of 2018 as described here. In the coming months the Tax-Calculator developers would like to transition Tax-Calculator to be a Python 3.6+ project.
Will this project find it acceptable to have access to only Python 3.6 taxcalc packages?
As we have add a full-documentation link in ReadMe section for Benefit Repo (and soon this document will be added to the Repo once ready), the content in most documentation in each program folder (SNAP, SSI, SS, VB) become quite repetitive. Important assumptions, regression equations, and result tables have already been included in the full version, and will be updated with any PR changing the source code. Having a duplicate version in each program folder will be increasingly confusing and adds difficulty to maintenance.
I think it would be the best to simplify each program's documentation to a markdown file (folder level README.md), including only admin data source link and more detailed execution notes that are not a part of C-TAM documentation. I see at least two advantage. First, there's no need to keep a separate editable version if we're not using PDFs anymore. In other words, any contributor can update without asking permission to a google doc. Second, no need to worry about update regression in one place and forget the other. What do you think? @MattHJensen @andersonfrailey
The SNAP README states:
Households are then ranked by the probability of participation, and, for each state's subgroup, their weights are summed until they reach the administrative level.
This approach would work well if the regression models have good fit, i.e. probabilities are either close to 0 or close to 1. But if probabilities are fuzzier, this approach could overstate the correlation between predictors and participation.
As a simple example, suppose P(SNAP) = max(1 - (income / 50000), 0). A ranking approach might assign participation to everyone with income below $25k, but this would overestimate participation among those with income ~$24k and underestimate it among those around $26k, and in general would overstate the correlation between income and participation.
An alternative is to assign participation randomly depending on predicted probabilities. So if the predicted probabilities align with the administrative total (sum(prob) = participation), you assign if their probability exceeds a U(0,1) random number. This would preserve the fuzziness and avoid excessive correlation.
This gets a bit more complicated when the administrative total doesn't equal the sum of probabilities, which it probably won't, but numpy.random.choice can be used here. For example, suppose there are three filers with predicted SNAP participation probabilities of 10%, 50%, and 80%, and the administrative target is two participants. This function will select two filers using the appropriate probability (notebook):
from numpy.random import choice

def weighted_sample(ids, prob_participate, participation_target):
    return choice(ids, p=prob_participate / prob_participate.sum(),
                  size=participation_target,replace=False)
For example:
import numpy as np

ids = np.array([1, 2, 3])
prob_participate = np.array([0.1, 0.5, 0.8])
participation_target = 2

weighted_sample(ids, prob_participate, participation_target)
# array([2, 3])
[2, 3] is the most likely outcome, but 1 will also be selected some of the time since it has nonzero probability. Under the ranking system it might never get assigned participation.
PDFs can be viewed directly on github, while word documents cannot. As most of our documentations have formulas or tables, which makes mark down quite difficult to do, we cannot do pure text for docs. So as a temporary solution, we want to keep editable version in google drive, and PDFs for display on github. The google drive is shared among all contributors. Currently there're three documents that need to be converted.
Social Security Augmentation documentation: somehow there're two copies in the augmentation folder and both are docx. We want to keep only one version, and make it PDF.
Same for Social Security MTR documentation. Need to convert it to PDF.
@parkerrogers Parker, could you take care of this issue when you get a chance? Thanks!
Some users who want to assess the distributional consequences of repealing and replacing welfare and transfer programs might want to assume that a dollar of spending on the program does not equal a dollar of value to the recipient.
The classic case involves non-cash transfers. For example, Finkelstein, Hendren, and Luttmer find that, "Medicaid's welfare benefits to recipients per dollar of government spending range[s] from $0.2 to $0.4"
In order to accomodate budgetary analysis, we have been grossing up the amount of benefits received to hit federal spending aggregates. For the sake of distributional analysis, I propose adding a knob for each program that allows the user to discount the value of the benefits.
One might suggest only having knobs for non-cash benefits, but the welfare benefits of cash transfers could also fall below the amount of cash transfer received. This would happen if the program required required significant paperwork or distorted behavior across dimensions other than labor supply, which we will capture separately.
Therefore, I think we should have such a knob for every program.
Upsides are that
Are there downsides?
There has been recent discussion of how best to impute to filing units a Medicare benefit amount and a Medicaid benefit amount. Most of this discussion has taken place in C-TAM issue #68, C-TAM pull request #70, and taxdata pull request 185. One issue in those discussions has been whether it makes sense to impute different actuarial values (not "insurance values") for Medicare (Medicaid) depending on the Medicare (Medicaid) enrollee's income.
Thinking about how to do the imputations is essentially a benefit/cost analysis of two approaches. There is a simple approach that assigns each enrollee the same actuarial value. Others want to assign different values that vary by income (see the use of 16 income subgroups in taxdata pull request 185). But the focus on income subgroups seems too narrow. For example, the government's cost of providing Medicare seems likely to vary more by age subgroup than by income subgroup. So, a sensible more complicated approach would include more subgroups than just income. Of course, that complicates the imputation process and thus increases the cost of the complicated approach.
A potential cost of the simple approach could be the fact that CBO used something like the complicated approach. I've said in the earlier discussion that as far as I understood, CBO follows the simple approach to assigning a benefit amount to each enrollee. But I didn't supply any documentation to support that view. A couple of minutes of Google searching produced this September 2017 CBO slide presentation by Kevin Perese and Bilal Habib entitled Methodological Improvements for CBO’s Analysis of the Distribution of Household Income.
In that CBO presentation, the authors describe how CPS under-reporting of the receipt of benefits is corrected using a regression approach (see the Medicaid participation discussion on slides 43-48). But then slide 55 says each Medicaid participant is assigned the same benefit amount:
For Medicaid, CBO derives the average cost to the government per recipient from administrative data (by eligibility category). Those averages are then assigned to all recipients (CPS “reported” values are overwritten).
The phrase "by eligibility category" likely refers to subprogram distinctions made in both the CPS and in aggregate administrative data (for example, the actuarial cost of providing CHIP benefits is likely to differ from the actuarial cost of providing Medicaid benefits to those who qualify for Medicare by virtual of being an SSI beneficiary). But it is clear that within each Medicaid subprogram all the enrollees are assigned the same actuarial value as their benefit amount.
And then on slide 66 there is this description of assigning Medicare benefit amounts (emphasis added):
To impute Medicare benefits, CBO makes no change to [CPS] reported recipients. CBO assigns the average cost to the government per participant to all recipients. Benefits from the Low-Income Subsidy for Medicare Prescription Drug Coverage are allocated separately.
Notice again the Medicare subprograms can have different actuarial values, but there is no income or age variation in the imputed Medicare benefit.
In conclusion, it seems to me that the simple approach has a much higher net benefit than does the complicated approach. This is mainly because the complicated approach takes a lot of extra work that CBO is not doing. What do the rest of you think?
Moving PSLmodels/taxdata#153 here: are benefits in taxcalc's new CPS data intended to be the value of the benefit received, or its effective cost by including administrative overhead?
The C-TAM README says that a 2017 goal is to "Add administrative costs for all welfare programs." The updated documentation linked in #52 also indicates that administrative totals are used as the source of truth for extrapolating benefits, but I haven't read the whole thing so not sure if the benefits intend to include overhead.
If feasible, both with and without administrative costs would be useful, since without gives value and with gives budget for allocating to replacements like UBI.
NSLP has a $13B budget (https://www.cbo.gov/publication/50737), has been analyzed from CPS data (https://www.fns.usda.gov/current-population-survey-analysis-nslp-participation-and-income), and is included in poverty research materials like SPM and CPM (California Poverty Measure, see #78). I couldn't find references to it in the C-TAM documentation. Has adding it to C-TAM been considered, especially given its budget is over double WIC's?
In #68 I showed that vet_ben maxes out at $140k:

@Amy-Xu said that this is likely compensation and pension, per this VA site.
@feenberg then said:
I typed "pension retired general" into Google and learned this:
A three-star officer with 35 years' experience would get about $169,200 a year, up about $39,000, or 30%. The highest pension, $272,892, is paid to a retired four-star officer with 43 years of service, according to the Pentagon.Feb 3, 2012
but before I accepted this explanation I would want to look at the CPS record for evidence the respondent was plausibly a general. That is, high education and older. Also, I would want to know there were not very many such records in the data.
This issue is to pursue this investigation.
The amount and quality of work in the C-TAM repository is very impressive.
I've been looking at the documentation, which includes this text in the Medicaid and Medicare section on page 37 just below Figure 13:
Stage 2: Benefit Adjustment. For both Medicare and Medicaid, we define the insurance value as the average benefit amount by total income quintile, and we augment the insurance value of each enrollee to match total spending for the noninstitutionalized population.
The first step is to match individual information from the MEPS to the CPS using age, gender, state of residence, and income. Both original and imputed CPS enrollees receive an expenditure amount from an MEPS record with the same gender and age (within plus or minus two years), state of residence, and income (within plus or minus $100).
The second step is to rank all participants by their total income (provided by the CPS), average the expenditures by income quintile, and assign average expenditures as the insurance value.
Maybe I don't completely understand the medical insurance benefit imputation procedure being described here, but it strikes me that a small, easy change in the procedure would make the distribution of the imputed benefits much more realistic. We know that medical expenditures vary widely for random reasons, like getting sick and being in the hospital for a long stay. The averaging is smoothing out that variation to get an "insurance value" benefit. But there are some personal attributes, namely age, that do have a strong influence on medical expenditures.
So, why not "average the expenditures by income quintile and age group, and assign average expenditures [by income quintile and age group] as the insurance value"? All the data required to do that is at hand. Have you considered and rejected using age groups?
I requested TRIM3's code from HHS via FOIA on 2019-04-01 (request #2019-00774-FOIA-OS). On 2020-11-21, the request's status was updated to 'In Process'.
@MattHJensen fyi
LIHEAP has a $3.65B 2019 budget (https://liheapch.acf.hhs.gov/Funding/funding.htm). AFAICT, including it (along with NSLP #81 which is more important given the higher budget) would complete C-TAM' set of transfer programs used in materials like SPM/CPM.
This GitHub organization (Open-Source-Economics) is becoming a home for the Policy Simulation Library, and will be renamed PSLmodels on December 3rd. Starting then, I'd like for every project in PSLmodels to either be in PSL or be in the process of joining PSL.
C-TAM is very welcome in PSL! If the project is interested in joining, could you please let me know by Dec 3 and begin (if not finish) conforming to the PSL Criteria? If the project is not interested in joining, I'll help move this repo to a different organization or remove it.
Please let me know how you'd like to proceed -- I'll be keeping an eye on this issue, and I'm also happy to join a call to discuss.
TANF_Administrative.csv totals $9.6B. However, HHS says the budget has been $17.3B for 2016-2018, and the updated C-TAM documentation says:
We augmented CPS TANF total benefits by $25.05 billion, and total participation by 1.81 million to hit the annual total expenditure and participations targets. In 2014, total expenditure on cash and service benefits was $29.35 billion
Offering the footnote:
Office of Family Asssitance, “Fiscal Year 2014 Financial Data,” Total Fed & State Expenditure, https://www.acf.hhs.gov/ofa/resource/tanf-financial-data-fy-2014.
Tax-Calculator CPS records total $8.8B in TANF:
recs = tc.Records.cps_constructor()
print(round((recs.s006 * recs.tanf_ben).sum() / 1e9, 1))
# 8.8
Advancing Tax-Calculator to 2018 yields an even lower TANF total of $7.8B.
Are these numbers intended to be so low? What's the source of TANF_Administrative.csv?
The benefit database created from the 2016 CPS should be a better fit for the 2016 CPS tax-unit dataset. Currently all the administrative targets are for 2015 CPS, roughly the expenditure in 2014. In this issue I will be updating the progress of finding 2015 administrative targets. Meanwhile, I'll think about how to organize the scripts and targets in a more efficient way. Appreciate any suggestions.
This isn't so much an issue as a heads up of relevant comparisons for the poorest households, which are notoriously difficult to measure. I did some analysis on tax units with incomes under $5/day, comparing to other sources mentioned in this Brookings paper (worth a read in full, as it's relevant to C-TAM). Here's one chart from the notebook:

There's more context on this in the notebook, but to summarize:
Context is that I'm researching replacing the CTC with a universal child benefit, and the huge gains for the bottom 5%--given their low current incomes--motivated this investigation. All analysis excludes tax units with negative current after-tax income.
To the extent this is an issue, it may just be worth considering calibrating results against these surveys, or keeping track of research around the poorest households until that becomes more valuable.
@andersonfrailey shared with me a UBI analysis he's been working on, which included modeling the labor response to MTRs including from benefits. I was surprised to see this chart in it showing that Social Security's MTR is negative:
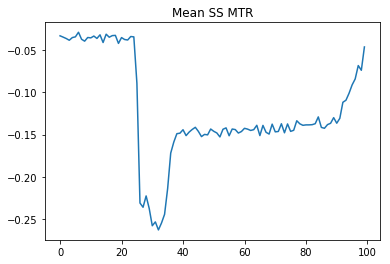
@andersonfrailey explained that this has to do with earnings adding more benefits down the line, i.e. this is partially a compensating MTR to the payroll tax if it's considered a savings vehicle.
I'm curious if the Social Security MTR also incorporates income limits and phase-outs on benefits received:
The maximum benefit amount per person is $455k for Medicaid and $692k for Medicare (notebook). These are somewhat outliers but multiple percent have benefit values in excess of $20k.

Is this expected? Reading through the updated C-TAM documentation I wonder if this has to do with using the Medical Expenditure Panel Survey, where some slices might have high medical expenditure. But is using per-person expenditures an appropriate estimate of the value? In lieu of these programs most people would pay for health insurance, not bear the treatment costs themselves.
cc @Amy-Xu
The pdf entitled VB_imputation_report.pdf contains the following:

I have a couple of questions.
First, am I correct in assuming that the phrases "88 billion benefits" and "Medical care benefits are 59 billion in total" refer to dollars spent by the US government to provide these benefits?
And second, what are the "Medical care benefits"? Is the $59 billion the cost of running the VA Hospital system? Can you explain what's included in the $59 billion total?
Is there an estimate available? I didn't see it in the new documentation from #52.
Related:
other_ben in PSLmodels/taxdata#148 (reported by @andersonfrailey)The CPS includes a citizenship indicator PRCITSHP that identifies individuals in terms of whether they are foreign-born and whether they are citizens.

The citizens and non-citizens sum up to 322.78 millions in 2015 CPS. Looking at the overall income distribution by citizenship, I don't see anything alarming yet.
Number of people in each income class, in millions

Of course we could go ahead attach this variable to the output dataset, but there are two potential caveats. The first is about the accuracy with regard to low-income population. There is a report suggesting SIPP is probably more accurate, but imputing from SIPP could potentially induce noises. The second is about how to assign citizenship for mixed households. Eventually we need the tax unit level data, should we just go with the status of the head of household?
@MattHJensen @feenberg @martinholmer @andersonfrailey @MaxGhenis
print(round((recs.s006 * recs.housing_ben).sum() / 1e9, 1))
# 2.1
Advancing to 2018 yields $2.4B.
I couldn't find the explicit targets here, but this is substantially lower than the various totals described in the Housing README:
In Fiscal Year 2014, according to Picture of Subsidized Households around 4.5 million families claimed roughly 36 billion dollars in federal housing assistance benefits (for all programs combined). More specifically, approximately 2.1 million families claimed roughly 16 billion dollars in HCV benefits, approximately 1.2 million families claimed roughly 10 million dollars [Max Ghenis: should this and others below be "billion"?] in PBRA benefits (without smaller programs), while approximately 1 million families lived in public housing which subsidized approximately 5.8 million dollars of rent. The remaining participants and outlays come from the smaller programs listed above.
Correspondingly, 2014 CPS totals indicate that around 6 million families claimed roughly 16.2 billion dollars in federal housing assistance benefits (all programs combined). In our documentation we explain the cause of recipient overreporting, and benefit underreporting.
Just created a branch for all current versions of documentation: https://github.com/open-source-economics/Benefits/tree/docbranch/SSI/MTR
We need to replace the current version with a more simplified version that describes 1) what method was used, and 2) what was the results. If other contributors ever want to contribute to this portion of Basic Income project, documentation work can be added easily.
Thanks @parkerrogers
For example it mentions intermediate goals for 2017.
https://github.com/open-source-economics/C-TAM/blob/master/README.md
A declarative, efficient, and flexible JavaScript library for building user interfaces.
🖖 Vue.js is a progressive, incrementally-adoptable JavaScript framework for building UI on the web.
TypeScript is a superset of JavaScript that compiles to clean JavaScript output.
An Open Source Machine Learning Framework for Everyone
The Web framework for perfectionists with deadlines.
A PHP framework for web artisans
Bring data to life with SVG, Canvas and HTML. 📊📈🎉
JavaScript (JS) is a lightweight interpreted programming language with first-class functions.
Some thing interesting about web. New door for the world.
A server is a program made to process requests and deliver data to clients.
Machine learning is a way of modeling and interpreting data that allows a piece of software to respond intelligently.
Some thing interesting about visualization, use data art
Some thing interesting about game, make everyone happy.
We are working to build community through open source technology. NB: members must have two-factor auth.
Open source projects and samples from Microsoft.
Google ❤️ Open Source for everyone.
Alibaba Open Source for everyone
Data-Driven Documents codes.
China tencent open source team.