GithubHelp home page GithubHelp logo

psotomayor / ordpy Goto Github PK

View Code? Open in Web Editor NEW

This project forked from arthurpessa/ordpy

0.0 0.0 0.0 125.52 MB

A Python package for data analysis with permutation entropy and ordinal network methods.

License: MIT License

Python 100.00%

ordpy's Introduction

logo1 logo2 logo3 Documentation Status

ordpy: A Python Package for Data Analysis with Permutation Entropy and Ordinal Network Methods

ordpy is a pure Python module [1] that implements data analysis methods based on Bandt and Pompe's [2] symbolic encoding scheme.

If you have used ordpy in a scientific publication, we would appreciate citations to the following reference [1]:

@article{pessa2021ordpy,
 title         = {ordpy: A Python package for data analysis with permutation entropy and ordinal network methods},
 author        = {Arthur A. B. Pessa and Haroldo V. Ribeiro},
 journal       = {Chaos: An Interdisciplinary Journal of Nonlinear Science},
 volume        = {31},
 number        = {6},
 pages         = {063110},
 year          = {2021},
 doi           = {10.1063/5.0049901},
}

ordpy implements the following data analysis methods:

Released on version 1.0 (February 2021):

  • Permutation entropy for time series [2] and images [3];
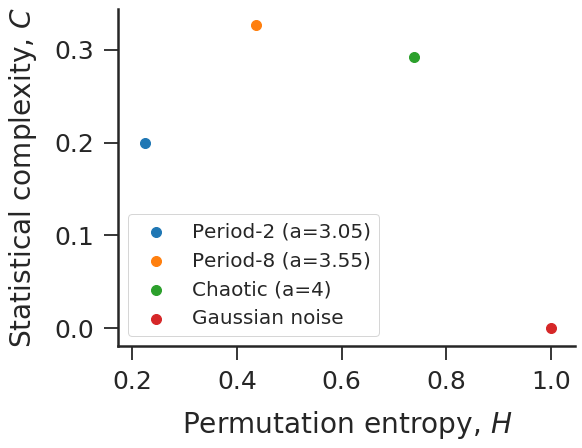
  • Complexity-entropy plane for time series [4], [5] and images [3];
  • Multiscale complexity-entropy plane for time series [6] and images [7];
  • Tsallis [8] and Rényi [9] generalized complexity-entropy curves for time series and images;
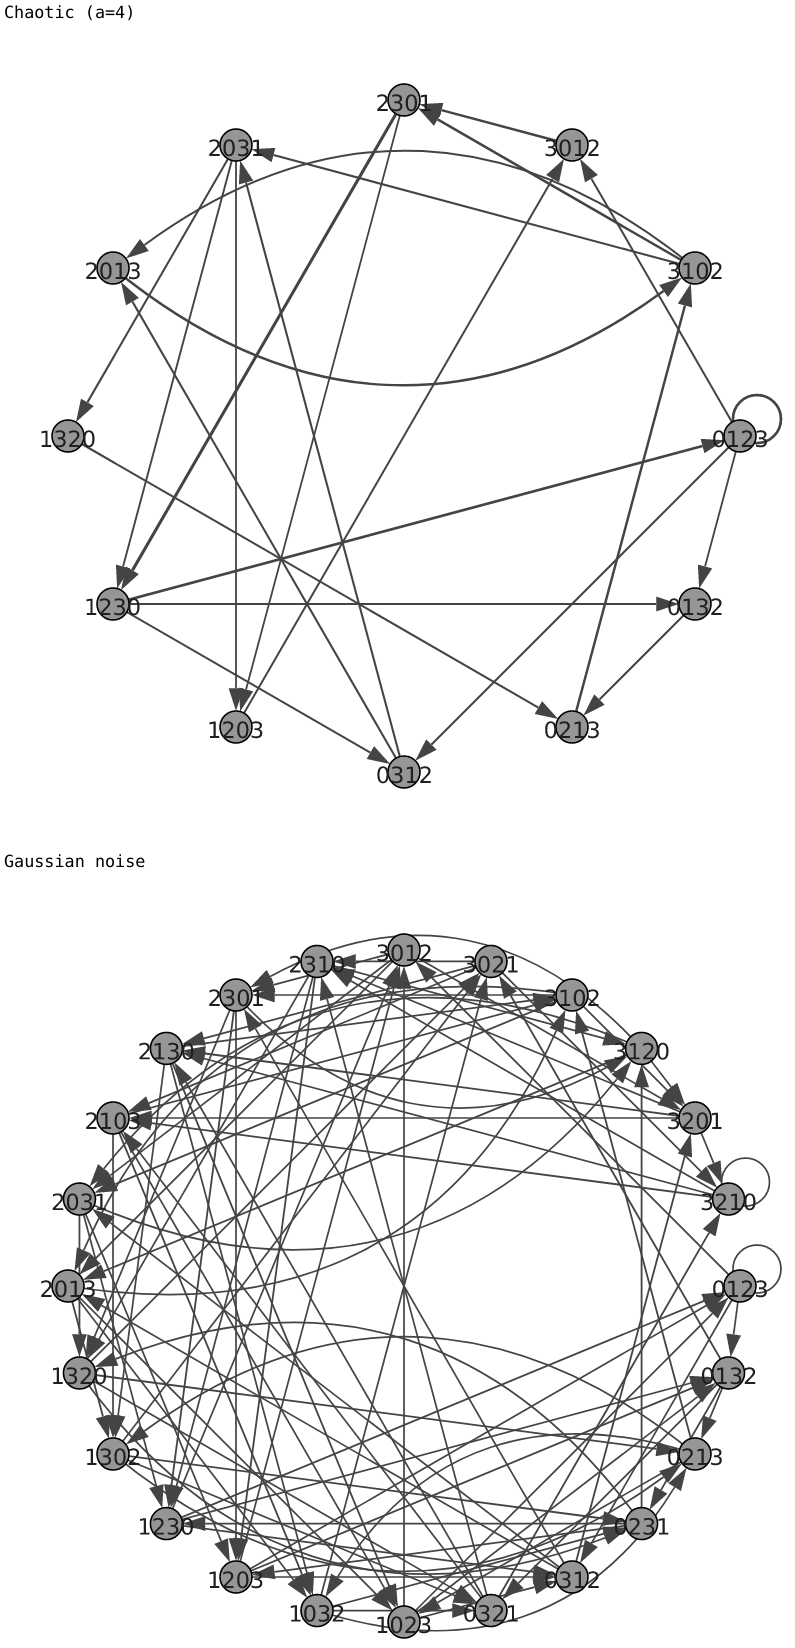
  • Ordinal networks for time series [10], [11] and images [12];
  • Global node entropy of ordinal networks for time series [13], [11] and images [12].
  • Missing ordinal patterns [14] and missing transitions between ordinal patterns [11] for time series and images.

Released on version 1.1.0 (January 2023):

  • Weighted permutation entropy for time series [15] and images;
  • Fisher-Shannon plane for time series [16] and images;
  • Permutation Jensen-Shannon distance for time series [17] and images;
  • Four pattern permutation contrasts (up-down balance, persistence, rotational-asymmetry, and up-down scaling.) for time series [18];
  • Smoothness-structure plane for images [19].

For more detailed information about the methods implemented in ordpy, please consult its documentation.

Installing

Ordpy can be installed via the command line using

pip install ordpy

or you can directly clone its git repository:

git clone https://github.com/arthurpessa/ordpy.git
cd ordpy
pip install -e .

Basic usage

We provide a notebook illustrating how to use ordpy. This notebook reproduces all figures of our article [1]. The code below shows simple applications of ordpy.

#Complexity-entropy plane for logistic map and Gaussian noise.

import numpy as np
import ordpy
from matplotlib import pylab as plt

def logistic(a=4, n=100000, x0=0.4):
    x = np.zeros(n)
    x[0] = x0
    for i in range(n-1):
        x[i+1] = a*x[i]*(1-x[i])
    return(x)

time_series = [logistic(a) for a in [3.05, 3.55, 4]]
time_series += [np.random.normal(size=100000)]

HC = [ordpy.complexity_entropy(series, dx=4) for series in time_series]


f, ax = plt.subplots(figsize=(8.19, 6.3))

for HC_, label_ in zip(HC, ['Period-2 (a=3.05)',
                            'Period-8 (a=3.55)',
                            'Chaotic (a=4)',
                            'Gaussian noise']):
    ax.scatter(*HC_, label=label_, s=100)

ax.set_xlabel('Permutation entropy, $H$')
ax.set_ylabel('Statistical complexity, $C$')

ax.legend()
https://raw.githubusercontent.com/arthurpessa/ordpy/master/examples/figs/sample_fig.png
#Ordinal networks for logistic map and Gaussian noise.

import numpy as np
import igraph
import ordpy
from matplotlib import pylab as plt
from IPython.core.display import display, SVG

def logistic(a=4, n=100000, x0=0.4):
    x = np.zeros(n)
    x[0] = x0
    for i in range(n-1):
        x[i+1] = a*x[i]*(1-x[i])
    return(x)

time_series = [logistic(a=4), np.random.normal(size=100000)]

vertex_list, edge_list, edge_weight_list = list(), list(), list()
for series in time_series:
    v_, e_, w_   = ordpy.ordinal_network(series, dx=4)
    vertex_list += [v_]
    edge_list   += [e_]
    edge_weight_list += [w_]

def create_ig_graph(vertex_list, edge_list, edge_weight):

    G = igraph.Graph(directed=True)

    for v_ in vertex_list:
        G.add_vertex(v_)

    for [in_, out_], weight_ in zip(edge_list, edge_weight):
        G.add_edge(in_, out_, weight=weight_)

    return G

graphs = []

for v_, e_, w_ in zip(vertex_list, edge_list, edge_weight_list):
    graphs += [create_ig_graph(v_, e_, w_)]

def igplot(g):
    f = igraph.plot(g,
                    layout=g.layout_circle(),
                    bbox=(500,500),
                    margin=(40, 40, 40, 40),
                    vertex_label = [s.replace('|','') for s in g.vs['name']],
                    vertex_label_color='#202020',
                    vertex_color='#969696',
                    vertex_size=20,
                    vertex_font_size=6,
                    edge_width=(1 + 8*np.asarray(g.es['weight'])).tolist(),
                   )
    return f

for graph_, label_ in zip(graphs, ['Chaotic (a=4)',
                                   'Gaussian noise']):
    print(label_)
    display(SVG(igplot(graph_)._repr_svg_()))
https://raw.githubusercontent.com/arthurpessa/ordpy/master/examples/figs/sample_net.png

Contributing

Pull requests addressing errors or adding new functionalities are always welcome.

References

[1](1, 2, 3) Pessa, A. A. B., & Ribeiro, H. V. (2021). ordpy: A Python package for data analysis with permutation entropy and ordinal networks methods. Chaos, 31, 063110.
[2](1, 2) Bandt, C., & Pompe, B. (2002). Permutation entropy: A Natural Complexity Measure for Time Series. Physical Review Letters, 88, 174102.
[3](1, 2) Ribeiro, H. V., Zunino, L., Lenzi, E. K., Santoro, P. A., & Mendes, R. S. (2012). Complexity-Entropy Causality Plane as a Complexity Measure for Two-Dimensional Patterns. PLOS ONE, 7, e40689.
[4]Lopez-Ruiz, R., Mancini, H. L., & Calbet, X. (1995). A Statistical Measure of Complexity. Physics Letters A, 209, 321-326.
[5]Rosso, O. A., Larrondo, H. A., Martin, M. T., Plastino, A., & Fuentes, M. A. (2007). Distinguishing Noise from Chaos. Physical Review Letters, 99, 154102.
[6]Zunino, L., Soriano, M. C., & Rosso, O. A. (2012). Distinguishing Chaotic and Stochastic Dynamics from Time Series by Using a Multiscale Symbolic Approach. Physical Review E, 86, 046210.
[7]Zunino, L., & Ribeiro, H. V. (2016). Discriminating Image Textures with the Multiscale Two-Dimensional Complexity-Entropy Causality Plane. Chaos, Solitons & Fractals, 91, 679-688.
[8]Ribeiro, H. V., Jauregui, M., Zunino, L., & Lenzi, E. K. (2017). Characterizing Time Series Via Complexity-Entropy Curves. Physical Review E, 95, 062106.
[9]Jauregui, M., Zunino, L., Lenzi, E. K., Mendes, R. S., & Ribeiro, H. V. (2018). Characterization of Time Series via Rényi Complexity-Entropy Curves. Physica A, 498, 74-85.
[10]Small, M. (2013). Complex Networks From Time Series: Capturing Dynamics. In 2013 IEEE International Symposium on Circuits and Systems (ISCAS2013) (pp. 2509-2512). IEEE.
[11](1, 2, 3) Pessa, A. A. B., & Ribeiro, H. V. (2019). Characterizing Stochastic Time Series With Ordinal Networks. Physical Review E, 100, 042304.
[12](1, 2) Pessa, A. A. B., & Ribeiro, H. V. (2020). Mapping Images Into Ordinal Networks. Physical Review E, 102, 052312.
[13]McCullough, M., Small, M., Iu, H. H. C., & Stemler, T. (2017). Multiscale Ordinal Network Analysis of Human Cardiac Dynamics. Philosophical Transactions of the Royal Society A, 375, 20160292.
[14]Amigó, J. M., Zambrano, S., & Sanjuán, M. A. F. (2007). True and False Forbidden Patterns in Deterministic and Random Dynamics. Europhysics Letters, 79, 50001.
[15]Fadlallah B., Chen, B., Keil A. & Príncipe, J. (2013). Weighted-permutation entropy: a complexity measure for time series incorporating amplitude information. Physical Review E, 97, 022911.
[16]Olivares, F., Plastino, A., & Rosso, O. A. (2012). Contrasting chaos with noise via local versus global information quantifiers. Physics Letters A, 376, 1577–1583.
[17]Zunino L., Olivares, F., Ribeiro H. V. & Rosso, O. A. (2022). Permutation Jensen-Shannon distance: A versatile and fast symbolic tool for complex time-series analysis. Physical Review E, 105, 045310.
[18]Bandt, C. (2023). Statistics and contrasts of order patterns in univariate time series, Chaos, 33, 033124.
[19]Bandt, C., & Wittfeld, K. (2022). Two new parameters for the ordinal analysis of images. arXiv:2212.14643.

Recommend Projects

  • React photo React

    A declarative, efficient, and flexible JavaScript library for building user interfaces.

  • Vue.js photo Vue.js

    🖖 Vue.js is a progressive, incrementally-adoptable JavaScript framework for building UI on the web.

  • Typescript photo Typescript

    TypeScript is a superset of JavaScript that compiles to clean JavaScript output.

  • TensorFlow photo TensorFlow

    An Open Source Machine Learning Framework for Everyone

  • Django photo Django

    The Web framework for perfectionists with deadlines.

  • D3 photo D3

    Bring data to life with SVG, Canvas and HTML. 📊📈🎉

Recommend Topics

  • javascript

    JavaScript (JS) is a lightweight interpreted programming language with first-class functions.

  • web

    Some thing interesting about web. New door for the world.

  • server

    A server is a program made to process requests and deliver data to clients.

  • Machine learning

    Machine learning is a way of modeling and interpreting data that allows a piece of software to respond intelligently.

  • Game

    Some thing interesting about game, make everyone happy.

Recommend Org

  • Facebook photo Facebook

    We are working to build community through open source technology. NB: members must have two-factor auth.

  • Microsoft photo Microsoft

    Open source projects and samples from Microsoft.

  • Google photo Google

    Google ❤️ Open Source for everyone.

  • D3 photo D3

    Data-Driven Documents codes.