GithubHelp home page GithubHelp logo

r03ert0 / microdraw Goto Github PK

View Code? Open in Web Editor NEW
40.0 14.0 41.0 176.27 MB

Collaborative vectorial annotation tool for ultra high resolution data.

Home Page: http://microdraw.pasteur.fr

License: GNU General Public License v3.0

JavaScript 92.67% HTML 0.45% CSS 2.21% Python 0.05% Shell 0.03% Dockerfile 0.13% Mustache 4.47%

microdraw's Introduction

MicroDraw

CI CircleCI Join the chat at https://gitter.im/r03ert0/microdraw

microdraw-vervet

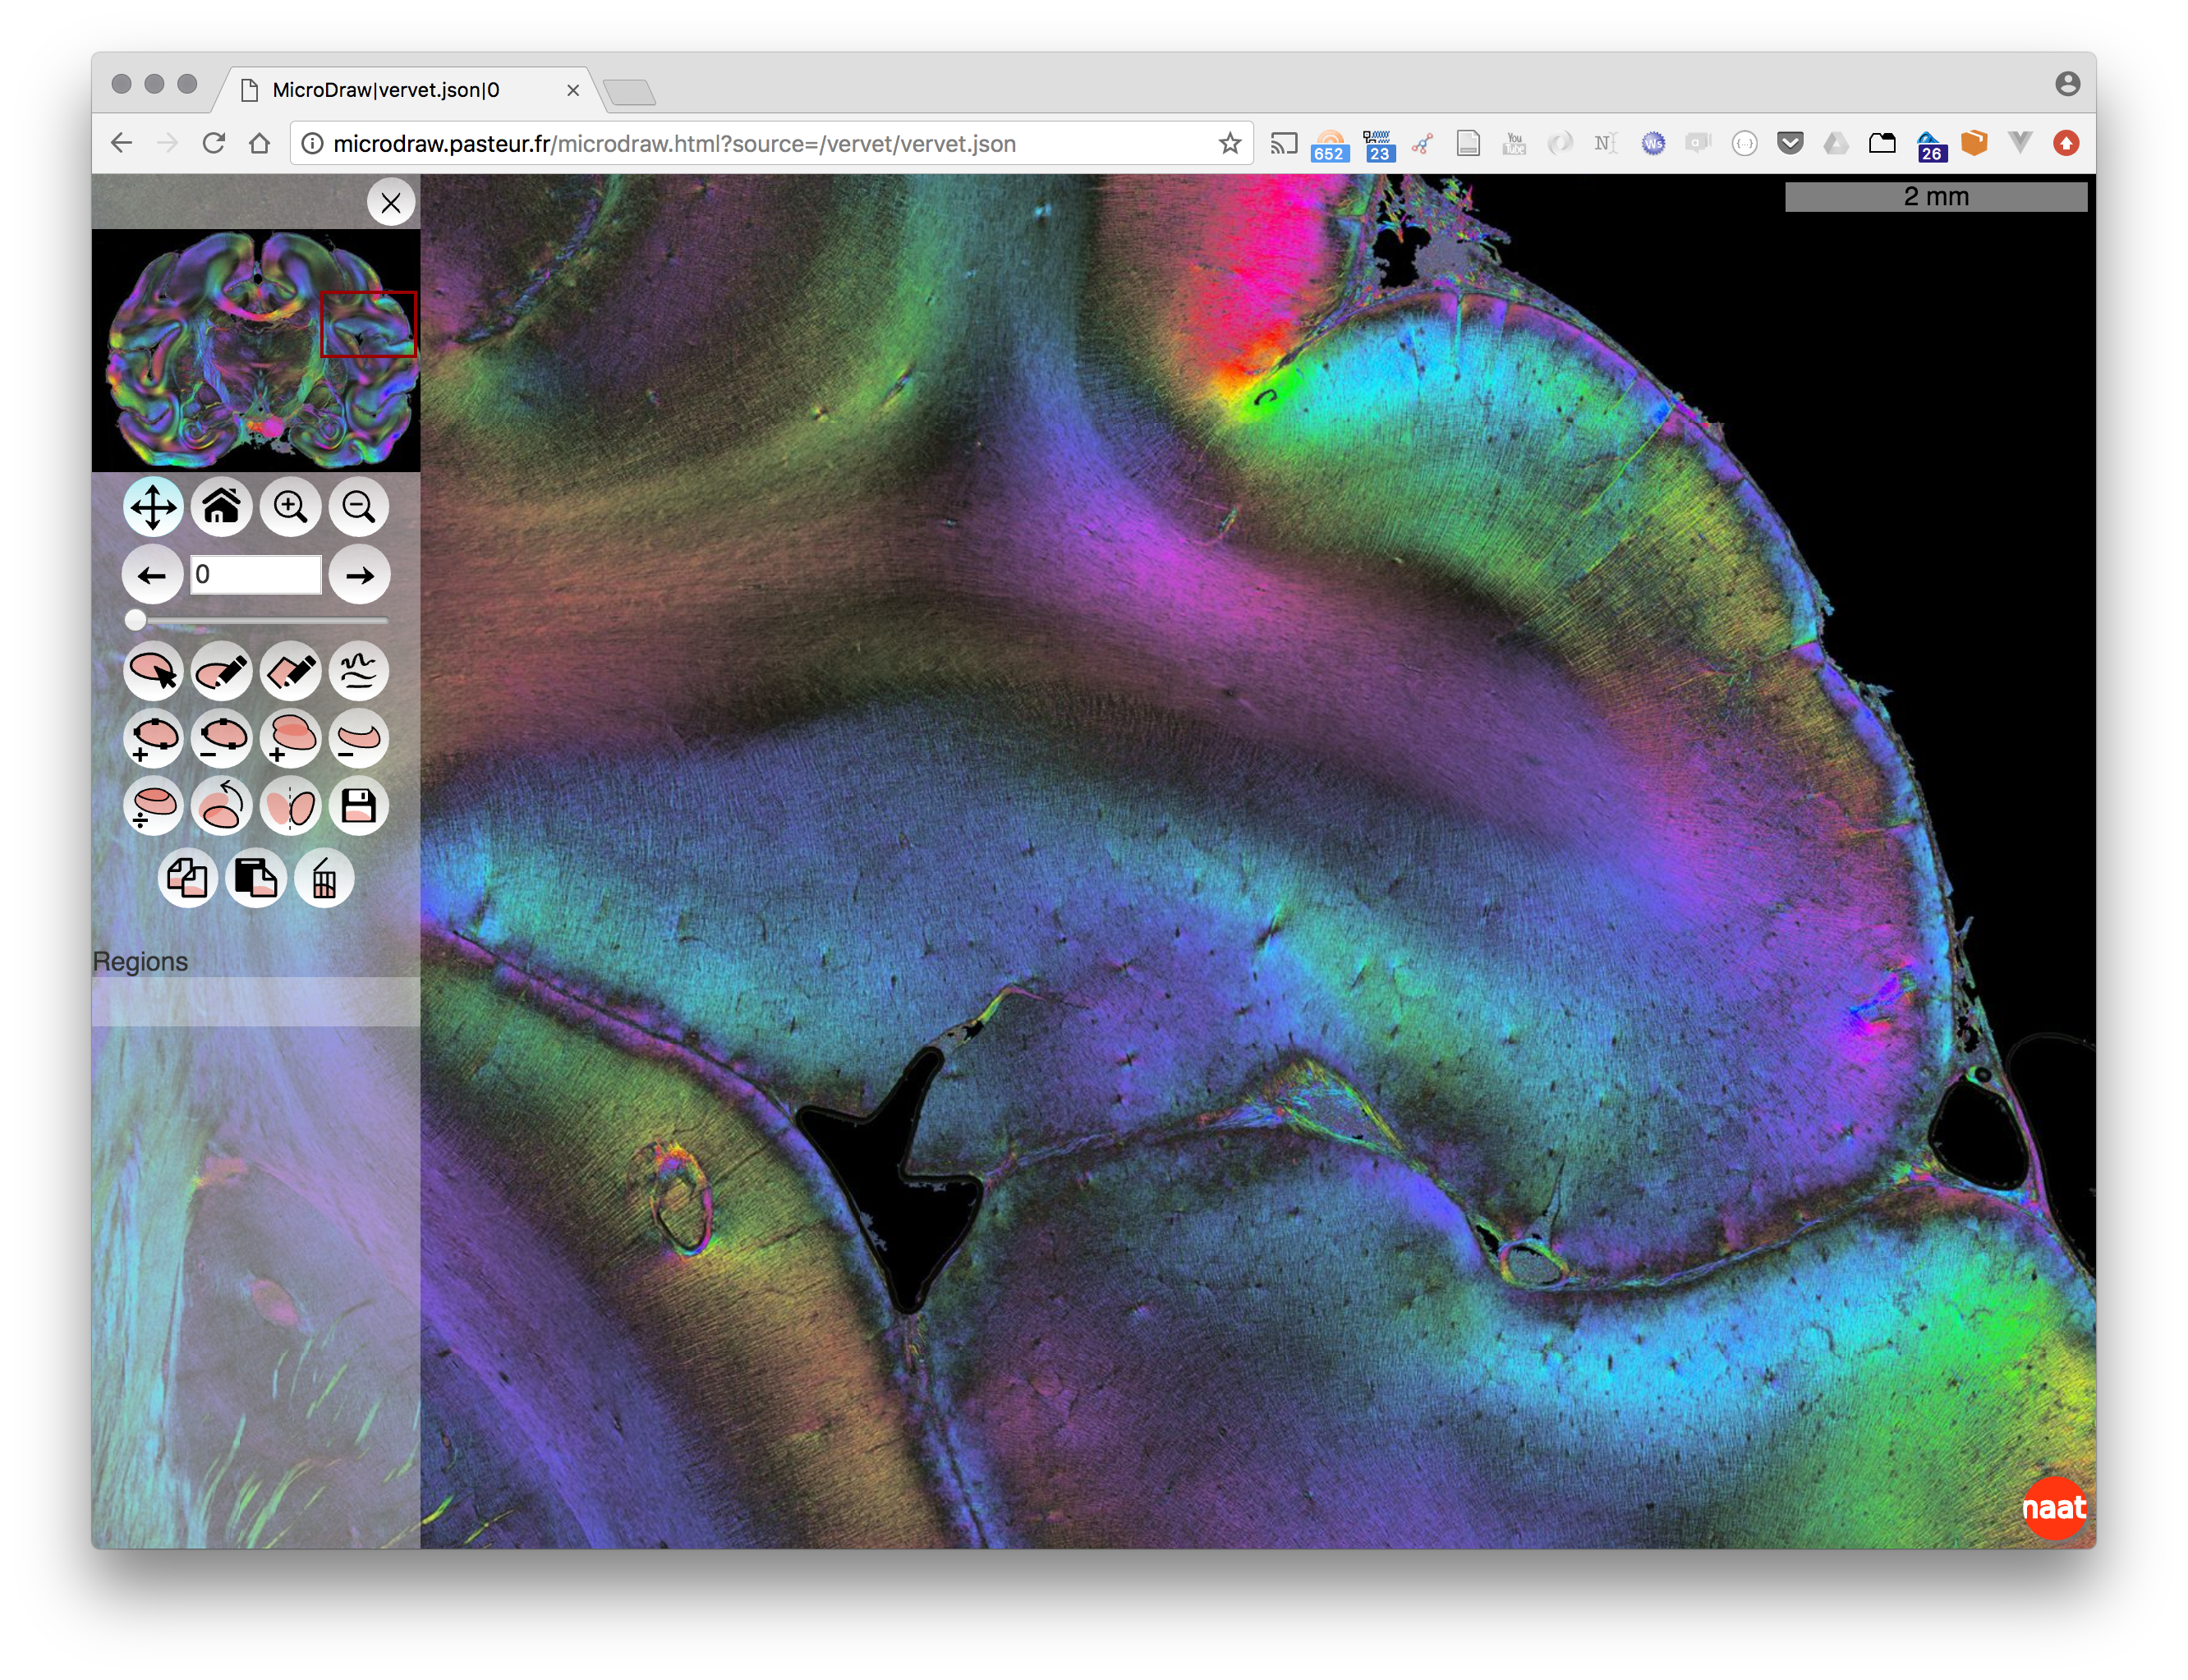
MicroDraw is a collaborative vectorial annotation tool for ultra high resolution data, such as that produced by high-throughput histology.

Data visualisation uses OpenSeadragon, and data annotation uses Paper.js.

Developer install instructions

As of July 2018

Basic Steps

Without docker

  • Install nodejs

  • Install mongo

  • Checkout the repository git clone https://github.com/neuroanatomy/microdraw.git

  • cd microdraw

  • install the project

    • cd into microdraw
    • npm install
    • npm run build-pages
    • drop the .example in cfg.json.example
    • drop the .example in app/auth/github-keys.json.example
    • drop the .example in app/controller/microdrawWebsocketServer/whitelist.json.example
    • drop the .example in app/controller/microdrawWebsocketServer/blacklist.json.example
  • run the project

    • in one terminal window start mongod database and leave it run
    • in another terminal: cd into microdraw folder: npm start
  • open http://localhost:3000 to see MicroDraws landing page and click any of the data links provided

  • test data can be viewed at http://localhost:3000/data?source=/test_data/cat.json

With docker

Users management

Microdraw utilises passportjs to manage user login. By default, Microdraw is configured to use Github and local strageties.

You may also want to set the session secret by setting the environment variable: SESSION_SECRET=MySuperDuperSecret

Enable Github signin strategy

  • Get your Github developer keys for your local microdraw url
  • copy paste client id, client secret and callback URL into ./app/auth/github-keys.json

Enable Local signin strategy

  • Set environment variable: LOCALSIGNIN=true

n.b. it is highly advised to not use local strategies to manage users unless absolutely necessary.

Annotations management

Microdraw uses mongodb to manage the annotations by default. You may choose to use a different solution, by replacing ./app/db/db.js and replace with your own backend.

You can set a custom endpoint for mongodb by setting the environment variable : MONGODB=url-to-mongo:27017/db_name

Programmatic access of annotations

In order to access the user specific annotation, logged in user can visit token endpoint on a logged in browser. This will generate a token, which, when appended as a query param with the key token can be used as proxy to user login.

# get annotations
curl -XGET /api?source=/path/to/file&slice=12&token=FAKE_TOKEN
# save annotation
curl -XPOST /api?source=/path/to/file&slice=12token=FAKE_TOKEN -H "Content-Type: application/json" -d"{\"hello\":\"world\"}"
# save annotation via API
# note that only the files in the `data` field is parsed and saved
curl -XPOST /api?action=save&source=/path/to/file&slice=12token=FAKE_TOKEN -F "data=@/path/to/file.json"
# append annotation via API
# note that only the files in the data field is parsed and appended
curl -XPOST /api?action=append&source=/path/to/file&slice=12token=FAKE_TOKEN -F "data=@/path/to/file.json"

saving strategy

multer is used to handle uploaded file. An optional TMP_DIR environmental variable can be set for the uploaded json file to be saved to disk. If unset, multer is configured to use buffer storage.

The token expires after 24 hours by default (can be changed by setting env TOKEN_DURATION)

Example data.json file

TODO

Saving annotation via file upload

Deploy environments may not allow for fs access. As a result, Microdraw uses memory storage by default. This can lead to OOM. If TMP_DIR env is set, Microdraw will use TMP_DIR to write uploaded file.

Set up your own local data folder

  • cd to /public directory, put yourDataFolder here which must contain
    • a folder with the folders with your data tiles in dzi format
    • the .dzi file containing the information about your data (generated by the converter)
    • a json file containing information about your data in the following form:
    {
      "pixelsPerMeter": 1000000,
      "tileSources": [
        "yourDataFolder/yourData.dzi"
      ]
    }
    

License

This project is licensed under GNU GPL v3 or any later version.

microdraw's People

Contributors

adamagnolia avatar anibalsolon avatar chrisdeely avatar colmose avatar dhovart avatar furinkazan33 avatar gitter-badger avatar hspitzer avatar katjaq avatar laluzmarina avatar martypowell avatar natacha-beck avatar ntraut avatar pglock avatar r03ert0 avatar rbakker avatar tiprata avatar unixzii avatar xgui3783 avatar

Stargazers

 avatar  avatar  avatar  avatar  avatar  avatar  avatar  avatar  avatar  avatar  avatar  avatar  avatar  avatar  avatar  avatar  avatar  avatar  avatar  avatar  avatar  avatar  avatar  avatar  avatar  avatar  avatar  avatar  avatar  avatar  avatar  avatar  avatar  avatar  avatar  avatar  avatar  avatar  avatar  avatar

Watchers

 avatar  avatar  avatar  avatar  avatar  avatar  avatar  avatar  avatar  avatar  avatar  avatar  avatar  avatar

microdraw's Issues

annotation style window doesn't close if clicked outside

Current behaviour:
The color picker opens when clicking on the color rectangle next to the region's name in the ontology list. It closes when you click on the rectangle again, or when you click okay inside the color picker window.
However, it doesn't close when clicking somewhere else in the viewer, anywhere outside the color picker window.
It also doesn't update color information if I just select another region once the color picker is open.

Expected behaviour:
color picker window closes when clicking anywhere outside its boundaries.
color picker updates information if user clicks another region to this region's fill and stroke color.
and it closes on okay button and on rectangle as it currently does.

add text annotations

in addition to drawing region paths (svg), it would be nice to enable text annotations

in OpenSeadragon, they have a text overlay so that text size stays same size independent of zoom level
might be worth a check

add code documentation

MicroDraw uses docjs – without any installation this will output code comments into a documentation of all the functions.
For this to work, we have to put comments in the following style before every single function

/**
 * @function nameOfTheFunction
 * @desc Description of what the function does.
 * @param {type} varName Description of the variable that the function takes as input argument.
 * @returns {type} What the function returns.
 */

and here starts the function

type can be things like {object} or {string} or {number} or {boolean}

We have already put some comments into the code, but there are far more to go! :)

The code documentation is then immediately updating from the inserted comments and visible at
http://localhost:3000/doc/code.html

Start using https://mochajs.org/ for testing

Is this a feature request or a bug report?

Feature request

What is the current behaviour?

Puppeteer is installed for testing the user interface, but there's no real testing framework for automating the UI tests and the rest of the code.

What is the expected or desired behavior?

Start using mocha (https://mochajs.org/) for testing, and include 1 or 2 examples showing how further tests can be implemented.

Add copy/paste

select a path in one slice, paste it somewhere else. Probably add 2 new icons?

Add rotation/translation

if copy/pasting is added, rotation/translation would really help because slices are not necessarily registered. Probably add 2 arrows, one for rotation/translation the other for acting over the anchor points?

draw-polygon unexpected behavior & breaks other utils:

  1. when a region is selected, draw-polygon concatenates the new-to-be-drawn one to the selected one (at closing point)
  2. when no region selected, it doesn't draw anything but breaks the tool (no util would work after that)

this is the version on siphonophore now; tested in chrome, firefox & safari

Misregistration between paper.js and OpenSeadragon

On the current master branch (85c22a0), I am experiencing a number of situations in which the registration of objects drawn on the paper.js view are not properly saved and loaded across slices.

For example, here's a simple recipe that produces a strange result for me every time:

  1. load a fresh copy of microdraw
  2. select the drawing tool
  3. draw a region
  4. zoom and/or pan
  5. switch to an adjacent slice
  6. switch back to the original slice

In all cases I have observed, the outline and the fill area of the region are now out of alignment. Further drawing on the original slice will show the same misregistration, where the outline and the fill area are not aligned. Further panning or zooming will produce unexpected results.

My guess is that we are missing some key bit of registration that needs to be performed as we switch slices. One other clue is that the order of operations 4 and 5 do not seem to matter - you can zoom, then switch, or switch, them zoom. Either way registration is lost.

Screenshot script

A screenshot script that will generate a crop of the high resolution data at a specific resolution with annotations overlaid.

Navigating using the slider has unexpected effects

I have a dataset of about 100 slices with annotations on most of them.
When moving through the dataset using the slider, sometimes the annotations that are loaded do not fit the image. Sometimes an annotation from another slice overlays the current annotations. I guess that it has something to do with initAnnotationOverlay() being called again before the previous execution is finished and thus resulting in an incorrect configuration of the paper canvas.

I will ask our masters student, Karsten, to have a look at it, however I'm also open for suggestions.

apply an affine matrix to the data in the viewer on the fly

When the brain is cut into slices, the tissue gets slightly deformed. So, usually, researchers either do an MRI scan preceding the cutting so that there would be an MRI reference volume, or they would take a picture of the remaining tissue before every single cut, and use these so called blockface images to reconstruct a 3D reference volume.

The cut sections are then registered to the reference volume (best: MRI; blockface also possible) in order to align the slices with each other.
Output: for each section, there will be a 2D affine transformation matrix (including everything from rotation, stretch, shear, translation... everything)

Can we deal with that in the viewer? How can we add an affine matrix to the viewer? So that we can keep track of all transformations, adding up affine matrices, and just apply them to the slice in viewer!

OpenSeadragon has slider to rotate the image --> that could be an option!! :)

functionality to remove background

Currently, MicroDraw allows the user to view the data as is.

It would be great, however, if we could have a button that would allow you to remove the background.
So in a first step, users draw a rough outline around the brain (very roughly). And then on button click the background would be completely removed (not only following the rough outline but the real histological data).

On desktop, OneCut does a great job (coded in C++). Maybe that could be a try?

fix and improve test functionality

What is the current behaviour?

In last few days, @r03ert0 implemented some first test frameworks, e.g. to test the interface β€”> test-draw.js will take some screenshots:

  • picture of the homepage,
  • then it opens a data file,
  • loads the saved annotation (one triangle),
  • then it draws a rectangle,
  • draws a second rectangle,
  • unifies them,
  • deletes them,
  • saves (the triangle will not be deleted)
    and the script takes a screenshot at each step.

These reference images are stored in /test/reference
Once contributors made their code changes, they can run the script node test-draw.js and check if the images it generates into /test are the same as those in the /test/reference directory.

However, this is a first start to test some tools upon button click. We would love to have

  • more tests like the above described addRegion test
  • with the latest changes and updates, we need to check the coordinates for the click still click the correct tool button (I might mess up again when adding the undo... i will delete this comment here as soon as this is done :)
  • add new tests like query the value of some object, and then after the changes query that it s still correct...

Any ideas and contributions are very welcome!! πŸ˜ƒ

isolate all tools into separate .js files

What is the current behavior?

Currently, all of MicroDraw's tools functions are inside one big microdraw.js file. We would like to create one .js file for each tool. (so that in the end we could even work towards a configurable toolbar)

What is the expected or desired behaviour?

We would like to create one .js file for each tool. (so that in the end we could even work towards a configurable toolbar)

Join us! πŸ˜ƒ To help us, you can find details for the two extraction cases below our list of tools.

Please reply here as soon as you start working on one tool to avoid redundant effort :)

These are all the tools we want to separate:

  • navigate
  • home
  • zoomIn
  • zoomOut
  • previous
  • next
  • select
  • draw
  • drawPolygon
  • simplify
  • addPoint
  • deletePoint
  • addRegion
  • deleteRegion
  • splitRegion
  • rotate
  • flip
  • toPolygon
  • toBezier
  • copy
  • paste
  • save
  • screenshot
  • delete
  • closeMenu
  • openMenu
  • undo (is that separable? would be ideal)

To jump in helping us, have a look at the first tool separation in this pull request #74 by @r03ert0 and follow this example to separate more tools.
For all tools that simply require a click, this is the way to go:

    1. find the function you would like to separate inside public/js/microdraw.js
    1. extract the function's code from microdraw.js and add your separated tool to the /public/js/tools/yourTool.js
    1. add your tool to the Microdraw object's extension (search inside public/js/microdraw.js for
// extend Microdraw with tools
  • and add the two according lines there
    1. and change it in the switch case for your tool by finding your tool inside public/js/microdraw.js
switch(me.selectedTool) {

and you are done πŸ˜ƒ
\ΓΆ/ thank youuuu

For all tools that require mouseDown and mouseUp handler you can follow the example in pull request #76 and see how to encapsulate tools like draw and draw polygon. This should help encapsulating some other tools. It doesn't work for tools that require the mouseDrag handler, such as rotate.

Color changing menue does not disappear when selecting another region

The color changing menu (color picker) behaves not as expected when switching regions:

  • selecting menu of region a (click on colored rectangle) when menu of region b is already activated results in the menu disappearing
  • selecting region a (click on name of region) when menu of region b is activated results in the menu still shown but the information of region b still selected.

I would expect the following behaviour:

  • selecting menu of region a (click on colored rectangle) when menu of region b is already activated results in the menu showing the information of region a now
  • selecting region a (click on name of region) when menu of region b is activated results in the menu disappearing (or alternatively the menu showing the information of region a)

symlink openseadragon not recognised in windows

Hi! Thank you for getting back to us! <3

Is this a feature request or a bug report?

Bug, Enhancement

What is the current behavior?

When developing on a Windows machine, it does not properly recognise symlinks, leading to error on page load. Manually rename the openseadragon lib folder would fix the issue, but a minor annoyance.

What is the expected or desired behavior?

Windows developing machine can find the library without manual renaming.

Version information (for bug reports)

Windows10

Other

I will be happy to look into a fix and provide a PR

removing the requirement of the CORS header of source JSON

Hi! Thank you for getting back to us! <3

Is this a feature request or a bug report?

Feature request

What is the current behavior?

During development and production, the json pointed by source parameter requires a CORS header, or be in the same domain. Otherwise a missing CORS header error will be thrown.

What is the expected or desired behavior?

Any JSON can be used, CORS header or not.

Version information (for bug reports)

will provide at a later date

Other

I will be happy to provide a fix and PR on this issue. Not a pressing concern, but minor annoyance.

Paper.js API Breaking Changes

First, great library.

In the interest of keeping it in line with newer versions of Paper.js I'll document breaking changes if there is a desire to upgrade (or for those who want to use the more recent versions of Paper.js). This will be a running list as I haven't yet tested everything.

Currently testing on Paper 0.11.4 / OpenSeadragon 2.2.1

Undo breaks immediately.

function applyUndo(undo) {
    if( undo.imageNumber !== currentImage )
        setImage(undo.imageNumber);
    var info = ImageInfo[undo.imageNumber]["Regions"];
    while( info.length > 0 )
        removeRegion(info[0], undo.imageNumber);
    region = null;
    for( var i = 0; i < undo.regions.length; i++ ) {
        var el = undo.regions[i];
		var project = paper.projects[ImageInfo[undo.imageNumber]["projectID"]];
		/* Create the path and add it to a specific project.
		 */
		var path = new paper.Path();
/*1106*/	project.addChild(path);   // <====== Breaking ======>
		path.importJSON(el.json);
		reg = newRegion({name:el.name, path:path}, undo.imageNumber);
        // here order matters. if fully selected is set after selected, partially selected paths will be incorrect
  		reg.path.fullySelected = el.fullySelected;
 		reg.path.selected = el.selected;
		if( el.selected ) {
			if( region === null )
				region = reg;
			else
				console.log("Should not happen: two regions selected?");
		}
    }
    drawingPolygonFlag = undo.drawingPolygonFlag;
}
// line 1106
project.addChild(path);
Paper.js

https://github.com/paperjs/paper.js/blob/develop/CHANGELOG.md (V 0.10.0)
Undocumented function Project#addChild() that added a layer to a project. It is replaced by Project#addLayer() and Project#insertLayer().

one-click-region could maybe be prevented?

sometimes when you just forget to switch from draw to select or another tool, you just click and hence create an unwanted dot-region. It would be nice if this didn't happen, right?

save annotations separately based on region name and not just the entire slice

Current behaviour:
MicroDraw saves annotations slicewise. It stores in pixel coordinates
the curves (as numbers), the slice number, the region name, the user name
Saving as a json file seems great to being able to query inside!

Suggested behaviour:
This is an idea to enhance the saving to the database: save regions one by one to separate database entries based on their names. This will enable easy getting of one structure to aim at a 3D reconstruction.

Replace jQuery promises with standard promises

What is the current behavior?

Currently, promises use jQuery, like this:

function foo() {
  var def = new $.Deferred();
  if(result_of_async_process_is_ok) {
    def.resolve();
  } else {
    def.reject();
  }
  return def.promise();
}

What is the expected or desired behavior?

Use standard ES promises, which look like:

functio foo() {
  var pr = new Promise(function(resolve, reject) {
    if(result_of_async_process_is_ok) {
      resolve();
    } else {
      reject();
    }
    return pr;
  });

Keyboard shortcuts in Mac should use the Cmd key instead of Ctrl

Keyboard shortcuts in Mac should use the Cmd key instead of Ctrl.
The keyboard shortcut assignment in the initMicrodraw function should check for 'Mac', probably like this:

if (navigator.userAgent.indexOf('Mac OS X') != -1) {
  $("body").addClass("mac");
} else {
  $("body").addClass("pc");
}

make eslint happy

MicroDraw uses eslint for establishing a common code style.

We are currently at 447 complaints by eslint... :D wayyyyy to goooo!!!
It also helps us detect where function descriptions for docjs would still be missing.

add an extract functionality

Is this a feature request or a bug report?

an awesome new feature!

What is the current behavior?

Currently, MicroDraw loads and displays the data as is. Depending on the scan of the histological data, sometimes there is a large empty border around the actual data.

What is the expected or desired behaviour?

Would be nice if MicroDraw could allow the user to draw a rectangle around the field of view that they would like to keep, and then to copy everything inside that rectangle into a new file.

When dividing a region, the new region keeps the old colour instead a new one based on its name

When dividing a region, the new region keeps the old colour instead a new one based on its name.

  1. draw region A
  2. draw region B overlapping A, region B is selected.
  3. select the divide tool and click on A
  4. region A is now divided in 2 parts.

Expected result: The new part (the one in common with B) is named 'Untitled 1' and has a colour based on the name ('Untitled 1' in this case). The region appears in the region list with the new colour

Observed result: The new region has the same colour as A, different from the color in the region list, which seems to be correctly computed based on the name

draw functionality broken in phone use

drawing works great on computer, but in phone it creates new untitled regions but does not draw them on the slice; instead seems to jump to upper left corner of the screen and makes a dot there
also, it is hard to access the created regions in region list (they are off screen at bottom)
(tried on Google Nexus)

scrollbar functionality for regionList broken

which causes the canvas to "jump" due to adding a scrollbar to the overall page once you reach a certain number of regions in your list so that it starts extending off screen ((instead, it should just use the scrollbar inside of the region list but I wasn't able to convince it to do so -- would be happy about any thoughts on that :))
this becomes particularly obvious when hiding and showing the menu

Login dialog disappears together with the toolbar

When trying to log in using the login link at the upper left corner, the dialog for entering username and password disappears once the focus of the mouse is removed from the toolbar.
This makes logging in a bit difficult :-)

Additionally the keyboard shortcuts should probably be disabled when typing in an textfield

draw line functionality

What is the current behaviour?

Currently, MicroDraw allows you to draw a region path as a bezier curve or as a polygon path.

What is the expected or desired behaviour?

However, experts are often used to drawing cytoarchitechtonic borders instead of complete regions. (Thanks for bringing this up @hspitzer !!)

So it would be awesome to add the possibility to just draw a line. Currently, drawPolygon requires to close the path. Any escape option would be fantastic. Maybe upon return key or escape key?

Split the code

currently, all the main code is in one enormous file called

microdraw.js

basic idea for the structure:

into main parts:

  • 1: view

    • DZI
    • scalebar
    • plugin for screenshots
  • 2: paint

    • in paint : ontology
      and the paint tools
      and the paint tools all separately
  • 3: database

  • 4: project handling

  • 5: maybe a user page

  • 6 backend

save tool will interact with database but also with the others --> using jquery extend to create one big object

add an overlay functionality

Currently, MicroDraw allows you to create one annotation layer over one data layer.

It would be lovely to being able to have several overlays, like different stainings for instance, or the different PLI directions, and to blend between them.

@Rob: could you see if 'simplify' can be included into your pretty undo functionality?

it might be great to have an undo-possibility for simplifying the region path ((for the moment, you can simplify the path; but if you are unhappy with the result (maybe too imprecise now), there is no way of going back ((you could just manually add points to the existing current unhappy path and then go by hand to move the points to outline your region more precisely again...))
I could hack a one-step-back thingy into simplify, but it would be most awesome if you found a way to include simplify into your pretty undo :)

Recommend Projects

  • React photo React

    A declarative, efficient, and flexible JavaScript library for building user interfaces.

  • Vue.js photo Vue.js

    πŸ–– Vue.js is a progressive, incrementally-adoptable JavaScript framework for building UI on the web.

  • Typescript photo Typescript

    TypeScript is a superset of JavaScript that compiles to clean JavaScript output.

  • TensorFlow photo TensorFlow

    An Open Source Machine Learning Framework for Everyone

  • Django photo Django

    The Web framework for perfectionists with deadlines.

  • D3 photo D3

    Bring data to life with SVG, Canvas and HTML. πŸ“ŠπŸ“ˆπŸŽ‰

Recommend Topics

  • javascript

    JavaScript (JS) is a lightweight interpreted programming language with first-class functions.

  • web

    Some thing interesting about web. New door for the world.

  • server

    A server is a program made to process requests and deliver data to clients.

  • Machine learning

    Machine learning is a way of modeling and interpreting data that allows a piece of software to respond intelligently.

  • Game

    Some thing interesting about game, make everyone happy.

Recommend Org

  • Facebook photo Facebook

    We are working to build community through open source technology. NB: members must have two-factor auth.

  • Microsoft photo Microsoft

    Open source projects and samples from Microsoft.

  • Google photo Google

    Google ❀️ Open Source for everyone.

  • D3 photo D3

    Data-Driven Documents codes.