GithubHelp home page GithubHelp logo

gputop's Introduction

Build Status

gputop

GPU Top is a tool to help developers understand GPU performance counters and provide graphical and machine readable data for the performance analysis of drivers and applications. GPU Top is compatible with all GPU programming apis such as OpenGL, OpenCL or Vulkan since it primarily deals with capturing periodic sampled metrics.

GPU Top so far includes a web based interactive UI as well as a non-interactive CSV logging tool suited to being integrated into continuous regression testing systems. Both of these tools can capture metrics from a remote system so as to try an minimize their impact on the system being profiled.

GPUs supported so far include: Haswell, Broadwell, Cherryview, Skylake, Broxton, Apollo Lake, Kabylake, Cannonlake and Coffeelake.

It's not necessary to build the web UI from source to use it since the latest tested version is automatically deployed to http://gputop.github.io

If you want to try out GPU Top on real hardware please follow these build Instructions and give feedback here.

Web UI Screenshot

Starting the GPU Top server

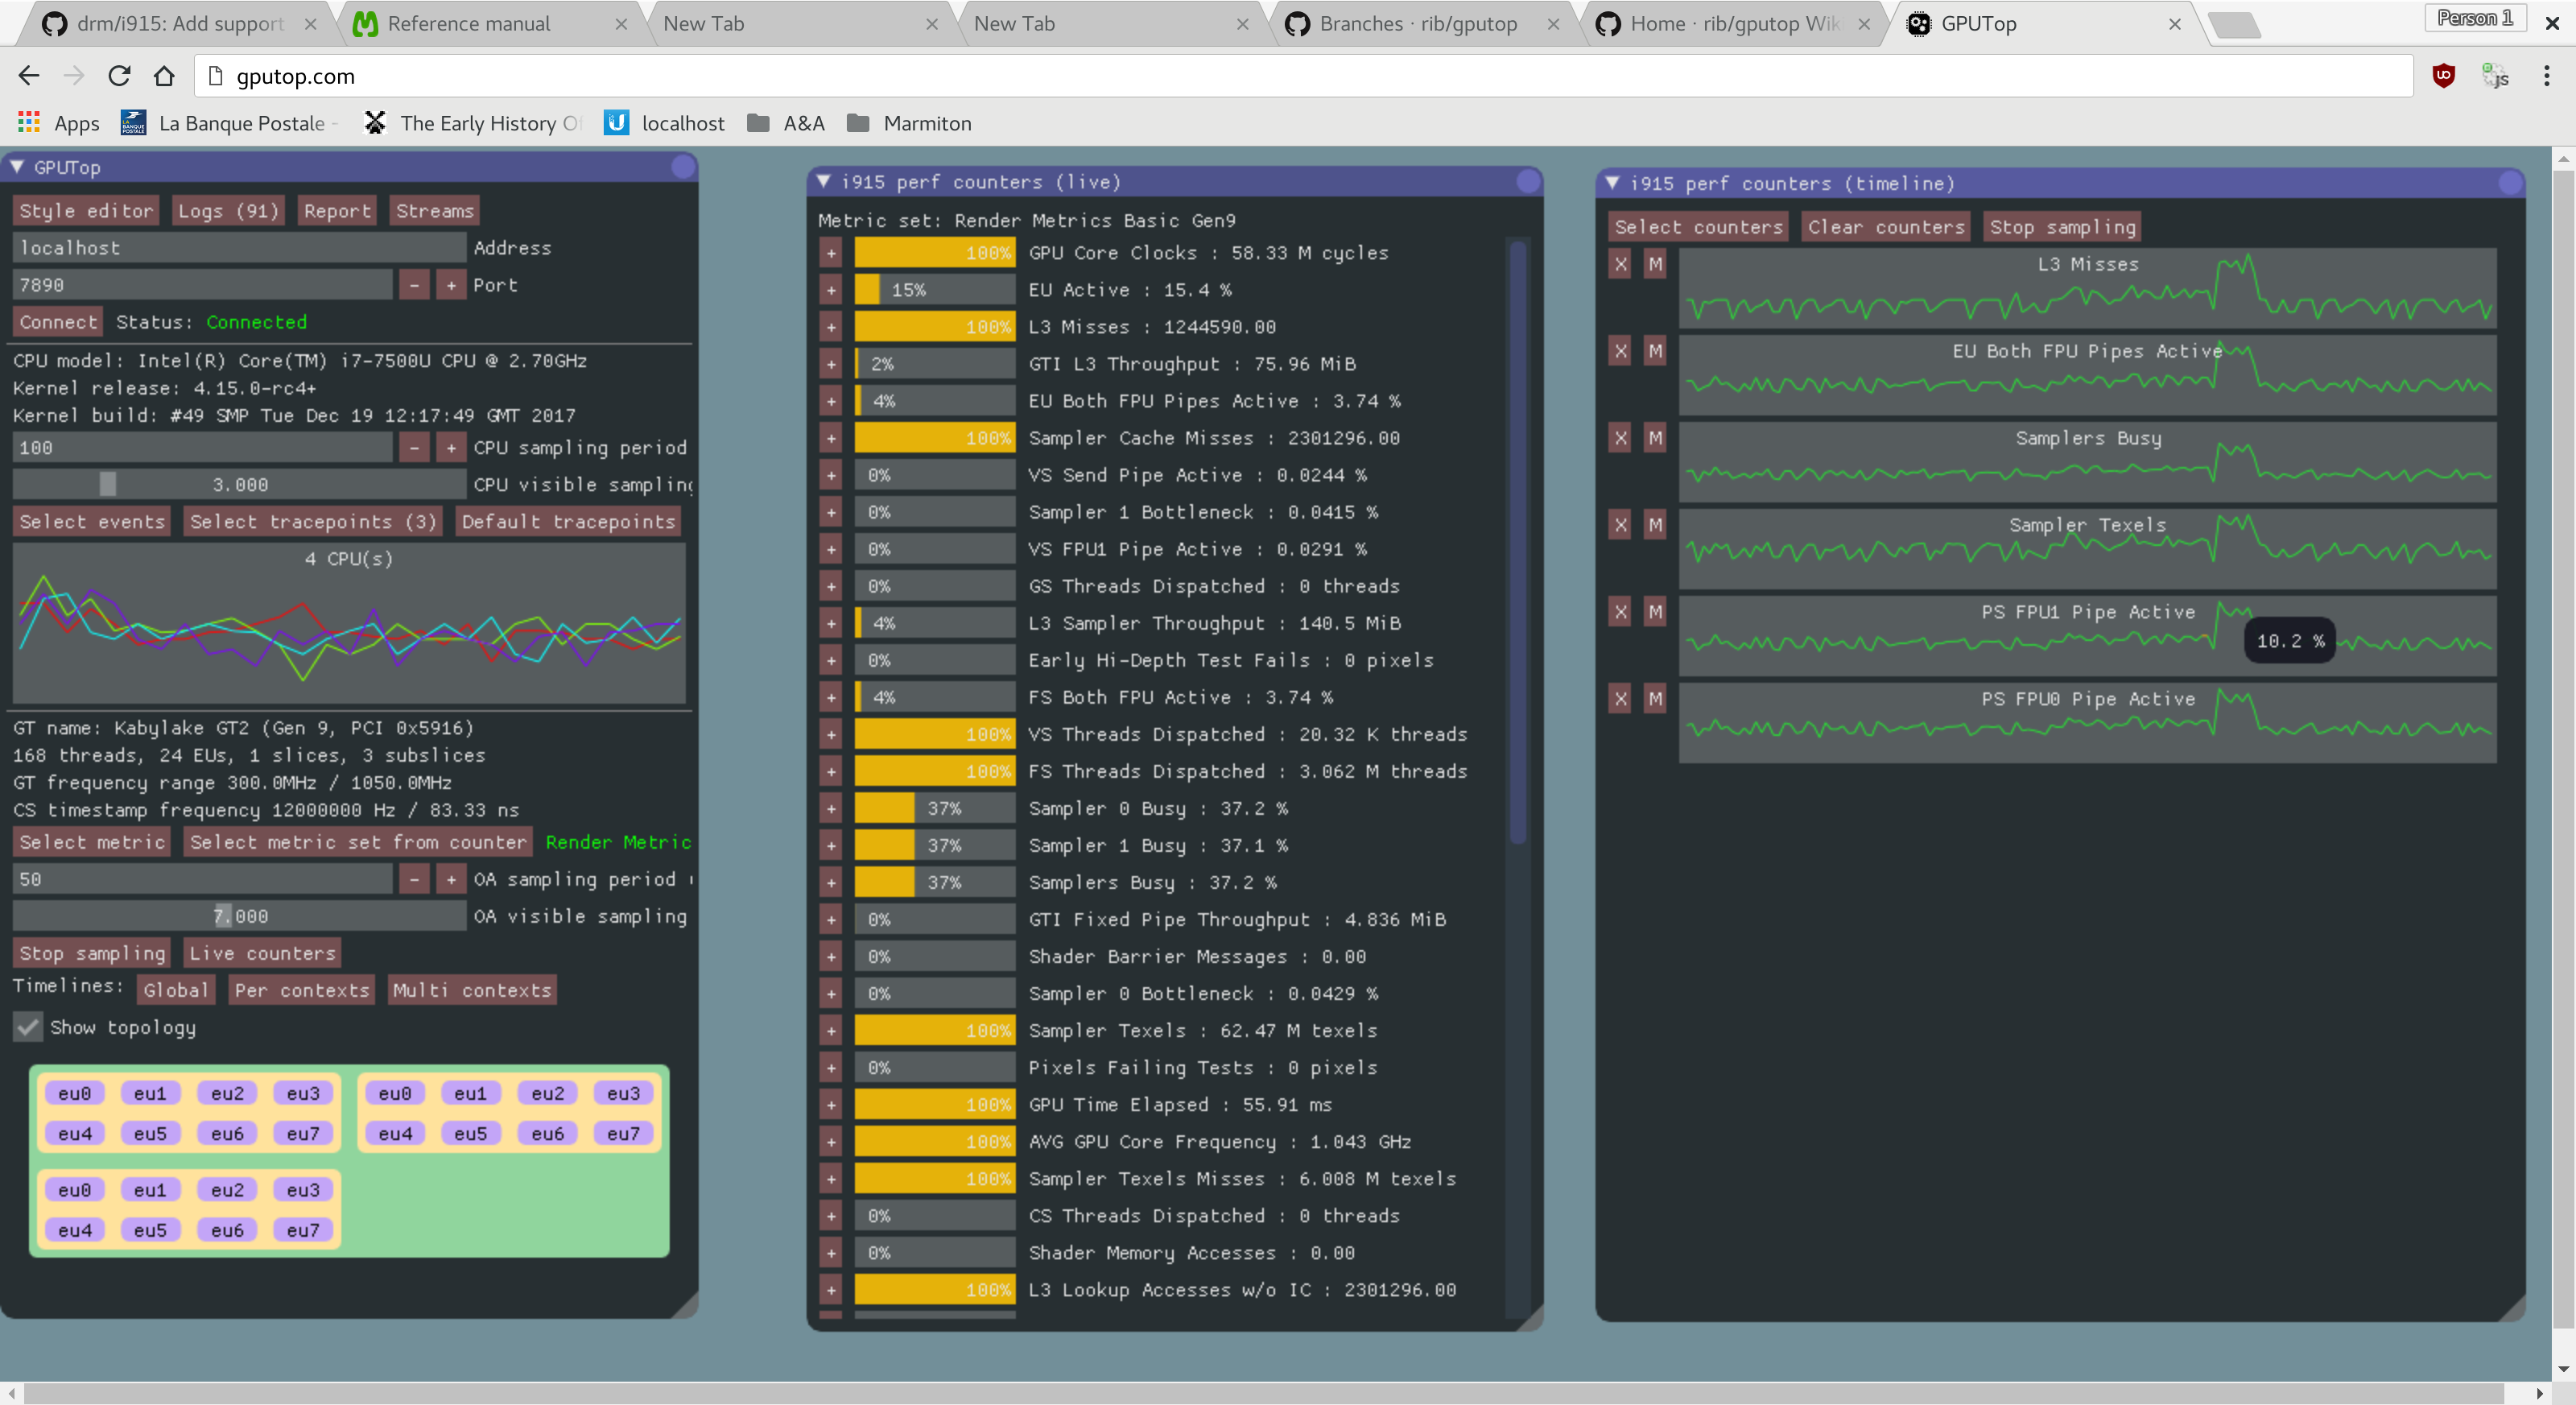
Before you can use one of the clients, you need to start the GPU Top server. Since GPU Top is primarily a system wide analysis tool, you need to launch the server as root so that you can access information about any of the running processes using the GPU. You can done so by running :

sudo gputop

CSV output example

Here's an example from running gputop-wrapper like:

gputop-wrapper -m RenderBasic -c GpuCoreClocks,EuActive,L3Misses,GtiL3Throughput,EuFpuBothActive

Firstly the tool prints out a header that you might want to share with others to help ensure your comparing apples to apples when looking at metrics from different systems:

Server: localhost:7890
Sampling period: 1 s
Monitoring system wide
Connected

System info:
	Kernel release: 4.15.0-rc4+
	Kernel build: #49 SMP Tue Dec 19 12:17:49 GMT 2017
CPU info:
	CPU model: Intel(R) Core(TM) i7-7500U CPU @ 2.70GHz
	CPU cores: 4
GPU info:
	GT name: Kabylake GT2 (Gen 9, PCI 0x5916)
	Topology: 168 threads, 24 EUs, 1 slices, 3 subslices
	GT frequency range: 0.0MHz / 0.0MHz
	CS timestamp frequency: 12000000 Hz / 83.33 ns
OA info:
	OA Hardware Sampling Exponent: 22
	OA Hardware Period: 699050666 ns / 699.1 ms

And then compactly prints the data collected. In this case the output was to a terminal and so the data is presented to be easily human readable. When output to a file then it will be a plain CSV file and numbers aren't rounded.

    Timestamp  GpuCoreClocks  EuActive      L3Misses  GtiL3Throughput  EuFpuBothActive
         (ns)     (cycles/s)       (%)  (messages/s)              (B)              (%)
 285961912416,770.9 M cycles,  0.919 %,   1473133.00,       89.91 MiB,         0.256 %
 286992496416,900.1 M cycles,   1.04 %,   2036968.00,       124.3 MiB,         0.316 %
 288190601500,521.4 M cycles,   1.81 %,   2030997.00,         124 MiB,         0.537 %
 289519269500,1.028 G cycles,   11.8 %,  33181879.00,       1.978 GiB,          3.82 %
 290562176250,1.007 G cycles,   11.1 %,  30115582.00,       1.795 GiB,          3.66 %
 291569408333,905.9 M cycles,     10 %,  24534419.00,       1.462 GiB,          3.18 %
 292590314500,762.4 M cycles,   6.89 %,  10934947.00,       667.4 MiB,          2.31 %
 293954678166,538.5 M cycles,   1.72 %,   2034698.00,       124.2 MiB,         0.543 %
 295323480416,751.6 M cycles,   1.28 %,   2034477.00,       124.2 MiB,         0.356 %

Building GPU Top

Dependencies

GPUTop uses the meson build system. On a recent distribution you can install meson with :

sudo apt-get install meson

Alternatively you can use the pip distribution mechanism :

sudo pip3 install meson

GPU Top without UI tools has minimal dependencies :

sudo apt-get install libssl-dev
pip2 install --user mako

If you want to build the GLFW UI, also install the following dependencies :

sudo apt-get install libgl1-mesa-dev libegl1-mesa-dev libglfw3-dev libepoxy-dev

A Gtk+ backend is also available for the UI (users with retina displays will want to use this), you'll need the following dependencies :

sudo apt-get install libsoup2.4-dev libcogl-dev libgtk-3-dev

Configuring the GPU Top build

Without UI :

meson . build

With GLFW UI :

meson . build -Dnative_ui=true

With Gtk+ UI :

meson . build -Dnative_ui_gtk=true

Building GPU Top

ninja -C build
ninja -C build install

Building GPU Top Web UI

First make sure to have emscripten installed. GPU Top is currently only tested with version 1.37.27 of the emscripten SDK. Instructions to download the SDK are available here :

https://kripken.github.io/emscripten-site/docs/getting_started/downloads.html

After having run :

./emsdk update

Install the tested version :

./emsdk activate sdk-1.37.27-64bit
./emsdk install sdk-1.37.27-64bit

Then configure GPU Top to build the Web UI (in that mode it'll only build the UI, you'll need to build the server in the different build directory).

meson . build-webui -Dwebui=true --cross=scripts/meson-cross/emscripten-docker-debug.txt

Create a directory to serve the UI and copy the files needed :

mkdir webui
cp ui/*.html ui/*.css ui/favicon.ico webui/
cp build-webui/ui/*.js build-webui/ui/*.wasm* build-webui/ui/gputop-ui.wast webui/

You should now be able to serve the UI from the webui/ directory.

gputop's People

Contributors

a1rwulf avatar akromx16 avatar arvindyadavcs avatar djdeath avatar dvrogozh avatar he-wenjian avatar jiaopengyuan avatar jnikula avatar kasi-reddy avatar llandwerlin-intel avatar lucasdemarchi avatar marcinslusarz avatar matt-auld avatar midhunkodiyath avatar rib avatar sergioamr avatar yogesh-marathe avatar zhenyw avatar

Stargazers

 avatar  avatar  avatar  avatar  avatar  avatar  avatar  avatar  avatar  avatar  avatar  avatar  avatar  avatar  avatar  avatar  avatar  avatar  avatar  avatar  avatar  avatar  avatar  avatar  avatar  avatar  avatar  avatar  avatar  avatar  avatar  avatar  avatar  avatar  avatar  avatar  avatar  avatar  avatar  avatar  avatar  avatar  avatar  avatar  avatar  avatar  avatar  avatar  avatar  avatar  avatar  avatar  avatar  avatar  avatar  avatar  avatar  avatar  avatar  avatar  avatar  avatar  avatar  avatar  avatar  avatar  avatar  avatar  avatar  avatar  avatar  avatar  avatar  avatar  avatar  avatar  avatar  avatar  avatar  avatar  avatar  avatar  avatar  avatar  avatar  avatar  avatar  avatar  avatar  avatar  avatar  avatar  avatar  avatar  avatar  avatar  avatar  avatar  avatar  avatar

Watchers

 avatar  avatar  avatar  avatar  avatar  avatar  avatar  avatar  avatar  avatar  avatar  avatar  avatar  avatar  avatar  avatar  avatar  avatar  avatar  avatar  avatar  avatar

gputop's Issues

Make sure emscripten source maps are usable for web UI developers

Emscripten is used for the web worker that is responsible for parsing the raw, binary counter data from the device and normalizing metrics for presentation.

Emscripten compiles C code to JavaScript but the resulting JavaScript isn't intended to be human readable and is not at all pleasant to debug directly.

Firefox and Chrome both support Source Maps as a way to effectively provide debug symbols for JavaScript that was generated from another language so that the browser debugger will actually show your original (in our case C) source when stepping through code.

I think Emscripten generates a source map if -g is used to build all object files and the final JavaScript (a .map file should appear when building gputop with --debug) but we need to make sure the browser will be able to download the .map file by installing it into the same directory as other web ui resources that are served by gputop --remote. It might just be a case of ensuring the .map file gets installed by gputop/web/Makefile.am.

A page on the wiki for 'Developers' making sure people know to enable source map usage as part of the browser debug settings if necessary could be helpful too.

Querying the environment within an ifunc resolver yields unexpected behaviour

Running GPU top on Fedora 23 results in a crash. Doing a little digging it appears to be the related to accessing the environment from within the ifunc resolver. After some research is seems that calling library routes within the resolver is not allowed, as ifunc runs as the program is just starting, so behaviour is not well defined when accessing the environment. To resolve this we will now need to use LD_PRELOAD to load our GL hooks, and abandon the ifunc work :(

Make the web ui the default ui

Currently gputop has to be run with --remote to run the web ui and by default gputop shows an ncurses ui.

At this point the ncurses UI is terrible in comparison to the web ui. Originally it was helpful for me to be able to smoke test the i915 perf kernel interface but it never evolved to be a practical, usable interface for profiling.

I think we should aim to delete the ncurses UI relatively soon, but before that we can instead annex it so that users need to explicitly pass an option like --ncurses on the command line to see this now-deprecated interface.

At the same time we can remove the --remote option, making it the default mode of operation.

One consideration here is that currently only the ncurses UI exercises the GL_INTEL_performance_query extension. At this point I tend to think this extension is redundant, though there are a few other GL specific features the ncurses UI supports, such as collecting KHR_debug messages and being able to toggle a full-screen scissor for experimentation. We might want to keep in mind exposing some of these features through the web ui before finally deleting the ncurses ui.

ui: converting all counters with a max into a percentage may conflict with documented units

Currently if a counter has a max we convert with var value = 100 * d_value / max; which may conflict with the documented units of the counter.

Sometimes the percentage view of the counter could indeed be most informative since it may better represent how a workload is reaching the theoretical limits of the platform.

Sometimes the absolute values of the counter, such as for bandwidth, throughput values are useful to see too.

Something else to consider here is that some counters with a max value don't have a constant maximum and so every update may provide a new, corresponding max value. Often a metric's maximum value is based on the number of clocks that have elapsed. E.g. the maximum throughput for a cache over some period of aggregation depends on how many clock cycles elapsed over that period.

For counters with a varying maximum it could be interesting to see how it looks if the trace view can even plot both the absolute and percentage values together in two different, semi-transparent colors. Or maybe we could have some way of switching between the absolute or percentage view per counter.

Factor out shared OA counter accumulation code

gputop_perf_accumulate() in gputop-perf.c is the same as accumulate_oa_reports() in gputop-web-worker.c. accumulate_uint32() and accumulate_uint40() have also been copied.

We can add a gputop/gputop-oa-counters.c and gputop/gputop-oa-counters.h with this common code named something like gputop_oa_accumulate_reports() and gputop/Makefile.am and gputop/web/Makefile.emscripten can both be updated to build the same code instead.

Take into account context-switches for per-context monitoring

On Broadwell+ the hardware tags reports with a 'Context ID', then for per-context metrics the kernel driver itself filters reports based on this, when a context-switch occurs the hardware generates a special 'marker' report which user-space should ignore when calculating the deltas between reports. Currently in gputop this report is not ignored. On previous generations the OA unit is programmed with a context, so the filtering is done on the gpu, rather than the cpu.

switch from 'query' to 'stream' terminology

We have lots of things using the term 'query' which is a hangover from code for working with the GL_INTEL_performance_query extension. In that case a query represents a delimited query for metrics made via the command stream whereas mostly all other metrics are periodically sampled and read from the kernel as a stream.

At some point we should get rid of this naming confusion.

In the case of struct gputop_perf_query this represents the (mostly immutable) meta data for a metric set, automatically generated from the XML data by oa-gen.py. probably struct gputop_metric_set would be a better description.

struct gputop_worker_query has an extra naming hangover from when the code used to be run in a Web Worker thread which isn't true anymore. This one should probably become a 'stream' something like struct gputop_remote_stream

gputop launcher should print environment variables it sets

The gputop program is only a convenience launcher that sets environment variables, such as LD_LIBRARY_PATH or GPUTOP_GL_LIBRARY and running an application. Since gputop is used to profile third party programs whose main() function we don't control, the entrypoint for gputop is the attribute((constructur)) void gputop_ui_init() symbol in gputop-ui.c

Sometimes it's useful to be able to set the environment variables manually and run the application directly, such as when debugging with gdb or running valgrind.

Running gputop --help at least documents the environment variables it sets, but it would also be convenient to have a --dry-run option that would print out all the environment variables that would be set in a form that can easily be copy and pasted to run gdb or valgrind. --dry-run would skip actually running anythings since otherwise the ncurses UI would clobber the output. If the --remote option is used then we should always print out the environment variables set.

Simplifying web architecture

Currently the web code is divided in two parts,

  1. Javascript UI
  2. Emscripten generated code from C which uses a webworker that creates a websocket to communicate
    with the GPUTOP server using protobuffers.

The UI talks to the webworker using a JSON RPC functionality. For every UI interaction that we need to add we have to create several functions to enable interaction.

The idea is to simplify this system by removing the UI interaction from the webworker and having the native JS being able to communicate seamlessly with the GPUTOP server.

ui: support graphing metrics without a given max

In particular it could be useful to see the trace of the AVG GPU Core Frequency which we don't currently provide a maximum value for (though we will eventually).

As we plot values along the x axis of the graph we can keep track of the largest value we've seen so far and update the y axis range accordingly.

Support viewing per-context metrics using execbuffer2 ioctl override via LD_PRELOAD

The current way we access per-context metrics via the INTEL_performance_query extension in Mesa isn't ideal in a number of ways:

  1. The way the spec is designed it can't expose all the meta data we have on performance counters.
  2. The extension is only applicable to OpenGL, while we also want to be able to see per-context metrics with OpenCL or e.g. Vulcan.
  3. For tools to use the INTEL_performance_query_extension (as opposed to applications using it) it's complex and fragile to intercept an applications use of OpenGL and intermix private use of the OpenGL api without trampling on the application's state while also handling all the different window system bindings for GL (to track contexts, surface and buffer swaps).

The only difference to accessing system wide or per-context performance metrics from the kernel is that a context handle must given to the DRM_IOCTL_I915_PERF_OPEN ioctl via the DRM_I915_PERF_CTX_HANDLE_PROP property. If you look at the mesa repo supporting INTEL_performance_query you can see an example in brw_performance_query.c

This context handle is conceptually private to Mesa or whatever api creates the context, but the handle is passed in every DRM_IOCTL_I915_GEM_EXECBUFFER2 request which submits buffers of commands to be scheduled on the GPU.

The details of the drm kernel interface can be seen in the kernel repo in include/uapi/drm/i915_drm.h

See the struct drm_i915_gem_execbuffer2 definition

The context ID is passed in the rsvd1 member

An ioctl override can be written something like:

int ioctl(int fd, int request, void *data)
{
  static int (*real_ioctl) (int fd, int request, void *data);
  int ret;

  if (request == DRM_IOCTL_I915_GEM_EXECBUFFER2) {
    struct drm_i915_gem_execbuffer2 *e = data;
    uint32_t ctx_handle = e->rsvd1;

    // Do stuff
  }

  if (!real_ioctl)
    real_ioctl = dlsym(RTLD_NEXT, "ioctl");

  return real_ioctl(fd, request, data);
}

This could be compiled as part of a standalone libgputop-ioctl.so or maybe directly in libgputop.so and gputop-main.c can be updated to set LD_PRELOAD (probably depending on a command line option) when launching a program.

Perhaps starting with a basic test based on the ncurses UI, it would then be good to plumb this feature through to the web UI too. It could be nice if the web UI let you switch between a system-wide or per-context view on the fly.

immutable metric set data and stream state should be decoupled

Currently we have struct gputop_perf_query (which mostly represents the meta data of the XML metric sets in the form of C structures, generated via oa-gen.xml) also coupled with a uint64_t accumulator[] array which is runtime state used in the processing of the metrics, aggregating counter deltas over a configurable period of time before evaluating the normalization equations.

One limitation of coupling these is that we can't have multiple accumulators per stream of metrics, which would be useful when we want to be able to visualize the same metrics in multiple ways at the same time, depending of accumulating for different lengths of time. For example in the web ui while plotting a trace of some metrics on a graph we want very short accumulation periods so we can plot lots of points over time for a detailed graph while we also want to show the bar graphs for counters at the same time which should update less frequently, maybe just once per second, so the values remain readable to the user.

We should aim to introduce a separate struct gputop_perf_aggregator that is associated with a stream of metrics instead of being coupled with the metric set descriptions.

Assuming we rename struct gputop_perf_query to struct gputop_metric_set and struct gputop_worker_query to struct gputop_remote_stream as in #126 then we could introduce a struct gputop_perf_aggregator that itself works with the data from a struct gputop_remote_stream.

The aggregator would track the uint64_t array of deltas and a period over which counter deltas are accumulated.

When the raw i915 perf samples are processed the same raw counter reports should be processed separately for each accumulator.

ui: The per context mode toggle doesn't work a.t.m

Toggling this currently generates an Invalid argument error, and I think that's probably because we're attempting to open the per-context query with the wrong drm file descriptor. (we have to use the file descriptor that the driver (i.e. Mesa) opened and created the specific context in association with.)

Each struct ctx_handle that's added to the ctx_handles_list (which is referenced inside gputop_open_i915_perf_oa_query() when opening a per-context query) includes a ->fd member which is the corresponding drm file descriptor we need to use instead of drm_fd.

On a related note I think we should probably remove struct perf_query::per_ctx_mode in favour of making this a member of struct gputop_perf_stream instead. gputop_open_i915_perf_oa_query() should perhaps then take a struct ctx_handle *ctx argument pointing to a drm filedescriptor and ID pair - which if not NULL implies the stream should be opened as a per-context stream.

struct perf_query should more or less be an immutable description of a set of metrics but it's quite badly named at this point

Enable capturing OA metrics via MDAPI

MDAPI is an api available on Windows and Linux for capturing OA metrics, used by tools such as GPA and VTune for capturing GPU metrics.

A couple of benefits I can see we'd get from optionally being able to read our metrics via MDAPI are:

  • A stepping stone towards making GPU Top run on Windows so it can be a more broadly useful tool for developers
  • If we can get to the point of being able to run on Windows then we'd be able to compare that our metrics are consistent on the same hardware for the same workloads which would provide us more input on whether our driver (and the Windows driver) are working well depending on their consistency.
  • In the short term it could help further test the Linux implementation of MDAPI we use for enabling GPA on Linux by checking for consistency between using MDAPI or the kernel directly.

This would involve updating gputop-perf.c to allow us to conditionally dlopen() libmd.so and use MDAPI to open and read a stream of metrics instead of using the i915 perf kernel interface directly.

My hope would be that we find ways of mapping metric sets discovered via mdapi to the metric sets we already know about so that once we find a mapping to a metric set guid we won't need to deal with evaluating mdapi normalization equations at runtime and can instead re-use the oa-xyz.c code we generate at build time. Initially we can just do this mapping based on the metric set symbol names, but it could be pertinent to also look at ways of cross-referencing that the B/C counters described by mdapi match our corresponding counter descriptions for the same set to be more confident that the raw counters are really based on the same hardware configuration.

Notably the above mapping limits how much of the mdapi interface we would depend on and effectively test, but the interest here is more in comparing the data got from the hardware and kernel.

Demo Site: show plausible live demo metrics

Currently the demo site doesn't show how the bar graphs, and trace graphs work which limits how representative the demo is of what can be seen on real hardware.

Similar to how we support generating fake data when running gputop --fake it would be good if the demo site were fed a stream of fake metrics to process.

Ideally I think we'd fake the data at same level as we do for --fake by generating fake i915 perf records including OA reports and we'd hook into the code that would normally receive the web socket messages containing these reports to instead feed it fake messages.

fake data --remote doesnt work with the current web ui

Travis at the moment checks 2 builds out of 6 with the --fake option, which runs the ncurses UI. However, when used with --remote as well, the website gets into all kinds of assertion and doesn't display anything anything useful

Left pane too narrow

Left pane is a bit too narrow considering the long metric set names, resulting in excessive wrapping of the names.

Enumerate OA configs supported by kernel via sysfs

The latest kernel interface advertises the list of configs it supports under sysfs something like:

/sys/class/drm/card0/metrics/
/sys/class/drm/card0/metrics/bc274488-b4b6-40c7-90da-b77d7ad16189
/sys/class/drm/card0/metrics/bc274488-b4b6-40c7-90da-b77d7ad16189/id
/sys/class/drm/card0/metrics/403d8832-1a27-4aa6-a64e-f5389ce7b212
/sys/class/drm/card0/metrics/403d8832-1a27-4aa6-a64e-f5389ce7b212/id
/sys/class/drm/card0/metrics/3865be28-6982-49fe-9494-e4d1b4795413
/sys/class/drm/card0/metrics/3865be28-6982-49fe-9494-e4d1b4795413/id
/sys/class/drm/card0/metrics/3358d639-9b5f-45ab-976d-9b08cbfc6240
/sys/class/drm/card0/metrics/3358d639-9b5f-45ab-976d-9b08cbfc6240/id
/sys/class/drm/card0/metrics/bb5ed49b-2497-4095-94f6-26ba294db88a
/sys/class/drm/card0/metrics/bb5ed49b-2497-4095-94f6-26ba294db88a/id
/sys/class/drm/card0/metrics/39ad14bc-2380-45c4-91eb-fbcb3aa7ae7b
/sys/class/drm/card0/metrics/39ad14bc-2380-45c4-91eb-fbcb3aa7ae7b/id

The long garbled IDs are called GUIDs or UUIDs and they correspond to the guid attributes for set elements in the gputop/oa-*.xml files so they can be used to associate kernel/HW configurations with the meta data in these files.

The 'id' files contain the ID that can be passed to DRM_IOCTL_I915_PERF_OPEN to open that configuration.

This recent commit to Mesa gives an example enumerating the configs via sysfs: rib/mesa@2ca9a97 and some of this code can simply be copied into gputop. One thing to consider is that we don't currently have a hash table implementation in gputop. Either the code can be adapted to not index the configs in a hash table or maybe copy src/util/hash_table.[ch] from Mesa into gputop as it has a compatible license.

In particular the brw_oa.py script (similar to gputop/oa-gen.py in gputop) was changed to add full set of known queries to a hash table (using the guid as a key). Looking at gputop_perf_initialize() when the gputop_oa_add_queries_ functions are called they will index the known queries. After that we can enumerate the configs supported via sysfs.

Maybe starting with the ncurses UI in gputop it would be good if we removed the hard coded tabs for system wide metrics (i.e remove tab_3d, tab_compute, tab_compute_extended, tab_memory_reads and the corresponding callbacks) and instead dynamically added all the tabs based on what's advertised under sysfs and matching those guids with the meta data we maintain in gputop.

It might also help to reference some related to changes to add GL tabs dynamically in this commit: d793587#diff-2c5aacef01029cfdd05efc6b1022945aL61 (Though most of the GL specific details of that change can be ignored in this context)

To enable this for the web UI we then need to introduce some gputop.proto protocol for forwarding the list of guids from the kernel to the browser so that it also only shows the configs that are supported by the current kernel.

Fix initialization of devinfo structure in gputop-web-worker.c:update_features()

The members in struct devinfo are important for the correct normalization of counters, but the devinfo structures being referenced while normalizing counters in the remote web worker aren't fully initialized.

Looking at what's initialized in gputop-web-worker.c:

    devinfo.devid = features->devinfo->devid;
    devinfo.n_eus = features->devinfo->n_eus;
    devinfo.n_eu_slices = features->devinfo->n_eu_slices;
    devinfo.n_eu_sub_slices = features->devinfo->n_eu_sub_slices;
    devinfo.subslice_mask = features->devinfo->subslice_mask;

cross-reference with the structure defined in gputop-perf.h

struct gputop_devinfo {
    uint32_t devid;

    uint64_t n_eus;
    uint64_t n_eu_slices;
    uint64_t n_eu_sub_slices;
    uint64_t eu_threads_count;
    uint64_t subslice_mask;
    uint64_t slice_mask;
};

See that slice_mask and eu_threads_count aren't initialized.

To fix this gputop-server.c:handle_get_features() needs to be updated to forward all the required info. Currently it just does:

    devinfo.devid = gputop_devinfo.devid;
    devinfo.n_eus = gputop_devinfo.n_eus;
    devinfo.n_eu_slices = gputop_devinfo.n_eu_slices;
    devinfo.n_eu_sub_slices = gputop_devinfo.n_eu_sub_slices;

It will also be necessary to update the corresponding protobuf message in gputop.proto:

message DevInfo
{
    required uint32 devid = 1;
    required uint32 n_eus = 2;
    required uint32 n_eu_slices = 3;
    required uint32 n_eu_sub_slices = 4;
    required uint64 subslice_mask = 5;
}

ui: Overview: update EU info a bit

We're currently missing the EU Subslice count under GPU Info which could be useful to see.

It could help to order the EU info to represent their heirarchy in silicon like:

  1. Number of EU Slices
  2. Number of EU Subslices
  3. Number of EUs
  4. EU Threads Count

(i.e. EU slices contain subslices, contain EUs, execute threads)

It could also be good to clarify which are totals or not, something like:

  1. Number of EU Slices
  2. Number of EU Subslices per Slice
  3. Total Number of EUs
  4. Total EU Threads Count

Web UI metrics sometimes freezing

I get this problem quite often, that the metrics are freezing and there's no output errors in the logs that would tell something went wrong. I normally have to refresh the web page for the query to reset in order to fix it.

Allow the web ui to open and collect perf tracepoint metrics, e.g. to visualize vblanks

gputop-perf.c already has initial support for opening up perf tracepoints, but we still need some extended Protocol Buffers protocol in gputop.proto and web ui support to be able to capture perf tracepoint metrics (such as vblank metrics) so we can plot these onto the traceview graphs of individual metrics.

Roughly I guess we need:

  • extended protocol for opening a tracepoint, as opposed to an i915-perf stream
  • The raw format for tracepoints is introspectable via debugfs and we should support reading in the (machine readable) files that describe the format of a particular tracepoint and forwarding this description to a remote ui.
  • there is already be some gputop-server.c code for forwarding perf metrics (which should Just Work™ for tracepoint data) but the plumbing to handle perf messages in gputop.js and gputop-web.c is currently incomplete. (though there are some leftovers since OA metrics used to be captured based on the perf interface)
  • ajax/metrics.html should have some option (just yet another toggle to start with) to enable plotting particular tracepoint data (recommend starting with vblank events). We should keep in mind ideas for improved ways to expose more tracepoints in the UI though.
  • gputop.js needs a new object to track an open Tracepoint - we shouldn't just keep dumping things in the Metric object, and maybe this is a good time to split some things out of the Metric object.
  • gputop-web.c needs a structure for tracking an open tracepoint, similar to, or an adaptation of struct gputop_webc_stream
  • gputop-ui.js (which is responsible for updating the traceview graphs) is probably a good place to orchestrate requesting the server to open a perf tracepoint in response to a user action via metrics.html, and managing the lifetime of any corresponding Tracepoint object and struct gputop_webc_stream. As tracepoint data is received from the server gputop-ui.js can manage some way of plotting the data on the traceview graphs as they are updated.

Please prod me to discuss more details on this if you get to looking at this before me.

Toolchain for maintaining HW/metrics/counter docs + presenting in UI

Note: this isn't focused on writting the documentation itself, but rather on being able to maintain and present documentation in the gputop UI

For the Gen graphics metrics to be of more practical use to developers we really need to improve how we document the metric sets and counters, including details of how the counter values are normalized and caveats/errata that may affect their interpretation.

Different users will have different levels of familiarity with Gen graphics hardware and depending on whether someone is profiling to optimize a game/application or the driver stack itself may affect what details are pertinent.

Considering how we're using python for codegen based on the gputop/oa-*.xml files I would currently propose we use reStructured text for maintaining extra docs - that or Markdown, which may be familiar to more people. One reason I'm thinking reStructured text might make more sense is that it has a well defined xml serialization so on the one hand we can use the ascii markup for writting the documentation but our tools for maintaining the oa-*.xml files could then support parsing and serializing the docs to xml and adding the docs to the oa-*.xml files to easily be shared between projects.

Just thinking aloud a.t.m, but from a maintainability pov, and to allow others to easily help improve the documentation, maybe it could be interesting to see if the documentation could be maintained on the github wiki and updating our meta-data toolchain to be able to pull updates from the wiki.

It's awkward a.t.m that our common toolchain for generating oa-*.xml files which are shared between projects currently private since it has to parse an internal-only description of counters. Ideally this documentation toolchain should be public. Maybe to start with we should implement this within gputop and figure out how to enable other projects to leverage the extra data later.

Summary of things to solve here

  1. come up with a maintainable scheme for writting per-gen, per-metric-set, per-metric and raw-counter documentation, that can provide an overview of how to interpret metrics for each Gen (including errata to beware of, or caveats about power management/clock gating constraints applied while capturing.
  2. Extend the python codegen toolchain to be able to process the documentation into whatever form is appropriate for presenting in gputop (probably converting to HTML)
  3. Extend the Web UI to have a documentation pane that can show the most contextually relevent documentation at any point in time. By default it would likely show the most general information about all metrics on the current platform, but the UI should allow selecting specific counters in the overview whereby the documentation pane would then describe that counter including rendering the normalization equation for the counter.

Considering how metrics can be normalized and derived from multiple raw counters, it would be good for the rendering of normalization equations to link through to the documentation for any referenced raw counters.

Support providing fake i915-perf counter data

As a part of being able to unit test non-hardware dependant parts of GPU Top, e.g. as part of the Travis CI build checks it would be helpful to be able to generate fake but deterministic counter data.

This issue would focus on i915-perf, system view metrics (as opposed to fake GL_INTEL_performance_query metrics)

This functionality could be enabled based on an environment variable like GPUTOP_FAKE_DATA=1 being set, and perhaps a corresponding --fake option could be supported by the gputop launcher.

Details

gputop-perf.c:gputop_perf_initialize() should skip trying to open a DRM render node and querying device/system info and instead of calling a per-gen query initialization function such as gputop_oa_add_queries_hsw() there could be a function like gputop_oa_add_queries_fake() instead.

Ideally the fake metrics should be as similar as possible to the real metrics, and it would probably be best to auto generate the gputop_oa_add_queries_fake() function similar to how the per-gen functions are generated via the gputop/oa-gen.py script.

Note: this work should take into account this issue to add support for querying which configs are supported by the kernel via sysfs since that will likely affect the details of how these configs are registered)

gputop-perf.c:gputop_open_i915_perf_oa_query() should skip opening an i915 perf stream from the kernel.

It could be best to aim to generate a stream of data that matches what would be read() from the kernel so that we can have some coverage of the parsing code in read_i915_perf_samples() when using fake data. Currently read_i915_perf_samples() is what calls read() to get data from the kernel so that should be the place to insert a fake_read() call to read some fake data in a compatible format.

The way collecting data from the kernel currently works, userspace adds the i915 perf stream file descriptor to the libuv mainloop via uv_poll_init() + uv_poll_start() which will internally use the Linux epoll() system call a way of getting the kernel to wake up userspace when data is ready to be read(). When data is ready the mainloop will call perf_ready_cb() which is what calls gputop_perf_read_samples() which calls the read_i915_perf_samples() (which should be hooked into as described above). Since this feature skips opening a stream file descriptor then gputop_open_i915_perf_oa_query() should make sure to install a periodic callback with uv_timer_init() and uv_timer_start() as a way to drive calls to gputop_perf_read_samples().

The i915 perf stream format

The stream is made of "records" that all have the same header:

struct i915_perf_record_header {
    uint32_t type;
    uint16_t pad;
    uint16_t size;
};

The only kind of records to worry about here are ones of type DRM_I915_PERF_RECORD_SAMPLE.

The header->size minus the sizeof(struct i915_perf_record_header) is the size of the immediately following sample payload.

The contents of the samples conceptually depends on what is requested via the properties given to the DRM_IOCTL_I915_PERF_OPEN ioctl (see gputop_open_i915_perf_oa_query), but at the moment it can be assumed that a sample only contains a single raw snapshot of Observation Architecture counters, which will be in one of two formats: I915_OA_FORMAT_A45_B8_C8 on Haswell or I915_OA_FORMAT_A32u40_A4u32_B8_C8 on Broadwell+

I915_OA_FORMAT_A45_B8_C8

Byte Offset Counter
0 Report ID / Reason
4 Timestamp
8 Undefined
12 Aggregate Counter 0
16 Aggregate Counter 1
20 Aggregate Counter 2
24 Aggregate Counter 3
28 Aggregate Counter 4
32 Aggregate Counter 5
36 Aggregate Counter 6
40 Aggregate Counter 7
44 Aggregate Counter 8
48 Aggregate Counter 9
52 Aggregate Counter 10
56 Aggregate Counter 11
60 Aggregate Counter 12
64 Aggregate Counter 13
68 Aggregate Counter 14
72 Aggregate Counter 15
76 Aggregate Counter 16
80 Aggregate Counter 17
84 Aggregate Counter 18
88 Aggregate Counter 19
92 Aggregate Counter 20
96 Aggregate Counter 21
100 Aggregate Counter 22
104 Aggregate Counter 23
108 Aggregate Counter 24
112 Aggregate Counter 25
116 Aggregate Counter 26
120 Aggregate Counter 27
124 Aggregate Counter 28
128 Aggregate Counter 29
132 Aggregate Counter 30
136 Aggregate Counter 31
140 Aggregate Counter 32
144 Aggregate Counter 33
148 Aggregate Counter 34
152 Aggregate Counter 35
156 Aggregate Counter 36
160 Aggregate Counter 37
164 Aggregate Counter 38
168 Aggregate Counter 39
172 Aggregate Counter 40
176 Aggregate Counter 41
180 Aggregate Counter 42
184 Aggregate Counter 43
188 Aggregate Counter 44
192 Boolean Counter 0
196 Boolean Counter 1
200 Boolean Counter 2
204 Boolean Counter 3
208 Boolean Counter 4
212 Boolean Counter 5
216 Boolean Counter 6
220 Boolean Counter 7
224 Custom Counter 0
228 Custom Counter 1
232 Custom Counter 2
236 Custom Counter 3
240 Custom Counter 4
244 Custom Counter 5
248 Custom Counter 6
252 Custom Counter 7

I915_OA_FORMAT_A32u40_A4u32_B8_C8

Byte Offset Counter
0 Report ID / Reason
4 Timestamp
8 Context ID
12 GPU Clock Ticks
16 40 bit Aggregate Counter 0 least significant 32 bits
20 40 bit Aggregate Counter 1 least significant 32 bits
24 40 bit Aggregate Counter 2 least significant 32 bits
28 40 bit Aggregate Counter 3 least significant 32 bits
32 40 bit Aggregate Counter 4 least significant 32 bits
36 40 bit Aggregate Counter 5 least significant 32 bits
40 40 bit Aggregate Counter 6 least significant 32 bits
44 40 bit Aggregate Counter 7 least significant 32 bits
48 40 bit Aggregate Counter 8 least significant 32 bits
52 40 bit Aggregate Counter 9 least significant 32 bits
56 40 bit Aggregate Counter 10 least significant 32 bits
60 40 bit Aggregate Counter 11 least significant 32 bits
64 40 bit Aggregate Counter 12 least significant 32 bits
68 40 bit Aggregate Counter 13 least significant 32 bits
72 40 bit Aggregate Counter 14 least significant 32 bits
76 40 bit Aggregate Counter 15 least significant 32 bits
80 40 bit Aggregate Counter 16 least significant 32 bits
84 40 bit Aggregate Counter 17 least significant 32 bits
88 40 bit Aggregate Counter 18 least significant 32 bits
92 40 bit Aggregate Counter 19 least significant 32 bits
96 40 bit Aggregate Counter 20 least significant 32 bits
100 40 bit Aggregate Counter 21 least significant 32 bits
104 40 bit Aggregate Counter 22 least significant 32 bits
108 40 bit Aggregate Counter 23 least significant 32 bits
112 40 bit Aggregate Counter 24 least significant 32 bits
116 40 bit Aggregate Counter 25 least significant 32 bits
120 40 bit Aggregate Counter 26 least significant 32 bits
124 40 bit Aggregate Counter 27 least significant 32 bits
128 40 bit Aggregate Counter 28 least significant 32 bits
132 40 bit Aggregate Counter 29 least significant 32 bits
136 40 bit Aggregate Counter 30 least significant 32 bits
140 40 bit Aggregate Counter 31 least significant 32 bits
144 32 bit Aggregate Counter 32
148 32 bit Aggregate Counter 33
152 32 bit Aggregate Counter 34
156 32 bit Aggregate Counter 35
160 40 bit Aggregate Counter 0 most significant 8 bits
161 40 bit Aggregate Counter 1 most significant 8 bits
162 40 bit Aggregate Counter 2 most significant 8 bits
163 40 bit Aggregate Counter 3 most significant 8 bits
164 40 bit Aggregate Counter 4 most significant 8 bits
165 40 bit Aggregate Counter 5 most significant 8 bits
166 40 bit Aggregate Counter 6 most significant 8 bits
167 40 bit Flexible, Aggregate EU Counter 7 most significant 8 bits
168 40 bit Flexible, Aggregate EU Counter 8 most significant 8 bits
169 40 bit Flexible, Aggregate EU Counter 9 most significant 8 bits
170 40 bit Flexible, Aggregate EU Counter 10 most significant 8 bits
171 40 bit Flexible, Aggregate EU Counter 11 most significant 8 bits
172 40 bit Flexible, Aggregate EU Counter 12 most significant 8 bits
173 40 bit Flexible, Aggregate EU Counter 13 most significant 8 bits
174 40 bit Flexible, Aggregate EU Counter 14 most significant 8 bits
175 40 bit Flexible, Aggregate EU Counter 15 most significant 8 bits
176 40 bit Flexible, Aggregate EU Counter 16 most significant 8 bits
177 40 bit Flexible, Aggregate EU Counter 17 most significant 8 bits
178 40 bit Flexible, Aggregate EU Counter 18 most significant 8 bits
179 40 bit Flexible, Aggregate EU Counter 19 most significant 8 bits
180 40 bit Flexible, Aggregate EU Counter 20 most significant 8 bits
181 40 bit Aggregate Counter 21 most significant 8 bits
182 40 bit Aggregate Counter 22 most significant 8 bits
183 40 bit Aggregate Counter 23 most significant 8 bits
184 40 bit Aggregate Counter 24 most significant 8 bits
185 40 bit Aggregate Counter 25 most significant 8 bits
186 40 bit Aggregate Counter 26 most significant 8 bits
187 40 bit Aggregate Counter 27 most significant 8 bits
188 40 bit Aggregate Counter 28 most significant 8 bits
189 40 bit Aggregate Counter 29 most significant 8 bits
190 40 bit Aggregate Counter 30 most significant 8 bits
191 40 bit Aggregate Counter 31 most significant 8 bits
192 Boolean Counter 0
196 Boolean Counter 1
200 Boolean Counter 2
204 Boolean Counter 3
208 Boolean Counter 4
212 Boolean Counter 5
216 Boolean Counter 6
220 Boolean Counter 7
224 Custom Counter 0
228 Custom Counter 1
232 Custom Counter 2
236 Custom Counter 3
240 Custom Counter 4
244 Custom Counter 5
248 Custom Counter 6
252 Custom Counter 7

On Broadwell+ the 32 bit Reason field bits 24:19 represent what triggered the report which userspace needs to check (and so it needs to be faked). This reason is represented with mutually exclusive flags:

Flag Bit Reason
0 Timer triggered sample
1 Internal report trigger 1
2 Internal report trigger 2
3 Context switch
4 GO transition from 1 to 0
5 Clock ratio change between squashed Slice Clock frequency and squashed Unslice clock frequency

The main reasons to fake will be 'Timer triggered sample', and perhaps 'Context switch'.

Cross reference with the code in read_i915_perf_samples() and gputop_perf_accumulate() for the details of what's expected when parsing the counter data as well as the normalization code that's generated by oa-gen.py in files like gputop/oa-hsw.c and gputop/oa-bdw.c

It probably makes sense to special case the faking of the Timestamp and GPU Clock Tick counters and then maybe all other counters might progress in the same predictable way.

_Note: Since it may be important to special case how the GPU Clock Tick counter is faked, some special care may be needed if trying to fake Haswell like data because on Haswell it varies between configurations as to which Boolean or Custom counter represents the GPU clock. For more details take a look at the code generated in oa-hsw.c and look at the various gpu_core_clocks_read() functions.

To start with it might be simpler to generate fake Broadwell+ like metrics.

Not considering _CTX_SWITCH reports on Gen8+

We recently looked at adding support for viewing per-context metrics captured via the i915 perf kernel interface directly, instead of via Mesa, but one oversight was that we aren't handling context-switch reports properly when parsing OA reports...

Gputop doesn't currently understand that it should skip accumulating when the first report is a non-context-switch report and the second is a context-switch report, as these context-switch reports only provide a new base for counters after other gpu contexts have been running.

gputop-perf.c:read_i915_perf_samples() should be updated to check the report reason field of OA reports (for >= Gen 8) and skip over the accumulation when the latest report was generated for a context switch, but make sure that the context switch report is referenced when accumulating the subsequent report later (I.e. track the context-switch report the 'last' report).

read_i915_perf_samples() probably needs to be updated something like:

case DRM_I915_PERF_RECORD_SAMPLE: {
    struct oa_sample *sample = (struct oa_sample *)header;
    uint8_t *report = sample->oa_report;

    if (stream->oa.last) {
        if (stream->per_context_mode && gputop_devinfo->gen >= 8) {
            uint8_t reason = report[foo] & REASON_MASK;

            if (reason != _CTX_SWITCH)
                current_user->sample(stream, stream->oa.last, report);
        } else {
            current_user->sample(stream, stream->oa.last, report);
        }
    }

    stream->oa.last = report;

    /* Make sure the next read won't clobber stream->last by
     * switching buffers next time we read */
    flip = true;
    break;
}

As a side note, we should consider plumbing support through for the remote ui too as we will also need to make a similar change to and gputop-web-worker.c:handle_oa_query_i915_perf_data() as above.

web: need to represent gaps in traced metrics from context switches

When enabling per-context mode there will be gaps in our received metrics corresponding to work executed for other gpu contexts than the one we're monitoring.

Firstly note that there are a few different sampling periods involved in our processing of metrics:

  1. The sampling period/exponent we program the OA unit with so the hardware writes our counter snapshots.
  2. The period which we aggregate raw reports over before triggering a UI update. The hardware sampling period has to be lower than the the update period.

Aggregation is done by taking sequential pairs of raw OA counter reports and calculating the deltas between raw counters and adding those to a 64bit accumulation buffer. The normalization equations are evaluated based on one of these 64bit accumulation buffers.

The parsing of OA reports done in gputop-web.c doesn't currently understand about OA reports that are generated in response to a context switch. Looking at gputop-perf.c:read_i915_perf_samples() shows how we do consider context switches in the code for presenting metrics in the ncurses UI.

If a context switch happens we need to immediately forward an update. (It's not a problem that we will have accumulated fewer reports at this point)

The rendering/updating of the trace graphs then needs to detect gaps between the start/end timestamps of sequential updates and if there's a gap it should draw some markers to represent the context switches.

web ui should be able to function with paranoid mode enabled

Now that we are able to do 'native' per-context queries through the web ui, it should still be functional while paranoid mode is enabled. i.e we should still be able to open per-context queries, even if the system-wide queries fail to open.

Demo Site: show progress while downloading gputop-web.js

gputop-web.js is currently > 1MB of JavaScript compiled via Emscripten and until that gets downloaded the demo can't show the lists of available metrics, but it doesn't give any indication that it's being downloaded.

An alternative to showing a progress, could be to see if we can instead download a compressed version of the file and find a small decompression client side decompression library.

Bootstrap Selenium based unit testing of remote protocols/UI + hook into Travis CI

Note: we've recently been considering the idea of using node.js for testing the remote protocol which should be able to share a lot of code with the web ui. It would probably be best to investigate simpler node.js based unit tests before looking into Selenium which would be more for testing the web ui itself.

I don't have any experience with Selenium so far, but it looks like a sensible starting point for being able to create unit tests for the web UI and - perhaps more importantly while there's barely much of a web UI too test yet - for the remote protocols.

I'd imagine we could have a test-ui.html + gputop-test.js that gets installed as an alternative to index.html + gputop-ui.js which wouldn't need to visualize anything but would exercise the protocols (JSON RPC + protocol buffers) involved in communicating between a device and web worker as well as between the front-end JS and web worker.

The code in gputop-ui.js can be referenced to see how the test should be able to interact with a device.

Note: It would probably be best to tackle this after gputop can generate fake, deterministic metrics as described in issue #15

This issue is about establishing the first unit test for the remote metrics protocols. A first test might open up a basic system wide metrics query and capture an overview of the metrics over one second and check that the received data is as expected.

The Travis Continuous Integration configuration (.travis.yml) should be updated to be able to run this first unit test routinely.

Be able to show GL metrics in web UI

Note: it's no longer clear how beneficial it is to expose GL_INTEL_performance_query metrics. In practice it seems we can get richer data directly from the kernel, and even support a filtered, single-context view of metrics without any api specific extensions

Note: this work would be based on the wip/rib/intel-perf-query branch which adds support for more GL performance queries, which should be pushed to master soon. For reference, some of the functions mentioned below only exist on this branch.

Currently the web UI only supports viewing system-wide metrics.

There's some protocol defined in gputop.proto for being able to describe the queries and counters supported by OpenGL for the browser, but where we describe features in gputop-server.c:handle_get_features() we don't currently initialize the description of GL queries + counters to be serialized.

gputop-web-worker.c:update_features() then needs to be able parse the description of GL queries/counters, and forward a description to the UI frontend.

From the UI frontend, when it knows that GL queries are available then it should be able to list the queries for the user and then if one of these is requested by the user it needs to be able to issue an "open_gl_query" rpc request to actually start collecting metrics from GL, similar to "open_oa_query".

Supporting an "open_gl_query" rpc method from the UI frontend implies implementing a gputop_webworker_on_open_gl_query() function within gputop-web-worker.c (it's going to be very similar to gputop_webworker_on_open_oa_query()).

For the web worker, gputop_webworker_on_open_gl_query() implementation to be able to ask the remote device to start collecting and forwarding GL metrics it should use send_pb_message() to send a 'Request' , OpenQuery protocol buffers message giving a gl_query ID as specified by the UI frontend.

Within gputop-server.c:handle_open_query() the switch() needs to be updated to match GPUTOP__OPEN_QUERY__TYPE_GL_QUERY and then call through to a new handle_open_gl_query() function that can then - similar to gputop-ui.c:gl_perf_query_tab_enter() - request gputop-gl.c to start capturing the requested metrics.

Once gputop-server.c is able to handle requests to open GL performance queries, then similar in some ways to code in gl_perf_query_tab_redraw() then gputop-server.c needs to be periodically checking for finished query data and forwarding the metrics on to the remote web worker. This would probably be done using periodic_forward_cb + hooking into flush_streams(), flush_stream_samples(), in much the same way as we forward raw perf data.

Similar to how the web worker can parse raw perf data, the web worker then needs to be able to parse the raw GL metrics. (See gputop-web-worker.c:gputop_webworker_on_message + probably adding a handle_gl_query_message() function) We already have code in gputop-ui.c for parsing the GL metrics so some of this code can hopefully be repurposed here.

The last steps are to forward the data in its final form for presentation to the frontend UI. At this point it could be good if we forward data in exactly the same way as for system-wide metrics, re-purposing the "oa_query_update" message that forward_query_update() currently assembles. (renamed)

Automatically list processes using the GPU in left pane

This would be a precursor for enabling pid based filtering of metrics, beyond the limited per-context filtering we support so far.

Based on the ability to capture batch buffer metrics using Sourab Gupta's (@sourabgu) extensions to the i915 perf kernel interface we can capture streams of metrics where the samples are tagged with a pid which in turn allows us to build up a list of processes that are actively using the GPU (and a list of contexts associated with each pid).

For reference: Sourab's kernel changes are maintained here:
https://github.com/sourabgu/linux

Anyone that looks at this can coordinate with Sourab and myself to check what branch of the kernel to work with, though I think we should aim to start including Sourab's changes under the wip/rib/oa-next branch which is currently what we point at in the gputop Build Instructions wiki page.

ui: could help to sort the toggles for filtering counters and give them tooltips

In GPA I think the Tier1 -> Tier4 tags get used to arrange counters in to a hierarchy and there is some particular logic to how counters are fit into this hierarchy. We should find out what that logic is so we can at least have a tooltip to explain what each 'TierX' toggle does, and maybe come up with a more intuitive aliases for each one. For now it could be good to just sort these Tier toggles so be adjacent and sequential.

Overall I would maybe order like: Overview, System, Frame, Batch, Draw, Indicate, Tier1-4

Don't assume the OA report reason = TIMER / CTX_SWITCH

gputop has only recently started considering CTX_SWITCH reports when parsing OA reports, but it would probably be prudent for gputop to explicitly check that the reason == TIMER in case we might unexpectedly be getting forwarded other types of reports and maybe accumulating counters incorrectly as a result.

A small tweak to the parsing code that perhaps logs a warning if any other reason besides TIMER or CTX_SWITCH are seen could be a good sanity check to have.

Bootstrap being able to collect metrics with Python based tools

Note: More recently, considering the on going web ui work, the idea has been to look at using node.js instead of Python so we can easily share code with the web ui.

Note: This should probably be done after #22

This would be a stepping stone towards removing/replacing the ncurses gputop-ui.c, and having all frontends be consistently based on the remote protobuf protocol instead.

Using python should offer a lot of convenience for developing more specialised frontends than the Web UI; e.g. for unit testing, for plotting one-off graphs, for logging frontends that might output in xml or CSV format and it would likely be nicer for maintaining a replacement for the ncurses UI too. Generally I'd expect it to be more convenient for prototyping / experimenting with new ways to visualize the performance data we can get, than it is writing everything in C.

ws4py seems like a good starting point for being able to connect to the gputop websocket from python

protoc --python_out should be able to generate the necessary code for packing/unpacking the protocol messages described in gputop.proto, and rules for this can be added to gputop/Makefile.am similar to how we generate files with protoc-c.

To deal with normalizing the counter metrics we could either consider extending gputop/oa-gen.py to be able to generate python normalization code, or otherwise (I guess probably the better approach) we should create a C binding for the generated oa-{hsw,bdw,chv,skl}.c code for normalizing metrics as well as the accumulation code.

Some details on how to create C bindings for Python can be found here.

Some of the apis here may also prove useful, e.g. for checking the header for each (binary) message read over the websocket, to be able to differentiate protobuf messages from raw metrics.

The code in gputop-web-worker.c would probably serve as the main reference for understanding the existing remote protocol.

A starting point here might be a tool written in python that can connect to a remote gputop server via a websocket and open a system wide metric set for one second, print the normalized values to stdout and close the metrics + exit.

This initial work can be in the form of a monolithic python script (and whatever is needed for the C bindings) with no need to come up with a nice module api design. We can figure out how to tidy things up and share code when writing more tools later.

ui: The 'Adjust Speed' slider should better explain what it does

There are number of sampling periods to be aware of here:

  1. the period programmed into the OA hardware determining how frequently it writes out raw reports which get forwarded to the remote ui
  2. the period over which raw reports are aggregated (a process of taking pairs of sequential raw reports, calculating the raw counter deltas and adding those deltas into a 64bit accumulation buffer)

This slider is currently affecting the second period (i.e it doesn't affect the frequency that the hardware samples metrics)

Note: The first period needs to be lower than the second otherwise there will be no pairs of raw reports within a single aggregation period.

We should probably not have a slider for this second period and instead we should have a way to change the 'Zoom' level on the trace graphs which changes the range for the x-axis (currently fixed at 10 seconds). This aggregation period should then always be derived based on the zoom of the graph so that we can get enough points to plot across the full range of the graph but that we avoid calculating more than one point per pixel, or per millimeter - which wouldn't be visible. (Except with the constraint that it can't be lower than the HW sampling period.)

Separately it might then be useful to have a slider that can affect the hardware sampling period so the ui is sent more or less raw data, and could have a range from ~1 microsecond - 0.5 second perhaps.

Better support for pausing metrics and being able to zoom into smaller details

Currently if we pause the capture of metrics then if we change the zoom level we loose the contents of the trace graphs.

There's currently also a threshold that stops us from zooming in to less than a one second range. For live data that seems like a reasonable limit since things would be flying by to fast to be useful any closer than that.

With data capture paused though then zooming in closer would certainly be interesting to see the details of what's happening within individual frames. The resolution we can capture metrics from the HW would certainly allow for a much closer zoom level than makes sense for the live view.

To start with I'd imagine that we could introduce client-side buffering of the websocket i915-perf messages and then while OA capturing is paused we'd replay these buffered messages in a loop.

Notably it's not really enough to just stop updating the series of data plotted on the graph since the process of aggregating metrics takes into account the current zoom level of the graph. A nice benefit to replaying buffered metrics like this is that the UI can continue to allow toggling of per-context filtering, or pid filtering when that is enabled later.

Something to keep in mind here is that we might later want to support server-side buffering, especially if we start allowing much higher hardware sampling frequencies where the bandwidth requirements may be too high.

Recommend Projects

  • React photo React

    A declarative, efficient, and flexible JavaScript library for building user interfaces.

  • Vue.js photo Vue.js

    🖖 Vue.js is a progressive, incrementally-adoptable JavaScript framework for building UI on the web.

  • Typescript photo Typescript

    TypeScript is a superset of JavaScript that compiles to clean JavaScript output.

  • TensorFlow photo TensorFlow

    An Open Source Machine Learning Framework for Everyone

  • Django photo Django

    The Web framework for perfectionists with deadlines.

  • D3 photo D3

    Bring data to life with SVG, Canvas and HTML. 📊📈🎉

Recommend Topics

  • javascript

    JavaScript (JS) is a lightweight interpreted programming language with first-class functions.

  • web

    Some thing interesting about web. New door for the world.

  • server

    A server is a program made to process requests and deliver data to clients.

  • Machine learning

    Machine learning is a way of modeling and interpreting data that allows a piece of software to respond intelligently.

  • Game

    Some thing interesting about game, make everyone happy.

Recommend Org

  • Facebook photo Facebook

    We are working to build community through open source technology. NB: members must have two-factor auth.

  • Microsoft photo Microsoft

    Open source projects and samples from Microsoft.

  • Google photo Google

    Google ❤️ Open Source for everyone.

  • D3 photo D3

    Data-Driven Documents codes.