rrag / react-stockcharts Goto Github PK
View Code? Open in Web Editor NEWHighly customizable stock charts with ReactJS and d3
Home Page: http://rrag.github.io/react-stockcharts
License: MIT License
Highly customizable stock charts with ReactJS and d3
Home Page: http://rrag.github.io/react-stockcharts
License: MIT License


Basically want to emulate something like this, to draw entries and exits onto a chart. I care mostly about the trend lines at the moment. I could end up having quite a few of these on a large chart, and am not sure how that would work with your auto scaling.
Regardless your package is awesome, and I love seeing that it is in active development.
I'm trying to download react-stockcharts from behind a corporate firewall..(so this may be a proxy issue)
the problem occurs when npm attempts to download from a github account
user@user-VirtualBox:~/react-flask$ npm install
npm WARN package.json [email protected] No repository field.
npm ERR! git clone --template=/home/user/.npm/_git-remotes/_templates --mirror git://github.com/exupero/saveSvgAsPng.git /home/user/.npm/_git-remotes/git-github-com-exupero-saveSvgAsPng-git-a9624716: Cloning into bare repository '/home/user/.npm/_git-remotes/git-github-com-exupero-saveSvgAsPng-git-a9624716'...
npm ERR! git clone --template=/home/user/.npm/_git-remotes/_templates --mirror git://github.com/exupero/saveSvgAsPng.git /home/user/.npm/_git-remotes/git-github-com-exupero-saveSvgAsPng-git-a9624716: fatal: unable to connect to github.com:
npm ERR! git clone --template=/home/user/.npm/_git-remotes/_templates --mirror git://github.com/exupero/saveSvgAsPng.git /home/user/.npm/_git-remotes/git-github-com-exupero-saveSvgAsPng-git-a9624716: github.com[0: 192.30.252.129]: errno=Connection timed out
Is there any workaround?
thanks!
I'm trying to get a <ChartCanvas /> re-render by changing its initialDisplay and interval props, however, the component doesn't react to these changes.
For comparison, if I change the width property, that does trigger a re-render every time.
Is this a bug, or intended behavior? If the latter, what is the preferred way of rendering a different fixed time interval for display on user interaction?
wait for this function, thanks a lot.
This issue will serve as a complete list of all the breaking API changes I am thinking about. Get feedback from users. Based on feedback and progress, this will be updated to keep current
The below changes are aimed at simplifying the internals, and provide a way to have indicators which depend on other indicators.
add a new prop calculate={[ Calculator1, Calculator2 ]} to the ChartCanvas, like so
<ChartCanvas width={...} height={...} ...
    calculator={[ { EMACalculator, MACDCalculator, RSICalculator } ]}
where
EMACalculator = ema()
  .window(12) // optional will default to 10
  .source(d => d.close) // optional will default to close as the source
  .merge((d, c) => {d.ema12 = c}) // Required, if not provided, log a error
  .yAccessor(d => d.ema12) // Required, if not provided, log an error during calculation
  .stroke("blue") // Optional

MACDCalculator = macd()
  .fastWindow(...) // optional will default to 12
  .slowWindow(...) // optional will default to 26
  .signalWindow(...) // optional will default to 9
  .source(d => d.close) // optional will default to close as the source
  .merge((d, c) => {d.macd = c});
ema, macd above will be provided by the library
add a prop yExtents to Chart which will take an array of functions, like so
<Chart id={...} ... yExtents={[ d => ([d.high, d.low]), d => d.ema12, d => d.sma100 ]}
Right now, the way the upper and lower bounds are calculated is by taking all the yAccessors of the DataSeries and finding the max and min values of them. yExtents will serve that purpose. If you want to fix the y domain between say 20 and 100 it can be achieved by yExtents={[ 20, 100 ]}
Remove DataSeries, Since the purpose of DataSeries is to provide a yAccessor or specify an indicator, and both these functions are moved to other components, this can be removed
All Series will take a mandatory yAccessor property. like so
<LineSeries yAccessor={d => d.ema12} />
most of the series can still define a default yAccessor e.g. CandlesticSeries will have the ohlc as the yAccessor
CurrentCoordinate and EdgeIndicator will now take a yAccessor instead of forChart={...} forDataSeries={...}. Since the forChart and forDataSeries props will be removed, this also means that the stroke and fill attributed cannot be auto derived by the component, but it can still be done
// Before
<CurrentCoordinate forChart={2} forDataSeries={0} />

// After
<CurrentCoordinate yAccessor={EMACalculator.yAccessor()} stroke={EMACalculator.stroke()} />
Tooltips will also take a yAccessor, Since many of the indicators, have their own tooltips, we can even do
// Before
<MACDTooltip forChart={3} origin={[-38, 15]}/>

// After
<MACDTooltip origin={[-38, 15]} calculator={MACDCalculator} />
With this change, dataTransform and calculator props on <ChartCanvas ... > seem redundant, they can be combined. so we can drop dataTransform
Might as well move CurrentCoordinate and EdgeContainer EdgeIndicator inside the Chart. Have to see if this will bring any performance issues. This way we no longer refer to a chart and series by numbers
add props xAccessor={d => d.date} xExtents={[ leftDate, rightDate ]} xScale={stockscale} to ChartCanvas this will
EDIT: Added removal of dataTransform prop and moving CurrentCoordinate and EdgeContainer EdgeIndicator inside Chart
EDIT: add props xAccessor, xExtents and xScale to ChartCanvas
Console output:
DataTransform.componentWillReceiveProps
bundle.js:83508 Uncaught TypeError: Cannot read property 'config' of undefined
This is the line:
var beginIndex = _utilsUtils2["default"].getClosestItemIndexes(dataForInterval, mainChartData.config.accessors.xAccessor(plotData[0]), mainChartData.config.accessors.xAccessor).left;
This is the code:
            <ChartCanvas width={this.state.width} height={400} margin={{left: 35, right: 50, top:10, bottom: 30}}
                         data={candles}>
              <DataTransform transformType="stockscale">
                <Chart id={1}>
                  <XAxis axisAt="bottom" orient="bottom" ticks={6}/>
                  <YAxis axisAt="left" orient="left" ticks={5}/>
                  <DataSeries yAccessor={CandlestickSeries.yAccessor} xAccessor={(d) => d.date}>
                    <CandlestickSeries />
                  </DataSeries>
                </Chart>
              </DataTransform>
            </ChartCanvas>
and this is my superagent rest call:
    request
      .get(config.api_url + '/candles')
      .accept('application/json')
      .query({
        start: start.format(),
        end: end.format(),
        granularity: granularity
      })
      .end(function (err, res) {
        if (res.ok) {
          var data = res.body;
          var candles = [];
          data.map(d => {
            candles.push({
              date: new Date(d.timestamp),
              open: d.open,
              high: d.high,
              low: d.low,
              close: d.close,
              volume: d.volume
            });
          });
          this.setState({candles: candles});
        }
}.bind(this));is it possible to flip histogram ?

TypeError: Cannot read property 'findDOMNode' of undefined
at componentDidMount (react-stockcharts.js?:9904)
Sorry..still having trouble getting this to work -.-**
Since I have a proxy issue with one of the dependencies, the npm install react-stockcharts times out.
Now, I am trying to do git clone, and then run npm install and then npm build inside the package. Unfortunately, I am getting this error now:
ERROR in ./src/index.js
Module parse failed: /home/clacey/react-flask/node_modules/react-stockcharts/src/index.js Line 4: Unexpected token
You may need an appropriate loader to handle this file type.
|
| // common components
| import ChartCanvas from "./lib/ChartCanvas";
| import Chart from "./lib/Chart";
| import DataSeries from "./lib/DataSeries";
I have looked at the webpack and it has babel specified as a loader for .js and .jsx files, so I'm a little confused ..
I'm following the example, and trying to split up the code according to how it would look in my application, but I can't see anything.
here's a plunker of what I'm trying to do:
http://plnkr.co/edit/diQDOcNwz547R4hObWMG?p=preview
I am a n00b..please help!
ref="chartCanvas" - unavailable for Kagi Transformation
TypeError: Cannot read property 'idx' of undefined (When try to update data (using update example ) )
for example:

Hello rrag and everyone, I have a some problems with candlestick chart.
As template I took the settings from
<HistogramSeries fill={(d) => d.close > d.open ? "rgba(0,166,81,0.5)" : "rgba(204,36,36,0.5)"}/>
it's work nice!
But if I take the following code (CandlestickSeries)
<CandlestickSeries widthRatio={(d) => d.volume > 0 ? 0.5 : 0} />
not working ((
But this:
<CandlestickSeries widthRatio={0} />
working!
What I'm doing wrong? (
Just had a question, is there currently support for theming (changing chart appearance)?
If it is available can you point me in the right direction? This would be a great addition to the docs.
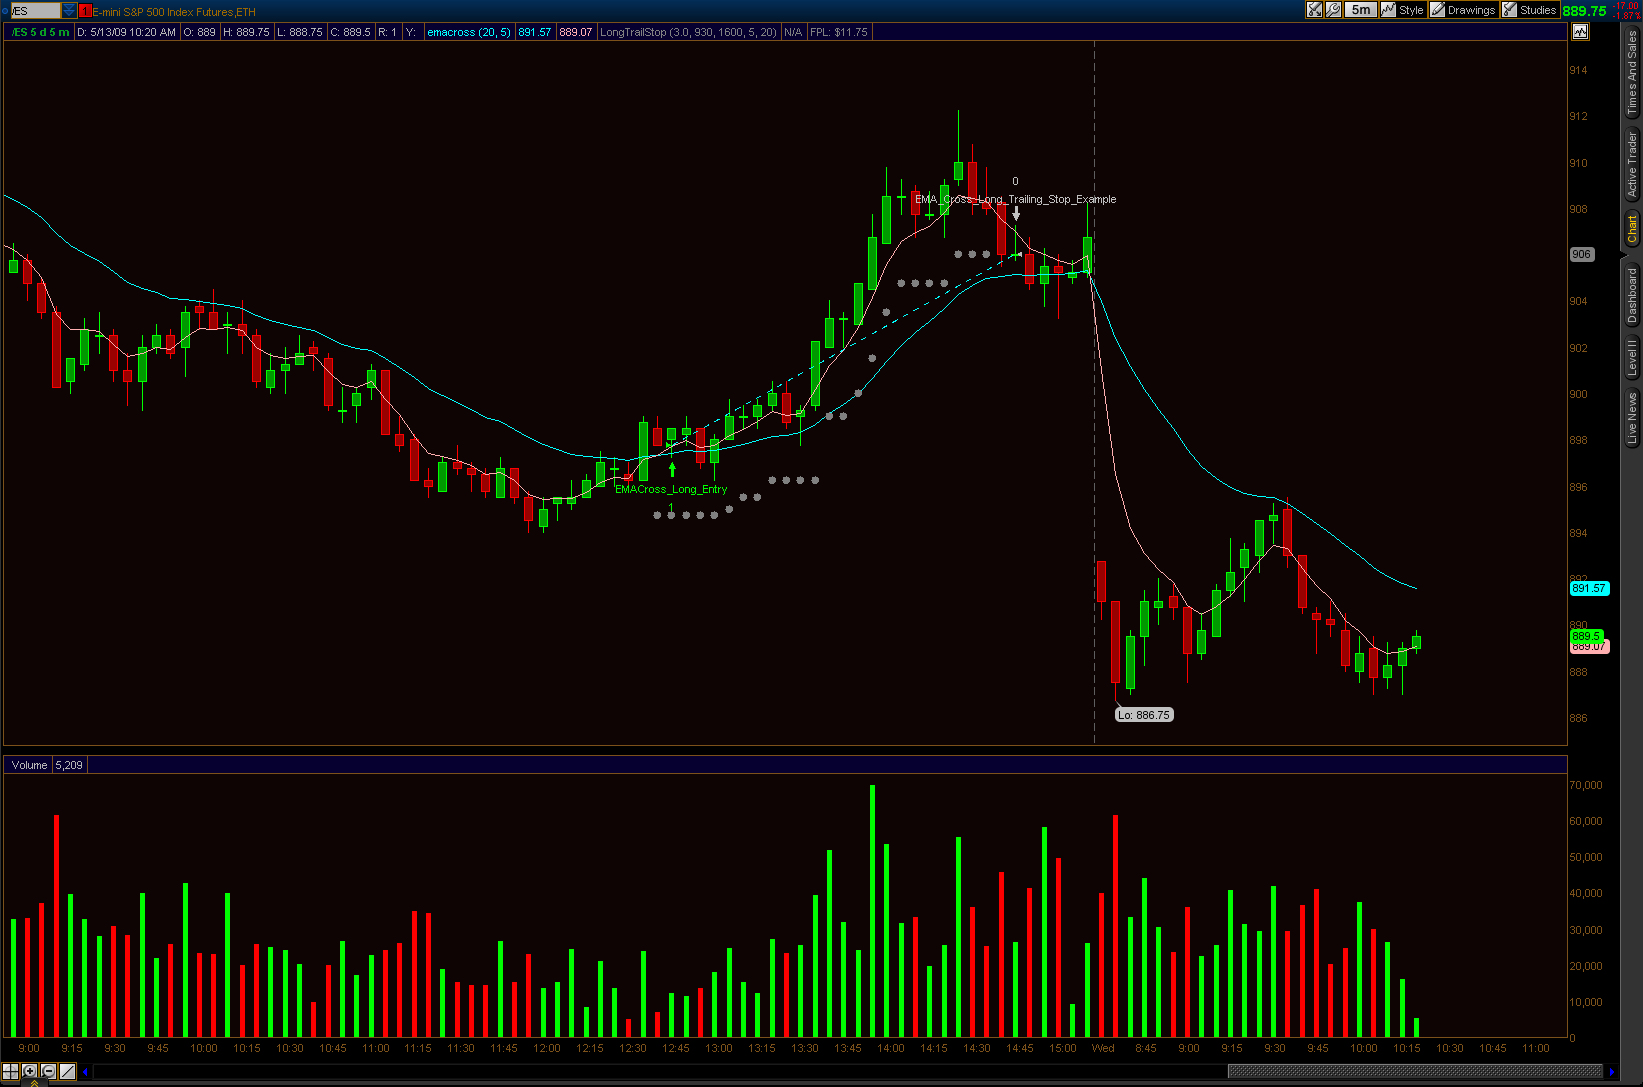
As an example, it would be cool to be able to recreate charts like Think or Swim:
http://business.fiu.edu/capital-markets-lab/thinkorswim2.jpg
OR
https://readtheprospectus.files.wordpress.com/2009/05/trailingstopexample51309.png
Just something to think about.
is it possible to label the axis? ex:

A runtime error happens when I try to load the following code that worked in 0.1.6
<ChartCanvas width={this.state.width} height={400} margin={{left: 35, right: 50, top:10, bottom: 30}}
                         data={candles}>
  <Chart id={1}>
    <XAxis axisAt="bottom" orient="bottom" ticks={6}/>
    <YAxis axisAt="left" orient="left" ticks={5}/>
    <DataSeries yAccessor={CandlestickSeries.yAccessor} xAccessor={(d) => d.date}>
      <CandlestickSeries />
    </DataSeries>
  </Chart>
</ChartCanvas>ChartWidthMixin.js:28
Warning: React.findDOMNode is deprecated. Please use ReactDOM.findDOMNode from require('react-dom') instead.
For my histogram values < 0, I would like to "flip" them so that they start drawing from 0 down towards the x-axis. I can see this kind of behavior in the MACD charts, but not sure how to do this with the Histogram. I tried direction={(d) => d.volume > 0 ? "up":"down"} but it didn't seem to work.
ex: http://i.stack.imgur.com/VuIY5.png
thanks a ton!!
<3 your charts.
Hi, i don't know how to use http://rrag.github.io/react-stockcharts/documentation.html#/updating_data, maybe you can give live examples?
Hello !
I'm currently using react-stockcharts for a big professional projet to display data sent via WebSocket. I particulary need LineSeries, and I am working with DataSeries. I'm fairly new to Javascript (and thus D3JS, React) programming, and i have some questions:
Here I want my Y axis to be limited to the value 10 :
yAccessor={(d) => d["value"] > 10? undefined : d["value"]}
I hope I was not confusing, English is not my native language.
Thanks.
Hi!
how i could change default color (black) of axis ?
Only if this possible.
There are news on US market(earnings, conference calls, etc.)
Show you chart for example:

On hover I get information about news:

Usually configurations:
Earning:
Conference calls:
Custom news:
For icons will be the best suited font:
https://fortawesome.github.io/Font-Awesome/
https://icomoon.io/app/#/select
or other...
Uncaught TypeError: Cannot read property 'firstChild' of undefined
Rather than installing react as a dependency, add it as a peer dependency.
E.g.
  "peerDependencies": {
    "react": ">=0.13.3 || ^0.14.0-beta3"
  },
As I can have several Y axis, I want the user to be able to know the X and Y values of the point nearest to his mouse. For this :
Here are some screenies of what I partially did in my fork repo, and a chart which can display this is http://localhost:8090/documentation.html#/edge_coordinate


As you can see here, the pink curve is related to JCVD axis, and the blue points are related to Theodorus
Now it shows only dates and i can't set custom format.
PS thanks for great work!
I can't move chart and zoom from mobile device.
It's supported at all?
I get the following error when using v0.2.0 of react-stockcharts. As a work around, I've added save-svg-as-png as a dependency in my project.
ERROR in ./~/react-stockcharts/lib/helper/SaveChartAsImage.js
Module not found: Error: Cannot resolve module 'save-svg-as-png' in react-stockcharts/lib/helper
 @ ./~/react-stockcharts/lib/helper/SaveChartAsImage.js 3:16-42
As far as I know you are planning to demonstrate an example of custom dataTransform, and custom indicator documentation.
Could you for example, use the graph type market depth. I tried to encode similar but it didn't work.
Calculation Force Index
Force Index(1) = {Close (current period) - Close (prior period)} x Volume
Force Index(13) = 13-period EMA of Force Index(1)
more:
http://stockcharts.com/school/doku.php?id=chart_school:technical_indicators:force_index
Elder Ray:
Bull Power = Daily High - n-period Exponential Moving Average (EMA)
Bear Power = Daily Low - n-period EMA
http://d3fc.io/playground/playground.html?example=components/indicator/elderRay
First off let me just say great work on this library!
I work on a decentralized crypto currency exchange Bitshares where I've used Highstock to build the trading graphs, but I hope to replace it with this library asap.
I've made some basic progress using your docs (which are awesome btw), but I have this weird styling issue in Chrome that I can't quite figure out. It works fine in Firefox, and your examples also have the correct styling in Chrome, but in my own implementation all the svg styling attributes get ignored. Here's a screenshot of what it looks like in Chrome:
https://github.com/cryptonomex/graphene-ui

And in Firefox:

Any idea what's going on here?
My code is here: https://github.com/cryptonomex/graphene-ui/blob/react-stockcharts/web/app/components/Exchange/PriceChartD3.jsx
node_modules/react-stockcharts/lib/tooltip/OHLCTooltip.js:200:16react-stockcharts version - ^0.3.0
d3 npm is installed.
I need to implement custom ticks format for XAxis. it should looks like:
| format | |||
|---|---|---|---|
| tick time - current time | 60 | 40 | 20 |
| tick time | 12:47:00 | 12:47:20 | 12:47:40 |
What should I do? Implement my own polylineartimescale and StockscaleTransformer ?
This project is awesome, great work!
Just wanted to ask a few questions.
It appears (and I could be wrong) on each of the examples the data is assumed to have open/high/low/close information.
Would love to see additional documentation on how all the components connect/work together. On your roadmap you mark some of that so perhaps it's coming. Again awesome stuff!
Is it possible to use component with new data? Let's say I want to update graph every second. If yes, then how to update it. Because right now I'm getting a mess with xAxis. Also how to make graph follow updates and always show the new data in the viewport?

There's an Error occurred, when you want to build lib with Browserify:
[Error: Cannot find module 'lib/utils/PureComponent' from '....../node_modules/react-stockcharts/lib']
In many files you use
import PureComponent from 'lib/utils/PureComponent'But should use relative paths (because Browserify try to find lib package):
import PureComponent from './utils/PureComponent'I am building a dashboard and first: this library is incredible, congratulations on delivering such a high quality project.
I'm looking for have multiple different graphs linked together. I'd like to select a value on one and have it then show more data on that in another, different graph.
This library looks like it's focused on showing a single series of data which is great. I'd probably plug in a different chart library for some simple pie/line/bar graphs that I could show the detailed data on separately.
My question is, is there a callback to get the Y value on click?
Is there a way to adjust the margins so that the first and last candlestick bars are fully displayed?
It's especially noticeable when showing a small number of candles.
As said here, just don't know when will this be implemented or where to track.
Based on http://www.html5rocks.com/en/tutorials/canvas/performance/
ctx.globalAlpha to set opacity, use the rgba format for color. This avoids changing the stateLine to evaluate improvementI have jQuery as a dependency in my package.js. It appears window.$ isn't bound
Working on this now, Looking for feedback,
Might lead to new features implemented on the real project
Hi,
how i could change default font size, color etc. on xAxis, yAxis ?
Hello! There is some bugs with "updating data example":
I've tried to record it:

Is there some ways to fix it?
Any workaround for using the ChartWidthMixin in es6/es7 classes? Do you recommend say, https://www.npmjs.com/package/react-mixin-decorator ?
Could you provide additional element for all type of charts - stock grid?
Within the graph a grid of lines may appear to aid in the visual alignment of data. The grid can be enhanced by visually emphasizing the lines at regular or significant graduations. The emphasizing lines are then called major grid lines and the remainder are minor grid lines.
Once the chart is rendered the first time it won't update with new data. I can force it by removing the child dom nodes but I'm thinking that's a hack and defeats the purpose of using react.
I've created an example to illustrate the issue here.
do you support OHLC charts?
A declarative, efficient, and flexible JavaScript library for building user interfaces.
🖖 Vue.js is a progressive, incrementally-adoptable JavaScript framework for building UI on the web.
TypeScript is a superset of JavaScript that compiles to clean JavaScript output.
An Open Source Machine Learning Framework for Everyone
The Web framework for perfectionists with deadlines.
A PHP framework for web artisans
Bring data to life with SVG, Canvas and HTML. 📊📈🎉
JavaScript (JS) is a lightweight interpreted programming language with first-class functions.
Some thing interesting about web. New door for the world.
A server is a program made to process requests and deliver data to clients.
Machine learning is a way of modeling and interpreting data that allows a piece of software to respond intelligently.
Some thing interesting about visualization, use data art
Some thing interesting about game, make everyone happy.
We are working to build community through open source technology. NB: members must have two-factor auth.
Open source projects and samples from Microsoft.
Google ❤️ Open Source for everyone.
Alibaba Open Source for everyone
Data-Driven Documents codes.
China tencent open source team.