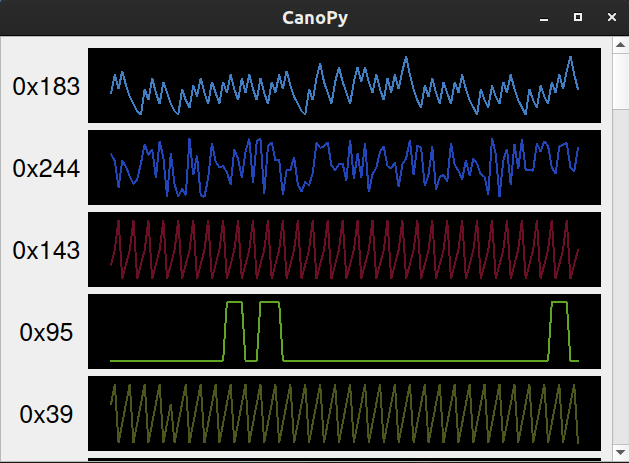
Canopy is a visualization tool for plotting CAN bus message payloads.
$ git clone https://github.com/Tbruno25/canopy
# cd into the /canopy directory
$ pip install -r requirements.txtEdit config.py with the corresponding settings for your adapter. Refer to the python-can docs for more info.
Run canopy.py to view a real time plot for each id.
Press i on your keyboard to ignore all currently displayed id's.
Use arrow up or arrow down to adjust message buffer size.