GithubHelp home page GithubHelp logo

schiegl / quickplot Goto Github PK

View Code? Open in Web Editor NEW
84.0 14.0 11.0 5.71 MB

Quick and easy data visualizations with Haskell

License: GNU General Public License v3.0

Haskell 3.66% HTML 0.32% JavaScript 94.09% CSS 1.93%
visualization-library data-visualization haskell

quickplot's Introduction

QuickPlot

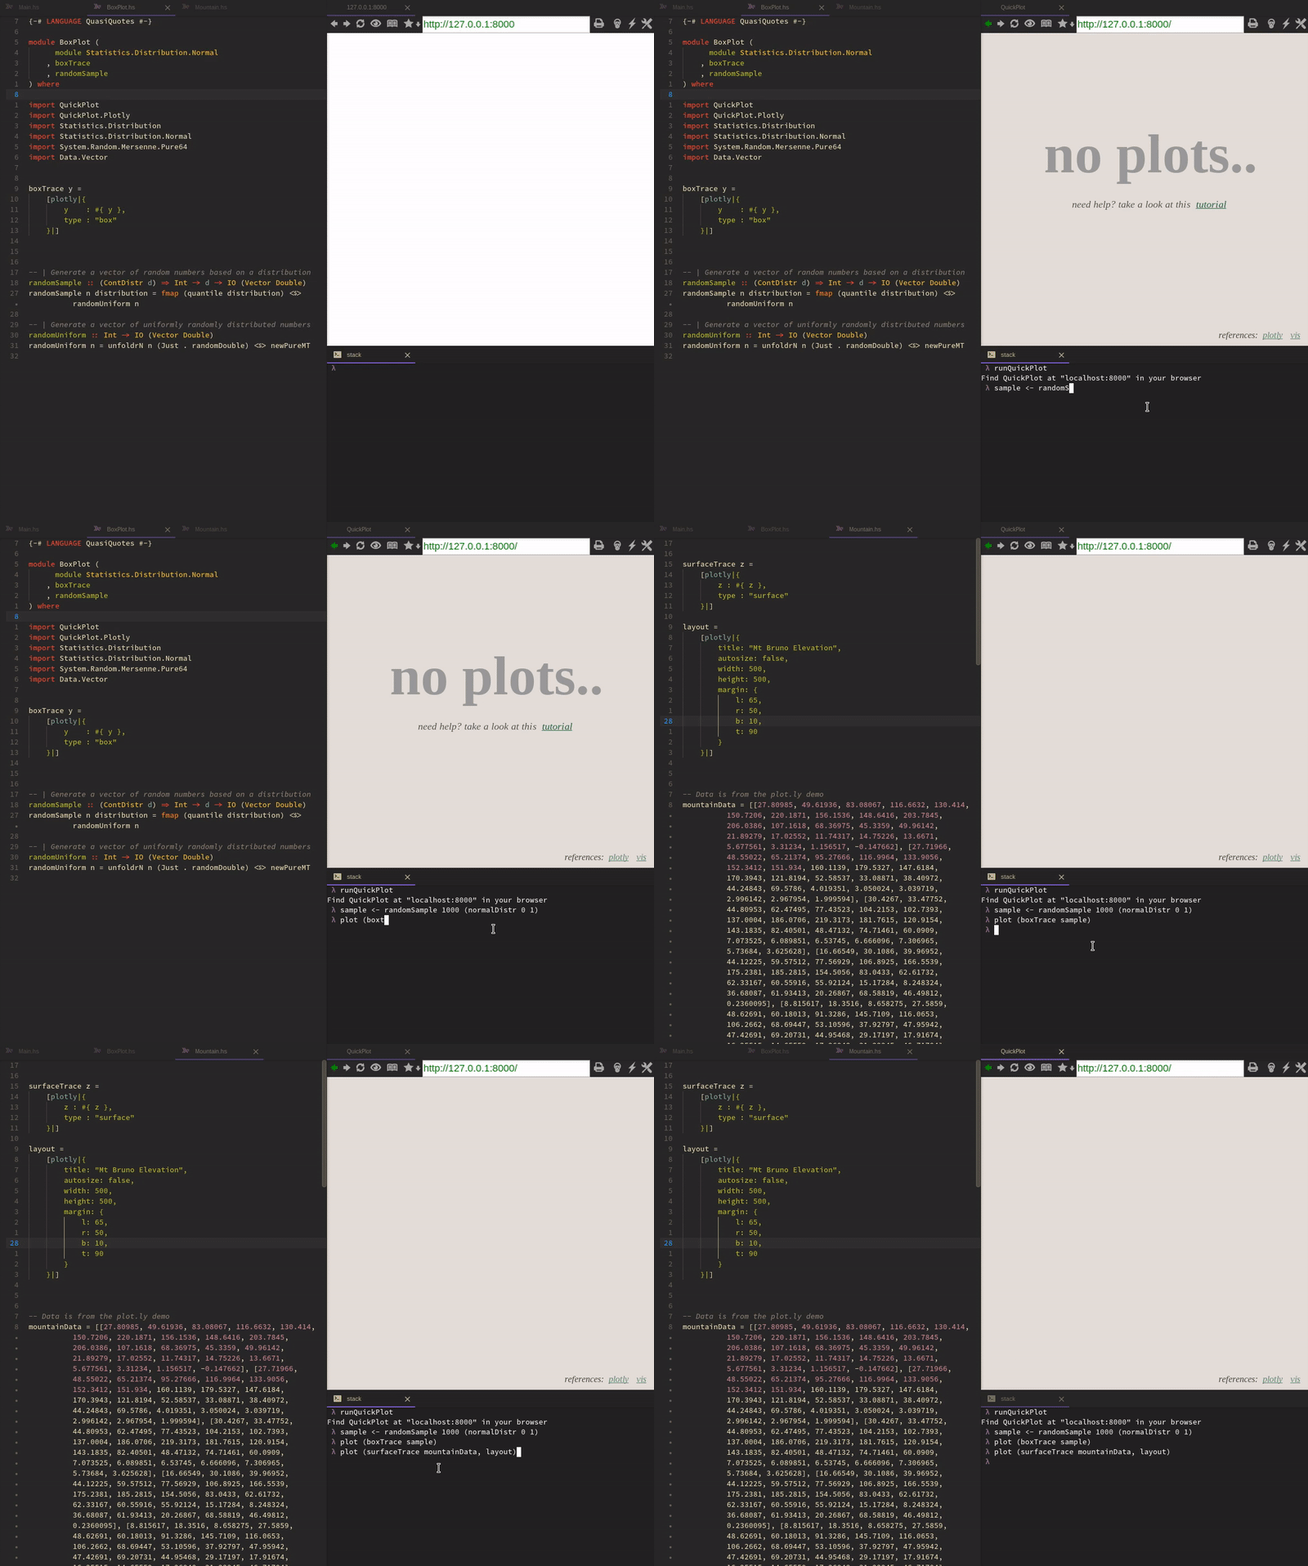
QuickPlot Demo

This project is no longer maintained

Since the demand of data visualization has been getting bigger many language agnostic libraries popped up. It would be much more efficient to just write clients for their visualization servers.

How does it work?

Haskell creates a simple server that runs in the background and sends data to a browser that visualizes it. In the demo above the browser and ghci runs inside Atom, but you can use any editor (even butterflies) with a fairly modern browser. Once the data arrives at the browser any JavaScript visualization library could take care of it like for example plot.ly

How do I use it?

QuickPlot was designed to make interactive data exploration easier. So the following won't make much sense outside of ghci

0. Install QuickPlot

stack install QuickPlot
cabal install QuickPlot
-- or manually

1. Import QuickPlot

import QuickPlot
import QuickPlot.Plotly -- if you want to use the plotly library

2. Start QuickPlot

runQuickPlot

3. Connect to QuickPlot

Go to the address runQuickPlot printed

4. Plot

Here is the less verbose version of the full example:

-- As box aficionados we just measured the weight of all our boxes at home
-- and gathered the following data
blueBoxSizes   = [1.1, 1.8, 2.9, 3.3] :: [Double]
orangeBoxSizes = [3.1, 3.8, 5.9, 2.3] :: [Double]

-- We create traces from our data
blueBoxTrace = [plotly|{
      y    : #{ blueBoxSizes },
      type : "box"
}|]
orangeBoxTrace = [plotly|{
      y    : #{ orangeBoxSizes },
      type : "box"
}|]

-- And finally gain great insight from the data visualization
plot [blueBoxTrace, orangeBoxTrace]

FAQ

Does it work on X?

Probably yes. If your browser supports WebSockets, HTML5, CSS3 you'll be fine. If not please update your browser. Find out more about here

Can you implement library X?

If the library takes JSON as an input, submit an issue. Libraries like D3.js are problematic however. Graphs in D3 are created programatically and therefore you can't just pick a graph type and say plot it. You have to create them from scratch. If there are examples that give you goosebumps it is possible to integrate them separately. Or you just include it as a user script yourself (once this is implemented)

How can I help?

There are many ways to do so:

  • If you know JavaScript/HTML/CSS you could make the UI prettier, more user friendly or easier extensible
  • Implement a visualization library in JavaScript

Can this library only use JavaScript libraries?

Technically any library that Haskell can convice to create graphics is compatible.

quickplot's People

Stargazers

 avatar  avatar  avatar  avatar  avatar  avatar  avatar  avatar  avatar  avatar  avatar  avatar  avatar  avatar  avatar  avatar  avatar  avatar  avatar  avatar  avatar  avatar  avatar  avatar  avatar  avatar  avatar  avatar  avatar  avatar  avatar  avatar  avatar  avatar  avatar  avatar  avatar  avatar  avatar  avatar  avatar  avatar  avatar  avatar  avatar  avatar  avatar  avatar  avatar  avatar  avatar  avatar  avatar  avatar  avatar  avatar  avatar  avatar  avatar  avatar  avatar  avatar  avatar  avatar  avatar  avatar  avatar  avatar  avatar  avatar  avatar  avatar  avatar  avatar  avatar  avatar  avatar  avatar  avatar  avatar  avatar  avatar  avatar  avatar

Watchers

 avatar  avatar  avatar  avatar  avatar  avatar  avatar  avatar  avatar  avatar  avatar  avatar  avatar  avatar

quickplot's Issues

QuickPlot broken on stackage lts-8.0

After fixing dependency issues with extra-deps of snap, heist, and map-syntax, QuickPlot still fails to build.

$ stack install QuickPlot
...
--  While building package QuickPlot-0.1.0.1 using:
      /Users/christian/.stack/setup-exe-cache/x86_64-osx/Cabal-simple_mPHDZzAJ_1.24.2.0_ghc-8.0.2 --builddir=.stack-work/dist/x86_64-osx/Cabal-1.24.2.0 build --ghc-options " -ddump-hi -ddump-to-file"
    Process exited with code: ExitFailure 1
    Logs have been written to: /Users/christian/.stack/global-project/.stack-work/logs/QuickPlot-0.1.0.1.log

    Configuring QuickPlot-0.1.0.1...
    Building QuickPlot-0.1.0.1...
    Preprocessing library QuickPlot-0.1.0.1...
    [1 of 8] Compiling QuickPlot.IPC.QQParser ( src/QuickPlot/IPC/QQParser.hs, .stack-work/dist/x86_64-osx/Cabal-1.24.2.0/build/QuickPlot/IPC/QQParser.o )
    [2 of 8] Compiling QuickPlot.IPC.QQ ( src/QuickPlot/IPC/QQ.hs, .stack-work/dist/x86_64-osx/Cabal-1.24.2.0/build/QuickPlot/IPC/QQ.o )

    /private/var/folders/f0/n69q86k12r71r80pvsv4cyzm0000gn/T/stack58020/QuickPlot-0.1.0.1/src/QuickPlot/IPC/QQ.hs:30:10: error:
        Duplicate instance declarations:
          instance Lift Value -- Defined at src/QuickPlot/IPC/QQ.hs:30:10
          instance Lift Value
            -- Defined in ‘aeson-1.0.2.1:Data.Aeson.Types.Internal’

options of the chart

Is it possible to custom the chart such as adding title, (x|y)axis title or legend options ?

Taking this example:
boxLine x y = do
let box = [plotly|{
x : #{ x },
y : #{ y },
type : "lines"
}|]
return box

How do you add a title, a legend (label of the curve) ?

Is it possible right now or the library needs more development/help ?

Thanks in advance for your answer and your great work

vis visualizations don't work

All of them except the network ones. It complaints that the number of lines it is allowed to draw is too limiting.

"many language agnostic libraries popped up"?

Not sure if this is best posted here as an issue, but you mention that you've stopped maintaining this library because many other language agnostic libraries have arisen.

Could you give some examples of such libraries? And do any projects already exist for clients of their visualization servers?

How would you recommend someone trying to create plots with Haskell do so given the current environment?

Better UI and plot management

If someone knows JavaScript well I'd be happy if they would implement better plot management. By that I mean, closing, moving, resizing and so on. Being able to easily add control elements like sliders and so on. So far I have coded everything by hand and while possible it's tiresome.

I imagine that some UI framework would be useful but my JS skills are old school and I don't know any.

Make available on Hackage

I will make it available on Hackage once QuickPlot can be used reasonably. Until then it's only available to developers.

Server has problems when user refreshes the browser

When the user refreshes the tab the websocket connection doesn't close immediately. Then messages from the channel MVar are accessed by 2 websocket threads and sent to each of the 2 websockets. It appears as only every second message arrives at the browser.

Recommend Projects

  • React photo React

    A declarative, efficient, and flexible JavaScript library for building user interfaces.

  • Vue.js photo Vue.js

    🖖 Vue.js is a progressive, incrementally-adoptable JavaScript framework for building UI on the web.

  • Typescript photo Typescript

    TypeScript is a superset of JavaScript that compiles to clean JavaScript output.

  • TensorFlow photo TensorFlow

    An Open Source Machine Learning Framework for Everyone

  • Django photo Django

    The Web framework for perfectionists with deadlines.

  • D3 photo D3

    Bring data to life with SVG, Canvas and HTML. 📊📈🎉

Recommend Topics

  • javascript

    JavaScript (JS) is a lightweight interpreted programming language with first-class functions.

  • web

    Some thing interesting about web. New door for the world.

  • server

    A server is a program made to process requests and deliver data to clients.

  • Machine learning

    Machine learning is a way of modeling and interpreting data that allows a piece of software to respond intelligently.

  • Game

    Some thing interesting about game, make everyone happy.

Recommend Org

  • Facebook photo Facebook

    We are working to build community through open source technology. NB: members must have two-factor auth.

  • Microsoft photo Microsoft

    Open source projects and samples from Microsoft.

  • Google photo Google

    Google ❤️ Open Source for everyone.

  • D3 photo D3

    Data-Driven Documents codes.