This repository provides a Matlab-based software project that will be used in the lecture "Illumination-invariant image processing" in the course "Automotive Sensors and Actuators (ASAA)" in the summer term 2024. The presented slides can be found either in Teach Center or in this repository.
The provided software can be used to address robust (with respect to different lighting situations) segmentation, e.g. to identify a potentially drivable area in front of a car. Furthermore, we demonstrate the application of the pinhole camera model to determine the distance of an object identified (using YOLOV4/Darknet) in front of the camera. Assuming that the object fits in the ground plane (Z=0), we can estimate the distance (X, Y) of the object (from pixel) with a monocular camera system. In addition, by means of a so-called color-model, we segment defined colored objected in the image.
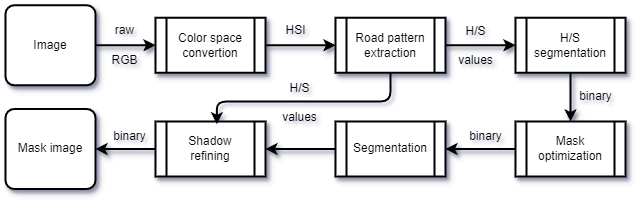
The goal of road segmentation is to identify and segment areas in front of the vehicle with the same color information that was taken from a sample in front of the vehicle. This segmentation follows the flowchart below. However, we will not implement shadow refinement in this software project.
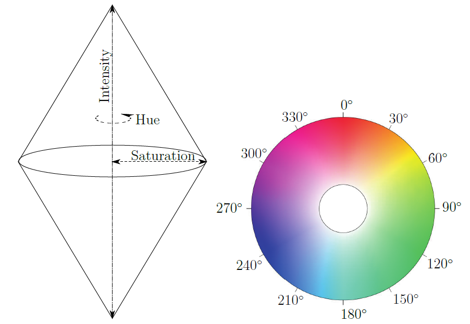
The color space (HSI) which builds from Hue, Saturation and Intensity is used. It is determined according to Sotelo et al. as the follows:
The aim of this color space conversion is to display chromaticity and saturation on the known color wheel. The intensity is represented as the height of the resulting double-peaked cone.
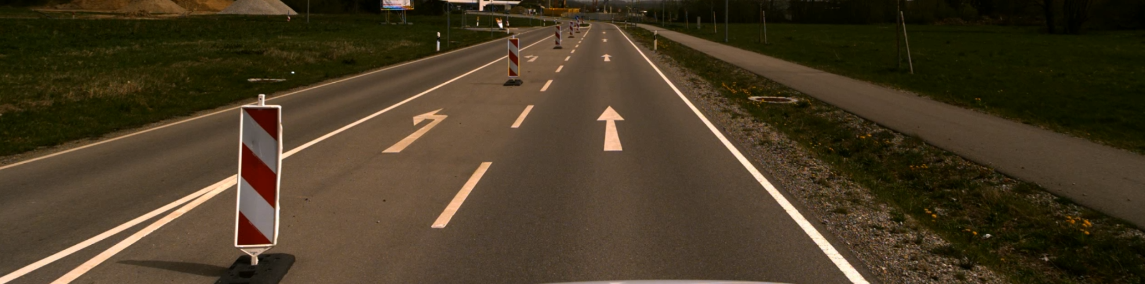
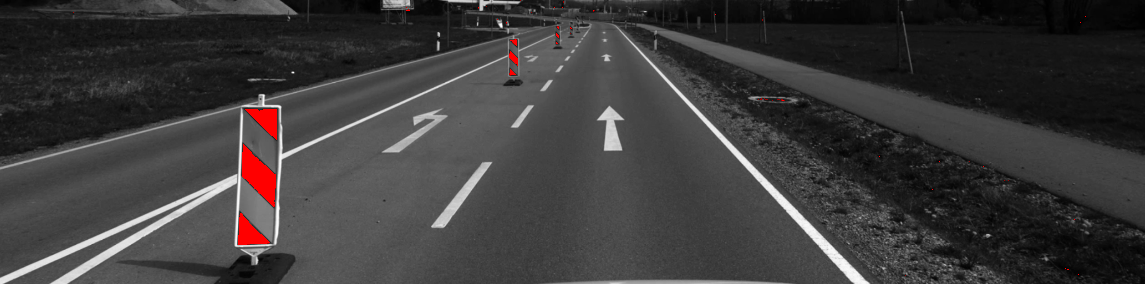
The road color pattern is extracted in an region of interest (ROI) in front of the vehicle, defined as
300, 80, 550
whereby 300 represents the width, 80 the height of the region and 550 the offset from the image bottom in pixel.
Probability-based color segmentation applies the above idea by segmenting image areas according to their color information. For this purpose, a color model is created that represents the 2D chromaticity plane of the HSI color space. The color model thus results in a grayscale image with the dimension 360 x 100 px, since the hue values are given by $0 \ldots 360 $ deg and the saturation values by $0 \ldots 100 $ %. It is generated by averaged color samples. The implementation is given in ./src/colormodel.m.
The color model is generated using color samples by extracting the averaged saturation and chroma for each sample and voting for the extracted color value at the appropriate point on the empty color model. Subsequent blurring using Gaussian produces the following example color model for the color red, generated from 20 color samples.

The occurrence frequency can be represented in the 3D plane as follows:

The application of the color model is correspondingly simple. For each pixel
for the respective pixel in the image. The corresponding call in Matlab looks like:
mask(i, j) = cm(H(i, j), S(i, j));
The result is a greyscale mask whose normalized values between 0 and 1 correspond to the membership probability for
A result of the applied segmentation is given below.
All functions are implemented and tested using either Matlab 2024a or Python 3.8.19.
