seansobey / chartjsnodecanvas Goto Github PK
View Code? Open in Web Editor NEWA node renderer for Chart.js using canvas.
License: MIT License
A node renderer for Chart.js using canvas.
License: MIT License


![dependabot[bot] avatar](https://avatars.githubusercontent.com/in/29110?v=4 "dependabot[bot]")


const chartJsFactory = () => {
    const Chart = require('chart.js');
    require('chartjs-plugin-datalabels');
    delete require.cache[require.resolve('chart.js')];
    delete require.cache[require.resolve('chartjs-plugin-datalabels')];
    return Chart;
}

 const canvasRenderService = new CanvasRenderService(1200, 800, (ChartJS) => {


            ChartJS.defaults.global.animation = false;
            ChartJS.defaults.global.responsive = false;
            ChartJS.defaults.global.defaultFontFamily = 'NUNITO';


        }, 'SVG', chartJsFactory);
        canvasRenderService.registerFont('./fonts/NunitoSans-Regular.ttf', { family: 'NUNITO' })
const stream = canvasRenderService.renderToBufferSync(chartOptions,'image/svg+xml')

res.write(stream);
res.end();
While trying to render a SVG, stream is undefined. Already installed imagemagik as documented. I am able to render image/png effortlessly.
Hello! You app is great and simplify a lot of things. Thank you for your work!
However I can’t figure out how plugin activation work. I would like to use official datalabels plugin for ChartJs, but I can’t see any labels. Here is my code:
`const Chart = require('chart.js');
**const datalabels = require('chartjs-plugin-datalabels')**
const { CanvasRenderService } = require('chartjs-node-canvas');

const width = 600;
const height = 400;
const chartCallback = (ChartJS) => {

ChartJS.defaults.global.elements.rectangle.borderWidth = 2;
**ChartJS.plugins.register({
    datalabels
    });
};**

const canvasRenderService = new CanvasRenderService(width, height, chartCallback);

(async () => {
const configuration = {
    type: 'bar',
    data: {
        datasets: [
            {
                type:"bar",
                barThickness: 24,
                label: 'My dataset',
                data: ydata['data'],
                backgroundColor: 'rgba(75,192, 192, 0.2)',
                borderColor: 'rgba(54, 162, 135, 0.2)',
                borderWidth: 1,
                **datalabels: {
                    align: 'start',
                    anchor: 'start'
                }**
            },
            labels: xdata,
        }

    options: {
        scales: {
            yAxes: [
                {
                    id: 'left-y-axis',
                    position: 'left',
                    stacked: false,
                    ticks: {
                        beginAtZero: true,
                        callback: (value) => value + "R"
                    },
                },
                {
                    id: 'right-y-axis',
                    position: 'right'
                }
            ],
            xAxes: [{
                stacked: true,

            }]
        },
        plugins: {
            **datalabels: {
                backgroundColor: function(context) {
                    return context.dataset.backgroundColor;
                },
                borderRadius: 4,
                color: 'red',
                font: {
                    weight: 'bold'
                },
                formatter: Math.round
            }
          }**
     }
};
const image = await canvasRenderService.renderToBuffer(configuration);
fs.writeFileSync(tgMsgPath+"test.png", image)
})(); `
Hi, first of all thank you for this useful library.
Part of the legend part doesn't appear when I try to render as SVG. I've added the image below. (Case 1)
Apart from that, when I add the datalabels plugin, the graphic is completely broken. (Case 2)
https://codepen.io/vencra/pen/VwaMowV (Case 1 SVG output)
https://codepen.io/vencra/pen/PoNJMqY (Case 2 SVG output)
My code is:
const width = 400; const height = 400; const chartCallback = (ChartJS) => { ChartJS.defaults.global.animation = false; ChartJS.defaults.global.responsive = false; }; const chartJsFactory = () => { const chartJS = require("chart.js"); require("chartjs-plugin-datalabels"); delete require.cache[require.resolve("chart.js")]; delete require.cache[require.resolve("chartjs-plugin-datalabels")]; return chartJS; }; const canvasRenderService = new CanvasRenderService(width, height, chartCallback, "svg", chartJsFactory);
  (async () => {
    const configuration = {
      type: "pie",
      data: {
        labels: ["Red", "Yellow", "Blue", "Grey", "Black", "Green"],
        datasets: [
          {
            data: [10, 20, 30, 10, 20, 30],
            backgroundColor: [
              "rgba(255, 99, 132, 0.2)",
              "rgba(54, 162, 235, 0.2)",
              "rgba(255, 206, 86, 0.2)",
              "rgba(75, 192, 192, 0.2)",
              "rgba(153, 102, 255, 0.2)",
              "rgba(255, 159, 64, 0.2)"
            ],
            borderColor: [
              "rgba(255,99,132,1)",
              "rgba(54, 162, 235, 1)",
              "rgba(255, 206, 86, 1)",
              "rgba(75, 192, 192, 1)",
              "rgba(153, 102, 255, 1)",
              "rgba(255, 159, 64, 1)"
            ],
            borderWidth: 0
          }
        ]
        // These labels appear in the legend and in the tooltips when hovering different arcs
      },
      options: {
        plugins: {
          datalabels: {
            formatter: (value, ctx) => {
              let sum = 0;
              let dataArr = ctx.chart.data.datasets[0].data;
              dataArr.map((data) => {
                sum += data;
              });
              let percentage = ((value * 100) / sum).toFixed(2) + "%";
              return percentage;
            },
            color: "#fff"
          }
        },
        scales: {
          xAxes: [
            {
              beginAtZero: true,
              ticks: {
                autoSkip: false
              }
            }
          ]
        }
      }
    };
    const stream = canvasRenderService.renderToBufferSync(configuration, "image/svg+xml");
    let str = Buffer.from(stream).toString();
    console.log(str);
  })();`
Thank you.
Hi there,
I'm more familiar with plugins, any idea how to load in this (relatively new) candlestick chart given its also not on npm?
https://github.com/chartjs/chartjs-chart-financial
    globalOpts.elements.financial = {

TypeError: Cannot set property 'financial' of undefined
Cheers.
Hello,
I have an issue with the plugin 'chartjs-chart-box-and-violin-plot'.
I tried the 3 methods to register the plugin but none works, I already have this error :
"boxplot" is not a chart type.
Could you help me please ?
I want to register 'datalabels' plugin and use it on my chart canvas, but I couldn't figure out how to do so. Can you help me about registering and implementating plugins on my chart?
I'm sorry to use the issues for a simple question. I'm trying to incorporate the chartjs-chart-box-and-violin-plot plugin in my server-side rendering app. I can't seem to figure out the magical incantation to get the plugin to register properly. An example would be extremely helpful.
Thanks for your time, and a very useful module!
Thank you making a library to render Awesome & fast Charts on Canvas in node. Thank you so much!.
We have a functionality in which we would like to add y value for each chart (bar or pie) in the generated chart. We had used generateLabels and afterDatasetsDraw (chartJS lifecycle) to make the same change on our chart.
Sample Code for Reference
generateLabels: function(chart) {
  const data = chart.data;
  if ( data.labels.length && data.datasets.length ) {
      return data.labels.map(function (label, index) {
        var meta = chart.getDatasetMeta(0);
        if (!meta.hidden) {
          const ctx  = chart.chart.ctx;
          meta.data.forEach(function(element, index) {
              ctx.fillStyle = 'rgba(0, 0, 0, 0.5)';
              ctx.textAlign = 'center';
              ctx.textBaseline = 'middle';

              var model = element._model;
              console.log(element._yScale);
              var scaleMax = element._yScale.maxHeight;
              var yPos = (scaleMax - model.y) / scaleMax >= 0.93 ? model.y + 10 : model.y - 5;

              ctx.fillText(label, model.x, yPos);
          });
        }
      });
  }
}
With the above code, we are receiving '_yScale' as undefined as I believe the dynamic _yScale is unavailable while rendering.
If possible, Would like to know a way in which we could add a yValue to our server side charts. Please let us know if any more information is needed.
Looking forward to your response.
Thank you for giving your time.
I can generate the image and put it in my pdf normally, but it is of very low quality, as below:

the impression is that it is all blurred, how can it improve? I greatly appreciate your help.
`const { CanvasRenderService } = require('chartjs-node-canvas');
bellow my code :
module.exports = app => {
// See https://www.chartjs.org/docs/latest/configuration

async function barChart(arrayData) {
    const width = 300 //px
    const height = 300 //px
    const configuration = {
        type: 'bar',
        data: {
            labels: ['Red', 'Blue', 'Yellow', 'Green'],
            datasets: [{
                label: 'Resultado DISC',
                data: [12, 19, 3, 5],
                backgroundColor: [
                    'rgba(255, 99, 132, 0.2)',
                    'rgba(54, 162, 235, 0.2)',
                    'rgba(255, 206, 86, 0.2)',
                    'rgba(75, 192, 192, 0.2)',
                ],
                borderColor: [
                    'rgba(255,99,132,1)',
                    'rgba(54, 162, 235, 1)',
                    'rgba(255, 206, 86, 1)',
                    'rgba(75, 192, 192, 1)',
                ],
                borderWidth: 2
            }],
            labels:['D','I','S','C']
        },
        options: {
            scales: {
                yAxes: [{
                    ticks: {
                        beginAtZero:true
                    }
                }]
            },
            legend: {
                labels: {
                    fontColor: 'black',
                }
            },
        }
    }
    const canvasRenderService = new CanvasRenderService(width, height, (ChartJS) => {
        //console.log('callback entrou')
        ChartJS.defaults.global.elements.rectangle.borderWidth = 2;
    })
    const image = await canvasRenderService.renderToBuffer(configuration)
    //const stream = canvasRenderService.renderToStream(configuration);
    const dataUrl = await canvasRenderService.renderToDataURL(configuration)

    return dataUrl
}
return { barChart }
}`
 const { CanvasRenderSerice } = require("chartjs-node-canvas")

       const canvasRenderService = new CanvasRenderService(
           width,
           height,
           ChartJS => {}
        );
With error:
5|x | (node:18303) UnhandledPromiseRejectionWarning: TypeError: CanvasRenderService is not a constructor
5|x |     at Client.<anonymous> (/root/covid/bot.js:357:37)
5|x |     at processTicksAndRejections (internal/process/task_queues.js:97:5)
it returns "error: Transferred a partial file" if i send buffer api.
and return a empty png if i use stream api
but both api work with my osx while dev, but not serverless
const express = require('express')
const bodyParser = require('body-parser')
const cors = require('cors')
const { ChartJSNodeCanvas } = require('chartjs-node-canvas')

const {
  LIMIT = 1,
  PORT = 8080,
} = process.env

const server = express()

server.use(cors())
server.use(bodyParser.urlencoded({ extended: true, limit: `${LIMIT}mb` }))
server.use(bodyParser.json({ limit: `${LIMIT}mb` }))

;(async function () {
  server.post('/', function (req, res) {
    res.setHeader('content-type', 'image/png')
    try {
      const { width = 640, height = 480 } = req.body
      const chartJSNodeCanvas = new ChartJSNodeCanvas({ width, height })
      const stream = chartJSNodeCanvas.renderToStream(req.body)
      stream.on('data', function (data) {
        res.write(data)
      })
      stream.on('end', function () {
        res.end()
      })

      // chartJSNodeCanvas.renderToBuffer(req.body).then(resp => res.send(resp))
    } catch (ex) {
      console.log(ex)
      res.status(500).send('failed to render')
    }
  })

  server.listen(PORT, function () {
    console.log('Server is listening', PORT)
  })
})()

module.exports = server

Repo := https://github.com/bevingtongroup/Chart.js for ChartJs.
I can’t make it work with ChartJS-Financial Official plugin. Is that ChartJS-Financial problem?
I do:
Git clone https://github.com/chartjs/chartjs-chart-financial/
cd chartjs-chart-financial
npm install
gulp build
As result I get a file in /dist directory and copy it to me NodeJS project folder.
In my NodeJS app I do:
const Chart = require(‘chart.js’)
const ChartFinancial = require(‘./chartjs-chart-financial.js’)

const chartJsFactory = () => {
    const Chart = require('chart.js');
    require('chartjs-plugin-datalabels');
    require('./chartjs-chart-financial.js');
    delete require.cache[require.resolve('chart.js')];
    delete require.cache[require.resolve('chartjs-plugin-datalabels')];
    delete require.cache[require.resolve('./chartjs-chart-financial.js')];
    return Chart;
}

const canvasRenderService = new CanvasRenderService(width, height, chartCallback, undefined, chartJsFactory);

(async () => {
    const configuration = {
         type: 'bar',
        data: {
            datasets: [
               {
                    type: 'candlestick',
                    label: 'Индкекс ММВБ',
                    data : [{t: 1491004800000, c: "29.76", h: "31.00", l: "26.90", o: "30.29"}, {t: 1491177600000, c: "29.76", h: "31.00", l: "26.90", o: "30.29"}],
                },
            ],
        },
    };
    const image = await canvasRenderService.renderToBuffer(configuration);
When I run the app I get:
chartjs-chart-financial.js:227
globalOpts.elements.financial = {
TypeError: Cannot set property ‘financial’ of undefined
I have checked content of Chart.defaults and found that .elements is in ‘global’ so I changed
225 const globalOpts = Chart.defaults.global
316 const globalOpts$1 = Chart.defaults.global
401 const globalOpts$2 = Chart.defaults.global
And eventually Error
Chart.defaults.set(‘ohlc’ ...
on line 446
So I changed them to:
446 Chart.defaults.ohlc.datasets.barPercentage = 1.0,
447 Chart.defaults.ohlc.datasets.categoryPercentage = 1.0
Then I got
UnhandledPromiseRejectionWarning: TypeError: Cannot read property 'data' of undefined
at CandlestickController.draw (C:\inetpub\github\telegram-stream-trades\chartjs-chart-financial.js:213:32)
So I chagned:
213 const rects = me.getMeta();
That handled all the errors. But still no candles drawn.
So probably the way I initially started is incorrect
Originally posted by @vzhilov in #40 (comment)
I'm using this in a JavaScript azure function which has no system fonts.
I got a ttf file from Google fonts and am trying to register exactly as in the docs.
However I'm getting an 'all fallbacks failed' error and the chart labels are coming out as little squares.
My server uses chartjs-node-canvas to generate many charts into a pdf. I ran the chrome heap profiler and noticed that each time I generate the report, I get a significant amount of chart related records with high retained sizes. Below are the screenshots:


Code usage:
rangeLine(min, max, value).then(chart => {
  ...
});

const rangeLine = (min, max, val) => {
  const canvasRenderService = new CanvasRenderService(170, 30);
  return canvasRenderService.renderToBuffer({
    type: "line",
    data: {
      datasets: [
        {
          pointBackgroundColor: "white",
          borderColor: "black",
          data: [
            {
              x: min,
              y: 0
            },
            {
              x: mid,
              y: 0
            },
            {
              x: max,
              y: 0
            }
          ]
        },
        {
          pointBackgroundColor: 'blue',
          pointRadius: 10,
          pointStyle: "rectRot",
          data: [
            {
              x: val,
              y: 0
            }
          ]
        }
      ]
    }
  });
};
Version: v2.4.0
ChartJS.plugins.register not working with chartjs 3.x version , it only working with 2.x version
UnhandledPromiseRejectionWarning: TypeError: Cannot read property 'register' of undefined
Hello I'm using your package to add ChartJs graphs to PDF reports.
I noticed today that after reinstalling the node packages, there was an unusual spacing between letters in labels on the graphs. (see below)
BEFORE:

AFTER:

Since my code didn't change, I checked your module and saw that you released an update (v2.4.1) that requires canvas v2.6.1.
After rolling back to ChartjsNodeCanvas to v2.4.0 and canvas to v2.6.0 my problem was solved.
I didn't check what are the new features of this more recent version of canvas, but I wanted to let you know that it could broke some existing applications, so maybe you should change the version number to a "minor release" instead of a "patch release".
Anyway, thank you for your package.
Okay so I can't get it to work. I've try to draw a line chart and got it. So I took the example and put it in my code as it but no better. The error I get is
`TypeError: Cannot read property '$chartjs' of null
at injectCSS (node_modules\chart.js\dist\Chart.js:7692:24)
at Object._ensureLoaded (node_modules\chart.js\dist\Chart.js:7732:4)
at Object.acquireContext (node_modules\chart.js\dist\Chart.js:7764:9)
at Chart.construct (node_modules\chart.js\dist\Chart.js:9307:26)
at new Chart (node_modules\chart.js\dist\Chart.js:9294:7)
at CanvasRenderService.renderChart (node_modules\chartjs-node-canvas\dist\index.js:151:16)
at CanvasRenderService.renderToBuffer (node_modules\chartjs-node-canvas\dist\index.js:75:28)`
The "$chartjs" element is used in this method for rootNode. When I log the context passed chartJS, i get
CanvasRenderingContext2D { canvas: [Canvas 400x400] }
The implementation is :
const { CanvasRenderService } = require('chartjs-node-canvas');
const mkdirp = require('mkdirp')
const fs = require('fs');
const util = require('util');
const readFile = util.promisify(fs.readFile);
const writeFile = util.promisify(fs.writeFile);

const width = 400;
const height = 400;
const canvasRenderService = new CanvasRenderService(width, height, chartCallback);
const buildChart = async (values, savePath) => {
 const configuration = {
      type: 'bar',
      data: {
          labels: ['Red', 'Blue', 'Yellow', 'Green', 'Purple', 'Orange'],
          datasets: [{
              label: '# of Votes',
              data: [12, 19, 3, 5, 2, 3],
              backgroundColor: [
                  'rgba(255, 99, 132, 0.2)',
                  'rgba(54, 162, 235, 0.2)',
                  'rgba(255, 206, 86, 0.2)',
                  'rgba(75, 192, 192, 0.2)',
                  'rgba(153, 102, 255, 0.2)',
                  'rgba(255, 159, 64, 0.2)'
              ],
              borderColor: [
                  'rgba(255,99,132,1)',
                  'rgba(54, 162, 235, 1)',
                  'rgba(255, 206, 86, 1)',
                  'rgba(75, 192, 192, 1)',
                  'rgba(153, 102, 255, 1)',
                  'rgba(255, 159, 64, 1)'
              ],
              borderWidth: 1
          }]
      },
      options: {
          scales: {
              yAxes: [{
                  ticks: {
                      beginAtZero: true,
                      callback: (value) => '$' + value
                  }
              }]
          }
      }
  };
  const image = await canvasRenderService.renderToBuffer(configuration);
  await mkdirp(savePath.slice(0, savePath.lastIndexOf("/")));
  await writeFile(savePath, image)
}
I'm on windows, Node 14.0.0, canvas 2.6.1, chart.js 2.9.3, chartjs-node-canvas 3.0.6
Does someone as a clue ?
Please check the dependencies as you are using a very old version of "static-eval" package. This is dangerous and could be exploited. I advise to update it if you can or avoid that dependency.
2.0.0 and newer version do not have the problem anymore.
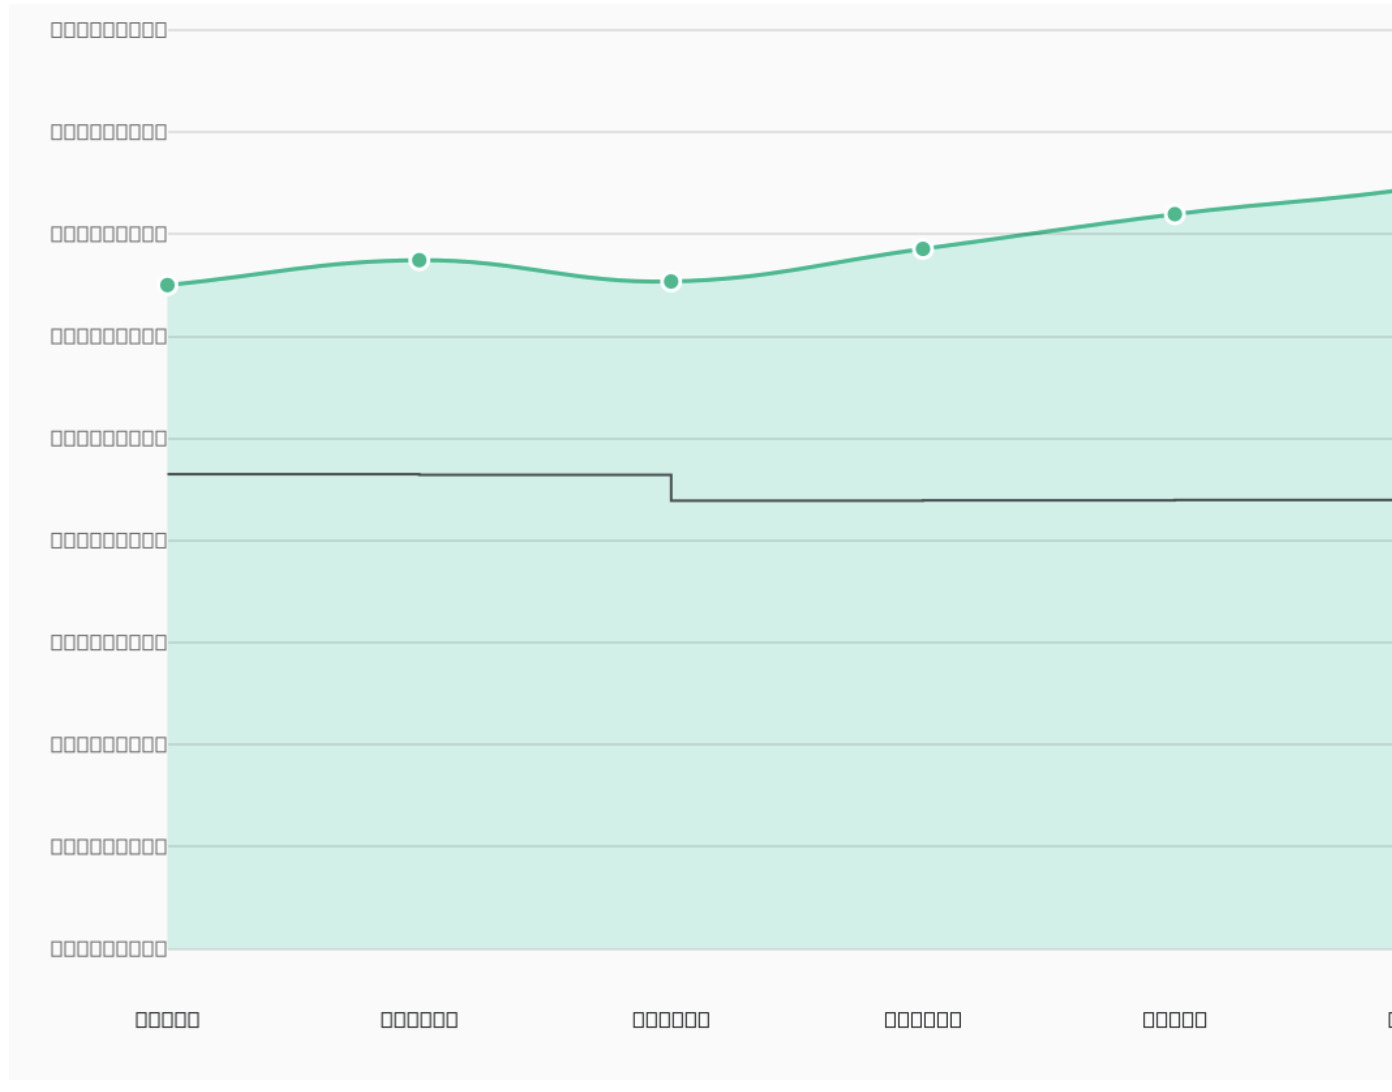
Thanks for the nice library. I'm starting to use the library in lambda and when setting Japanese language, for example.
labels: ["1日","2日","3日","4日","5日","6日","7日","8日","9日","10日","11日","12日","13日","14日","15日","16日","17日","18日","19日","20日","21日","22日","23日","24日","25日","26日","27日","28日","29日","30日","31日"],
the result is

Is there any work around to fix it?
Main class CanvasRenderService in 3.0.7 is replaced by ChartJSNodeCanvas. It is a real breaking change and MAJOR version of package should be upraised to 4.x.x.
The server responds with a 500 error code. Other petitions works perfectly. I did some tests and the problem is in this line:
const canvasRenderService = new CanvasRenderService(width, height, (ChartJS) => { });
but i dont know why. Could you help me? Is needed something more than only the npm packgages?
I'm using an express app with node.js, and in localhost it works great. The server is a web app in Azure.
Thanks in advance.
Hello,
Thank you for this library.
I am trying to run it on my server (ubuntu 18.04) using latest nodejs but the chart is displaying boxes in place of text. Is it font related issue? I am using default English language.
Chart renders fine on my local server running on MacOS.

In this case chartjs-plugin-datalabels (https://chartjs-plugin-datalabels.netlify.com/) and chartjs-plugin-annotation (https://github.com/chartjs/chartjs-plugin-annotation)
Trying to require it seems not to load the module as an global plugin or cant be registered.
package.json
"dependencies": {
        "chartjs-node-canvas": "2.x.x",
        "chart.js": "2.7.x",
        "chartjs-plugin-datalabels": "0.x.x",
        "chartjs-plugin-annotation": "0.x.x"
    }
index.js
const { CanvasRenderService } = require('chartjs-node-canvas');
require('chartjs-plugin-datalabels');
require('chartjs-plugin-annotation');

module.exports = async function (context, req) {
    const width = 400; //px
    const height = 400; //px
    const configuration = {
        ... // See https://www.chartjs.org/docs/latest/configuration
    };
    const canvasRenderService = new CanvasRenderService(width, height, (ChartJS) => {
        // See https://www.chartjs.org/docs/latest/configuration/#global-configuration
        ChartJS.defaults.global.responsive = true;
    });
    const image = await canvasRenderService.renderToBuffer(configuration);
    const dataUrl = await canvasRenderService.renderToDataURL(configuration); // image/png
    const stream = canvasRenderService.renderToStream(configuration);
}After upgrading from 3.0.6 to 3.0.8 I got:
TypeError: CanvasRenderService is not a constructor
So I had to change:
const { CanvasRenderService } = require('chartjs-node-canvas');
const canvasRenderService = new CanvasRenderService(width, height, undefined, undefined, chartJsFactory);
to
const { ChartJSNodeCanvas } = require('chartjs-node-canvas');
const canvasRenderService = new ChartJSNodeCanvas(width, height, undefined, undefined, chartJsFactory);
Then I got the following error:
(node:9724) UnhandledPromiseRejectionWarning: Error: the surface type is not appropriate for the operation
at emitUnhandledRejectionWarning (internal/process/promises.js:168:15)
at processPromiseRejections (internal/process/promises.js:247:11)
at processTicksAndRejections (internal/process/task_queues.js:94:32)
(node:9724) Error: the surface type is not appropriate for the operation
(node:9724) [DEP0018] DeprecationWarning: Unhandled promise rejections are deprecated. In the future, promise rejections that are not handled will terminate the Node.js process with a non-zero exit code.
at emitDeprecationWarning (internal/process/promises.js:180:11)
at processPromiseRejections (internal/process/promises.js:249:13)
at processTicksAndRejections (internal/process/task_queues.js:94:32)
Should I adjust my code for the new version?
const width = 600;
const height = 400;

const chartJsFactory = () => {
    require('chartjs-plugin-datalabels');
    delete require.cache[require.resolve('chart.js')];
    delete require.cache[require.resolve('chartjs-plugin-datalabels')];
    return Chart;
}

const canvasRenderService = new ChartJSNodeCanvas(width, height, undefined, undefined, chartJsFactory);
Hello, I assume this is an error related to node-canvas but I'm not able to fix it with my NextJS application.
Everything works locally but when deploying to Vercel, the function starts to fail.
Full error log:
ERROR	Error creating chart image Error: Cannot find module 'canvas'
Require stack:
- /var/task/node_modules/chartjs-node-canvas/dist/freshRequire.js
- /var/task/node_modules/chartjs-node-canvas/dist/index.js
- /var/task/.next/serverless/pages/articulos/[id].js
- /var/task/now__launcher.js
- /var/runtime/UserFunction.js
- /var/runtime/index.js
    at Function.Module._resolveFilename (internal/modules/cjs/loader.js:831:15)
    at Function.resolve (internal/modules/cjs/helpers.js:80:19)
    at Object.freshRequire (/var/task/node_modules/chartjs-node-canvas/dist/freshRequire.js:5:34)
    at new CanvasRenderService (/var/task/node_modules/chartjs-node-canvas/dist/index.js:19:39)
    at createChartImage (/var/task/.next/serverless/pages/articulos/[id].js:1874:33)
    at getServerSideProps (/var/task/.next/serverless/pages/articulos/[id].js:1957:37)
    at processTicksAndRejections (internal/process/task_queues.js:97:5)
    at async renderToHTML (/var/task/node_modules/next/dist/next-server/server/render.js:39:215)
    at async renderReqToHTML (/var/task/.next/serverless/pages/articulos/[id].js:1136:22)
    at async render (/var/task/.next/serverless/pages/articulos/[id].js:1253:22) {
  code: 'MODULE_NOT_FOUND',
  requireStack: [
    '/var/task/node_modules/chartjs-node-canvas/dist/freshRequire.js',
    '/var/task/node_modules/chartjs-node-canvas/dist/index.js',
    '/var/task/.next/serverless/pages/articulos/[id].js',
    '/var/task/now__launcher.js',
    '/var/runtime/UserFunction.js',
    '/var/runtime/index.js'
  ]
}
As far as I'm aware of, Vercel uses Amazon Linux 2 and I got the packages to install from node-canvas wiki for Fedora. Therefore I updated the install command for my project to run:
yum install gcc-c++ cairo-devel libjpeg-turbo-devel pango-devel giflib-devel && npm install
It looks like it installs everything correctly but the same error persists.
Any clue on how to get it working correctly?
Thanks for the great package!
I'm trying to run chartjs-node-canvas over express. The graph is rendered correctly on the first time I access the URL, but is blank on the second and subsequent calls. A minimal working example would be:
const express = require("express")
const { CanvasRenderService } = require('chartjs-node-canvas');
let app = express()

const configuration = {
    type: 'bar',
    data: {
        labels: ['Red', 'Blue'],
        datasets: [{
            label: '# of Votes',
            data: [12, 19],
            backgroundColor: [
                'rgba(153, 102, 255, 0.2)',
                'rgba(255, 159, 64, 0.2)'
            ]
        }]
    }
};

const mkChart = async (params) => {
    const canvasRenderService = new CanvasRenderService(800, 800)
    return await canvasRenderService.renderToBuffer(configuration);
}

app.get('/chart', async function (req, res) {
        var image = await mkChart(req.query)
        res.type("image/png")
        res.send(image)
})

app.listen(3061, () => {
})How can i get the feature of tool tip on client end? is there any possibility for that using chartjsnodecanvas. thanks in advance
Hi,
Looking into your lib. looks like a cool project. Got it working pretty fast. I was wondering though, would it be possible to set some properties of the canvas element, so that you can, for instance, set the background color for the entire image?
I'm trying to register the chartjs-plugin-piechart-outlabels, but even passing for all the methods, the error persists: ReferenceError: Chart is not defined.
What can I do to register this plugin?
I was trying to use this to render the charts to SVGs images, but when I try to include the mime/type image/svg+xml it gives me a this error:
throw new Error(`Un-handled mimeType: ${mimeType}`);
                ^
Error: Un-handled mimeType: image/svg+xml
    at CanvasRenderService.renderToStream (/servicing-sdk/node_modules/chartjs-node-canvas/dist/index.js:129:23)
which looks to be due to it not being available in the switch statement in this function.
ChartjsNodeCanvas/src/index.ts
Line 148 in 40223d6
Am I just missing something?
Here's the code I was trying this with
    const { CanvasRenderService } = dependencies.chartJS;
    const { height, width } = constants.medium;
    let renderService = new CanvasRenderService(width, height, (ChartJS) => { }, 'SVG');
let stream = await renderService.renderToStream({
        //Example Chartjs object
    }, 'image/svg+xml');
I tried just using renderToBuffer and when I try to specify the same mime type to that method it just doesn't render anything and if omit it then it just renders to the default PNG type.
Hi, have some problem with memory leak. Is there a garbage disposal method?
after 4 uses.

read requests like this did not see, maybe a problem on my part?
const { CanvasRenderService } = require('chartjs-node-canvas');

const chartCallback = (ChartJS) => {
    ChartJS.defaults.global.responsive = true;
    ChartJS.defaults.global.maintainAspectRatio = false;
};

const CreatorChart = async(config) =>{
        const canvasRenderService = new CanvasRenderService(config.width, config.height, chartCallback);
        const a = await canvasRenderService.renderToDataURL(config)
        return a.split(",")[1];
}

module.exports = CreatorChartI am using this package in an AWS lambda environment and have issues with showing color. The colours are grey for some reason. Locally the colours are rendered fine. Also when using a docker lambda environment the colours are shown. Only in an AWS environment the color reduces back to grey.

I am using the layer canvas-lib64-layer.zip
and the following script to render the chart.
var Module = require('module')

const { CanvasRenderService } = require('chartjs-node-canvas');
const { CanvasRenderingContext2D, CanvasPattern, CanvasGradient } = require("canvas");

let schemesPlugin = undefined;

exports.handler = async (event) => {
    const width = event.width;
    const height = event.height;
    const canvasRenderService = new CanvasRenderService(width, height, (ChartJS) => {

        ChartJS.defaults.global.defaultFontFamily = 'Arial';
        ChartJS.defaults.global.elements.rectangle.borderWidth = 2;

        global.CanvasRenderingContext2D = CanvasRenderingContext2D;
        global.CanvasPattern = CanvasPattern;
        global.CanvasGradient = CanvasGradient;

        global.Chart = ChartJS;
        require('chartjs-plugin-labels');

        schemesPlugin = require('./chartjs-plugin-colorschemes-mod');
        ChartJS.plugins.register(schemesPlugin);
    });
    try{
        canvasRenderService.registerFont('./arial.ttf', { family: 'Arial' });
        let data = await canvasRenderService.renderToDataURL(event.chart);
        return data;
    }catch(e) {
        console.log('Received event:', JSON.stringify(event, null, 2));
        console.log("Error", e);
    }
};
And an example event with the configuration. This is not the same chart as shown above but the color issues are the same.
{
    "width": 700,
    "height": 400,
    "chart": {
        "type": "radar",
        "data": {
            "labels": [
                "Vehicles",
                "Accessories",
                "Digital",
                "Insurance"
            ],
            "datasets": [
                {
                    "label": "Revenue",
                    "data": [
                        900000,
                        700000,
                        600000,
                        750000
                    ],
                    "fill": false,
                    "lineTension": 0
                },
                {
                    "label": "Return",
                    "data": [
                        500000,
                        300000,
                        800000,
                        400000
                    ],
                    "fill": false,
                    "lineTension": 0
                }
            ]
        },
        "options": {
            "maintainAspectRatio": true,
            "title": {
                "text": "The super title",
                "display": true
            },
            "plugins": {
                "colorschemes": {
                    "scheme": "brewer.Paired12"
                },
                "labels": {
                    "render": "value",
                    "position": "outside"
                }
            }
        }
    }
}
Any ideas or hints are welcome. I have no idea where to start looking, because I cannot reproduce it locally and not in docker.
Thanks
This is more a question than an issue.
I would like to access canvas or canvas context directly (I need to call createLinearGradient)
What is the proper way, if possible?
Is there any way with this library to set devicePixelRatio when drawing to canvas?
chartjs-node exposes this as a top-level argument to the constructor: vmpowerio/chartjs-node@6dabecf
Hey, when I run your package, I immediately get the following error:
<dir>\node_modules\canvasjs\src\main\index.js:15
import Charts from '../core/charts';
SyntaxError: Cannot use import statement outside a `module``
I haven't modified anything in that file. Any help?
Hey,
I'm using this library in an serverless enviroment to generate charts in pdf reports which works great when I run it locally with serverless-offline.
When ran on AWS though I always get the error "Fontconfig error: Cannot load default config file" and the chart renders with a broken font (see picture).
To generate the pdf I use handlebars with puppeteer which is working without any problems.
Any idea how to fix this on my end?

Hello,
Thank you for creating this awesome library.
I've run into a weird issue where text in my chart is not being parsed when I run my code on AWS Lambda. It runs just fine locally on MacOS Catalina.
This is what I get:
So far I have attempted:
Any help at all is greatly appreciated!
I'm still attempting to find the root cause of the issue and will update this post if I come to a solution.
i'm using express js and pug
Hello,
**Context: **
I am trying to Create an auto email service that runs on a timer and sends emails out on a scheduled basis.
I use Cronjobs.org which hits my Lambda function hosted on netlify. This function creates the email template and then sends the email using SendGrid. This all works fine and dandy Until I try to put a chart into this template.
The issue is I cannot get chartjs to create the said chart.
Because I am using a lambda function to create this email template no canvas object is available. This is where I stumbled upon this library as it looks like it can do exactly what I want.
**Problem: **
Using the default chart from the documentation to test things. I want to be able to create the graph that then renders it to a URL that can be sent to an image tag. However, whenever the lambda function is called from netlify it returns the error :
{"errorType":"Runtime.ImportModuleError","errorMessage":"Error: Cannot find module 'chart.js'"
Chart.js is installed and I have tried numerous variations of require statements that still are not working.
Any help would be appreciated.
const { CanvasRenderService } = require('chartjs-node-canvas');
// const { ChartJS } = require('chart.js');  //Does not work
const width = 400; //px
const height = 400; //px
const canvasRenderService = new CanvasRenderService(width, height, (ChartJS) => { });

module.exports = async (data) => {
    const configuration = {
        type: 'bar',
        data: {
            labels: ['Red', 'Blue', 'Yellow', 'Green', 'Purple', 'Orange'],
            datasets: [{
                label: '# of Votes',
                data: [12, 19, 3, 5, 2, 3],
                backgroundColor: [
                    'rgba(255, 99, 132, 0.2)',
                    'rgba(54, 162, 235, 0.2)',
                    'rgba(255, 206, 86, 0.2)',
                    'rgba(75, 192, 192, 0.2)',
                    'rgba(153, 102, 255, 0.2)',
                    'rgba(255, 159, 64, 0.2)'
                ],
                borderColor: [
                    'rgba(255,99,132,1)',
                    'rgba(54, 162, 235, 1)',
                    'rgba(255, 206, 86, 1)',
                    'rgba(75, 192, 192, 1)',
                    'rgba(153, 102, 255, 1)',
                    'rgba(255, 159, 64, 1)'
                ],
                borderWidth: 1
            }]
        },
        options: {
            scales: {
                yAxes: [{
                    ticks: {
                        beginAtZero: true,
                        callback: (value) => '$' + value
                    }
                }]
            }
        }
    };
    const dataUrl = await canvasRenderService.renderToDataURL(configuration);
    return dataUrl;
}
I got error:
Unsupported engine for [email protected]: wanted: {"node":"11.14.0","npm":"6.7.0"} (current: {"node":"12.13.0","npm":"6.12.0"})
npm WARN notsup Not compatible with your version of node/npm: [email protected]
how I can update chartjs-node-canvas to nodejs@12?
I'm trying to put values to bars and I'm using the onAnimationComplete option from charts.js (https://www.chartjs.org/docs/latest/configuration/animations.html#animation-callbacks). Examples:
But it doesn't work. How can I put each value to the bar chart?
options: {
        onAnimationComplete: function () {

            var ctx = this.chart.ctx;
            ctx.font = this.scale.font;
            ctx.fillStyle = this.scale.textColor
            ctx.textAlign = "center";
            ctx.textBaseline = "bottom";

            this.datasets.forEach(function (dataset) {
                dataset.bars.forEach(function (bar) {
                    ctx.fillText(bar.value, bar.x, bar.y - 5);
                });
            })
        },
So I always want a good image, which I can zoom and see the content clearly. I tried to use the scale option, but it make the images zoomed and overflows it.
Am I missing something ??
Note: without scaling the code works fine, but I want an image that I can zoom and see clearly
Thanks
I use your component in an AWS Lambda and noticed that version 3.x has gone from 300K to 4.32MB in size. Due to the size increate our deployment now exceeds the unzipped size allowed by AWS. I was just wondering what the changes were to 3.x and if sticking with version 2.4.2 would be okay.
Thanks.
I'm running node.js 15.12.0 on a linux machine
I'm trying to get gradients to work but they are just showing up as black.
Does anyone else have issues with this?
Steps to reproduce: set backGroundcolor property to any kind of gradient.
Dependency on canvas could generate problems on older systems (in my case CentOS 7). The newest version - [email protected] - requires newer libstdc++ library absent in CentOS 7.
See my comment at: Automattic/node-canvas#1753 (comment)
Rendered transparent blank canvas. It has something to do with calling chart.destroy();
UPD: setImmediate(() => chart.destroy()); seems to fix the problem.
Hi,
I'm using this lib; I try to use charjs plugin colorschemes and i implement that following way
import { CanvasRenderService } from "chartjs-node-canvas";
import { freshRequire } from 'chartjs-node-canvas/dist/freshRequire';

const width = 100;
const height = 100;

 const canvasRenderService = new CanvasRenderService(width, height, (ChartJs) => {
   ChartJs.plugins.register(freshRequire('chartjs-plugin-colorschemes'))
 });

const image = await canvasRenderService.renderToBuffer({
  type: "radar",
  data: {
    labels: ["Africa", "Asia", "Europe", "Latin America", "North America"],
    datasets: [
      {
        label: "1950",
        fill: true,
        backgroundColor: "rgba(179,181,198,0.2)",
        borderColor: "rgba(179,181,198,1)",
        pointBorderColor: "#fff",
        pointBackgroundColor: "rgba(179,181,198,1)",
        data: [8.77, 55.61, 21.69, 6.62, 6.82]
      }, {
        label: "2050",
        fill: true,
        backgroundColor: "rgba(255,99,132,0.2)",
        borderColor: "rgba(255,99,132,1)",
        pointBorderColor: "#fff",
        pointBackgroundColor: "rgba(255,99,132,1)",
        pointBorderColor: "#fff",
        data: [25.48, 54.16, 7.61, 8.06, 4.45]
      }
    ]
  },
  options: {
    plugins: {
      colorschemes: {
        scheme: "brewer.YlGnBu4",
        fillAlpha: 0.5
      }
    },
    title: {
      display: true,
      text: "Distribution in % of world population"
    }
  }
});
When generate chart; I show the next error
Exception: ReferenceError: CanvasGradient is not defined
Stack: ReferenceError: CanvasGradient is not defined
I found a posible solution and it is copy the the following properties CanvasRenderingContext2D, CanvasPattern, CanvasGradient from canvas to global after created (https://stackoverflow.com/a/60907104/7137011); but i don't know if this is correct or maybe exists another soluctions.
Thank you, this lib is great !!
A declarative, efficient, and flexible JavaScript library for building user interfaces.
🖖 Vue.js is a progressive, incrementally-adoptable JavaScript framework for building UI on the web.
TypeScript is a superset of JavaScript that compiles to clean JavaScript output.
An Open Source Machine Learning Framework for Everyone
The Web framework for perfectionists with deadlines.
A PHP framework for web artisans
Bring data to life with SVG, Canvas and HTML. 📊📈🎉
JavaScript (JS) is a lightweight interpreted programming language with first-class functions.
Some thing interesting about web. New door for the world.
A server is a program made to process requests and deliver data to clients.
Machine learning is a way of modeling and interpreting data that allows a piece of software to respond intelligently.
Some thing interesting about visualization, use data art
Some thing interesting about game, make everyone happy.
We are working to build community through open source technology. NB: members must have two-factor auth.
Open source projects and samples from Microsoft.
Google ❤️ Open Source for everyone.
Alibaba Open Source for everyone
Data-Driven Documents codes.
China tencent open source team.