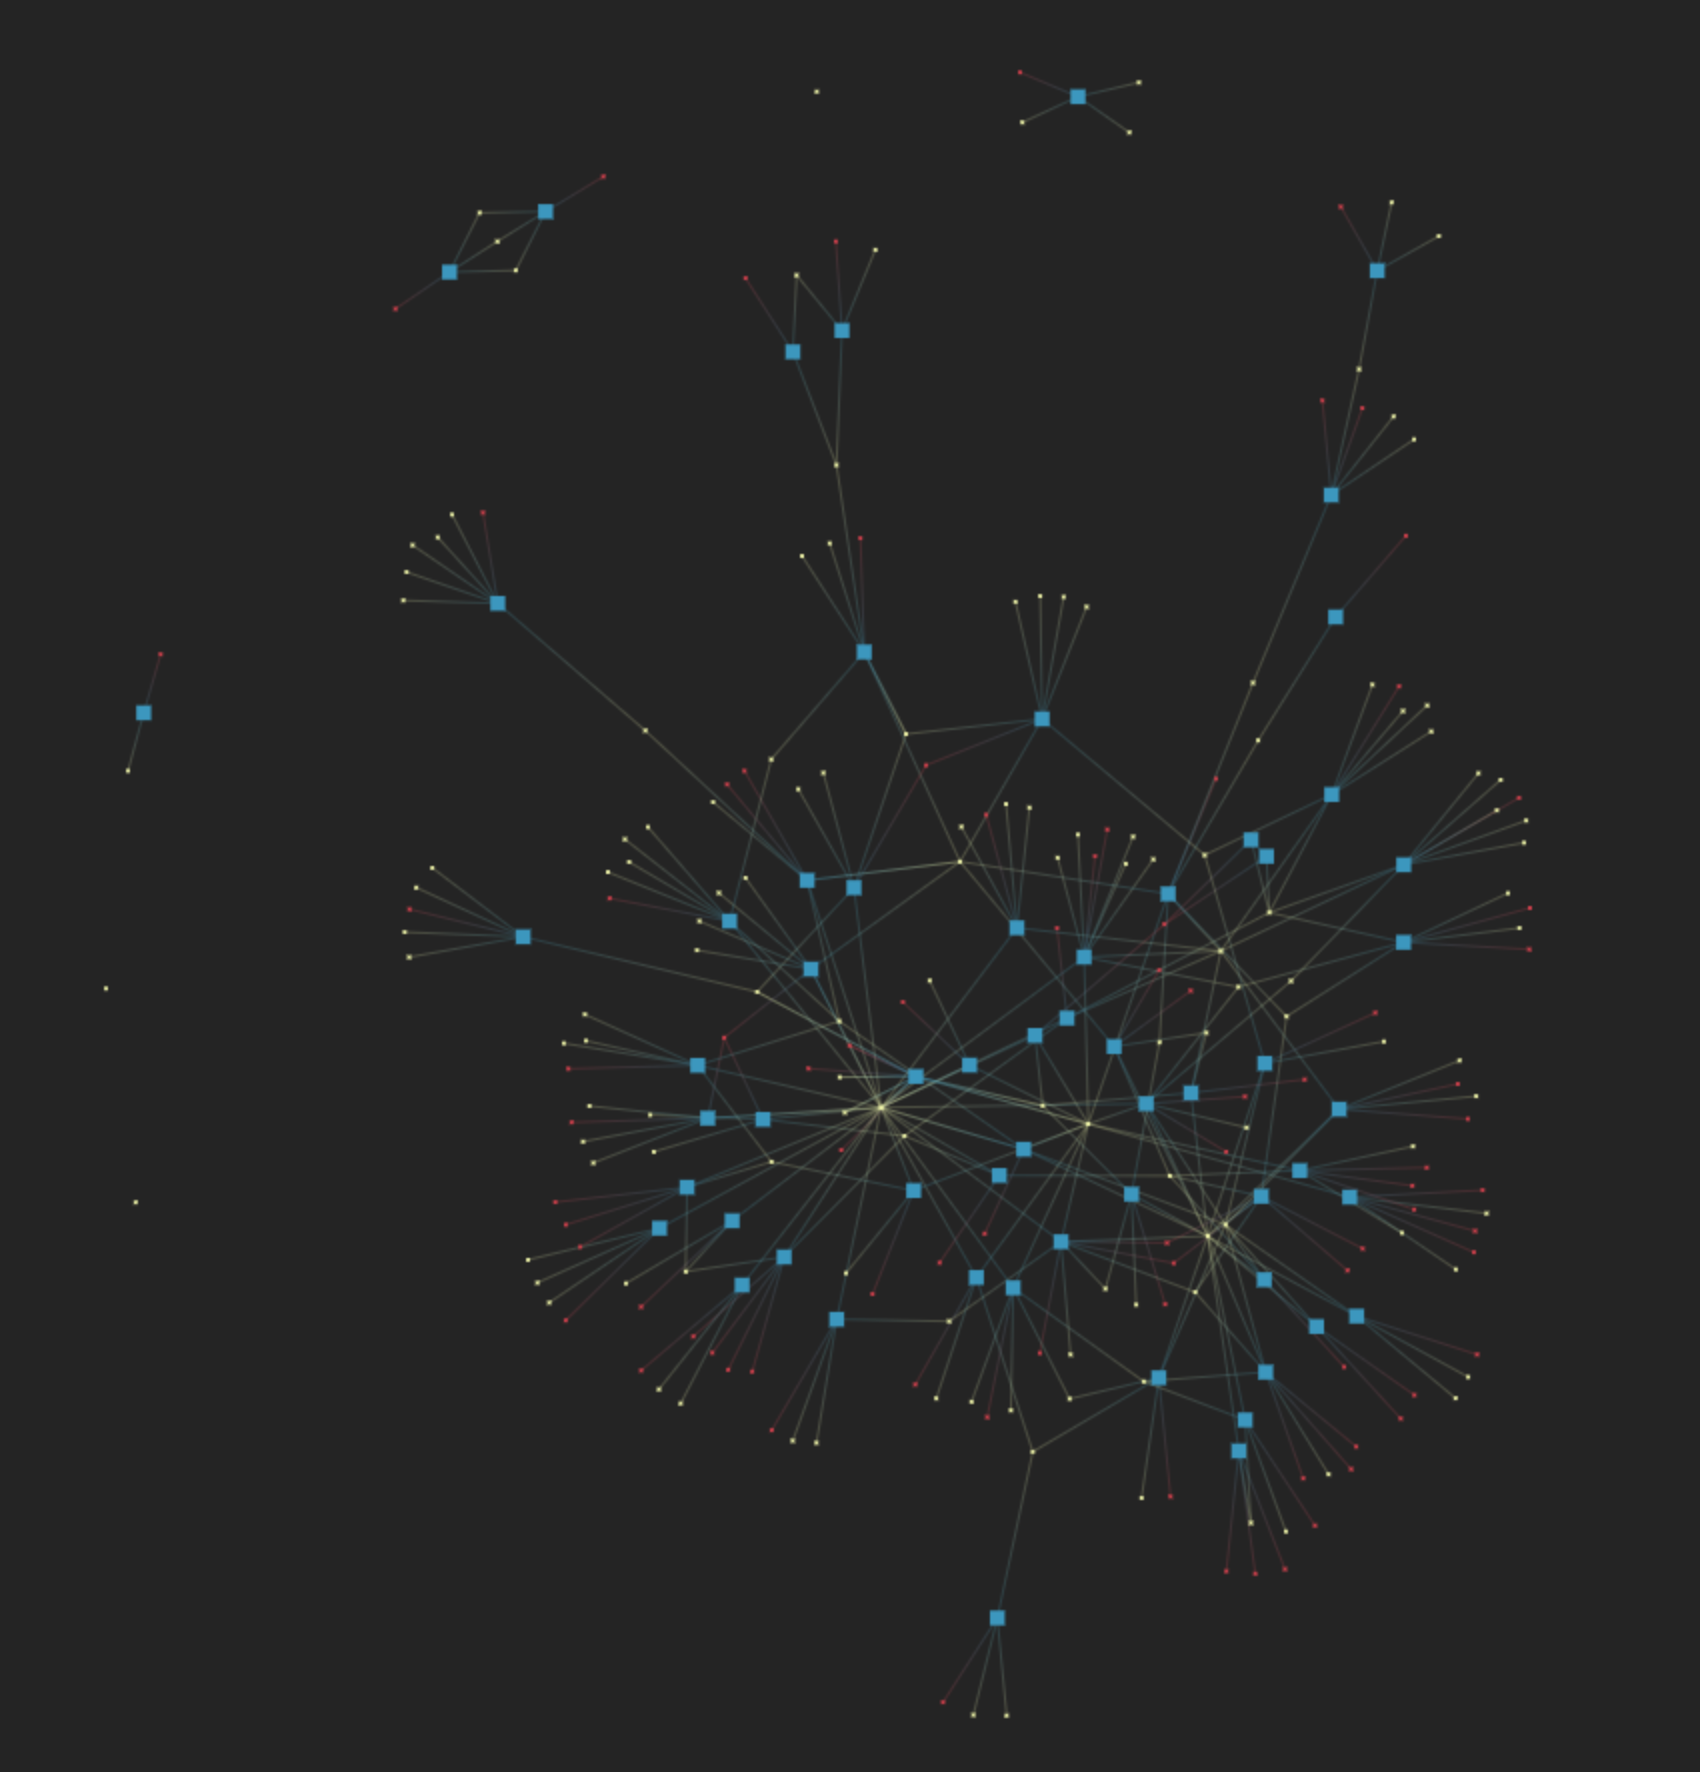
A live version can be found on kumu.io
Initium Lab hods a Jackathon: Read a data science book in 8 hours. We want to analyse those books. This repo is a walk-through of the process.
Combine http and pquery for a quick command-line hack.
%http --body 'http://www.kdnuggets.com/2015/09/free-data-science-books.html' | pquery '.three_ul li strong a' -f '"{text}",{href}' > books.csv
%http --body 'http://www.kdnuggets.com/2015/09/free-data-science-books.html' | pquery '.three_ul li em' -p text > authors.csv
%http --body 'http://www.kdnuggets.com/2015/09/free-data-science-books.html' | pquery '.three_ul li' -p html | grep '</em>' | sed 's/<\/em>/    /g' | cut -f2 | sed 's/[^0-9]//g' | tr -d ',' > years.csv
Result:
%wc -l *.csv
62 authors.csv
61 books.csv
62 years.csv
185 total
Manually put the above three CSVs in one table.
We find that there are some missing data.
Say, the entry Machine Learning – The Complete Guide does not heav Year field.
Fix those issues and we get the form
Combined books.csv - Overall Form.csv.
The first several lines look like the following:
Category,Author,Year,Title,URL
Data Science in General,"Jeffrey Stanton, ",2013,An Introduction to Data Science,https://docs.google.com/file/d/0B6iefdnF22XQeVZDSkxjZ0Z5VUE/edit?pli=1
Data Science in General,"School of Data, ",2015,School of Data Handbook,http://schoolofdata.org/handbook/
Data Science in General,"DJ Patil, ",2012,Data Jujitsu: The Art of Turning Data into Product,http://www.oreilly.com/data/free/data-jujitsu.csp
Interviews with Data Scientists,"Carl Shan, Henry Wang, William Chen, & Max Song, ",2015,The Data Science Handbook,http://www.thedatasciencehandbook.com/#get-the-book
Interviews with Data Scientists,"Brian Liou, Tristan Tao, & Declan Shener, ",2015,The Data Analytics Handbook,https://www.teamleada.com/handbook
...
Execute the program segment in this iPython notebook
The script produces elements.csv and connections.csv.
You can upload the two files onto <kumu.io> to get the nice network visualisation we presented at the beginning of this document.
