GithubHelp home page GithubHelp logo

sgratzl / chartjs-chart-geo Goto Github PK

View Code? Open in Web Editor NEW
328.0 4.0 36.0 14.83 MB

Chart.js Choropleth and Bubble Maps

Home Page: https://www.sgratzl.com/chartjs-chart-geo/

License: MIT License

JavaScript 5.93% TypeScript 94.07%
chartjs d3-geo choropleth bubble-chart map javascript chartjs-plugin

chartjs-chart-geo's Introduction

Chart.js Geo

NPM Package Github Actions

Chart.js module for charting maps with legends. Adding new chart types: choropleth and bubbleMap.

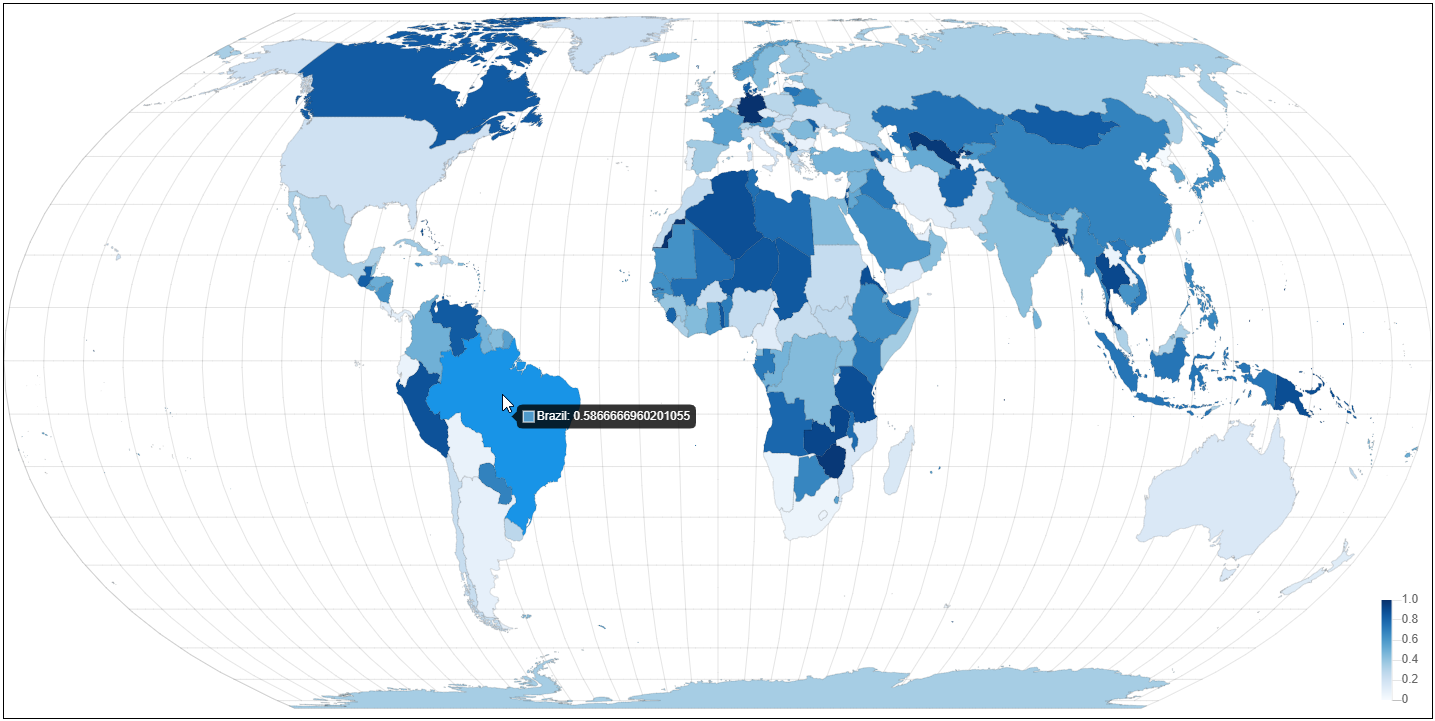
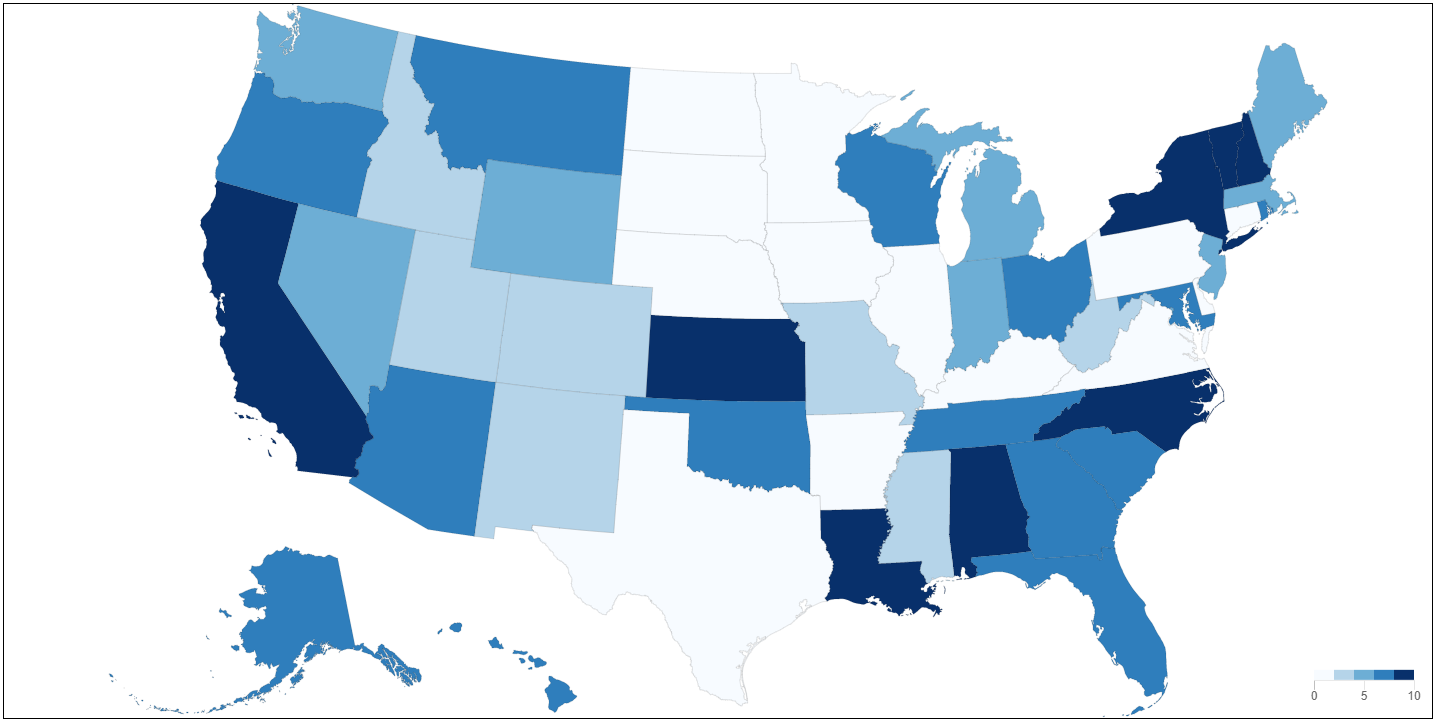
Choropleth

Open in CodePen

Earth Choropleth

Open in CodePen

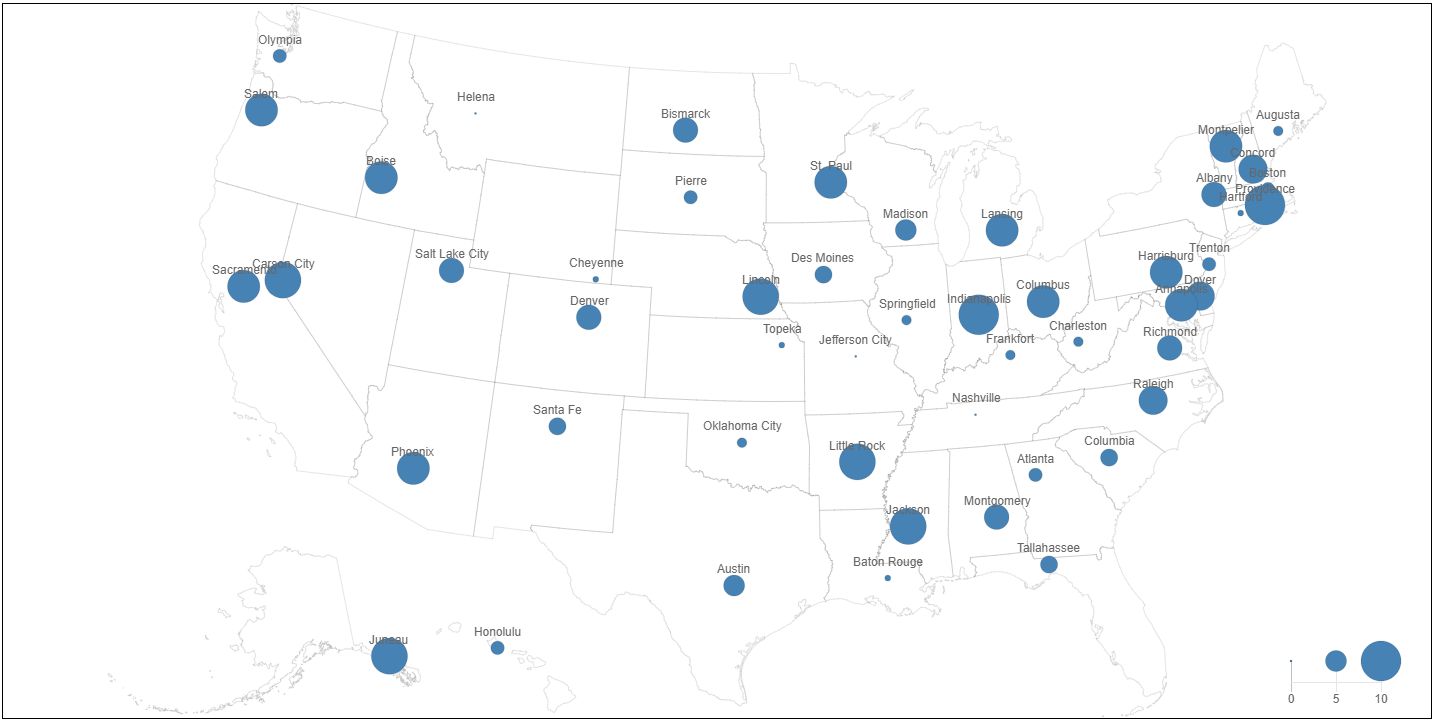
Bubble Map

Open in CodePen

works great with https://github.com/chartjs/chartjs-plugin-datalabels

Related Plugins

Check out also my other chart.js plugins:

Install

npm install --save chart.js chartjs-chart-geo

Usage

see https://www.sgratzl.com/chartjs-chart-geo/ website

CodePens

Options

The option can be set globally or per dataset

see https://github.com/sgratzl/chartjs-chart-geo/blob/main/src/controllers/GeoController.ts#L221

Choropleth

A Choropleth (chart type: choropleth) is used to render maps with the area filled according to some numerical value.

Choropleth

Open in CodePen

Earth Choropleth

Open in CodePen

Data Structure

A data point has to have a .feature property containing the feature to render and a .value property containing the value for the coloring.

TopoJson is packaged with this plugin to convert data, it is exposed as ChartGeo.topojson in the global context. However, this plugin doesn't include any topojson files itself. Some useful resources I found so far:

const us = await fetch('https://cdn.jsdelivr.net/npm/us-atlas/states-10m.json').then((r) => r.json());

// whole US for the outline
const nation = ChartGeo.topojson.feature(us, us.objects.nation).features[0];
// individual states
const states = ChartGeo.topojson.feature(us, us.objects.states).features;

const alaska = states.find((d) => d.properties.name === 'Alaska');
const california = states.find((d) => d.properties.name === 'California');
...

const config = {
  data: {
    labels: ['Alaska', 'California'],
    datasets: [{
      label: 'States',
      outline: nation, // ... outline to compute bounds
      showOutline: true,
      data: [
        {
          value: 0.4,
          feature: alaska // ... the feature to render
        },
        {
          value: 0.3,
          feature: california
        }
      ]
    }]
  },
  options: {
    scales: {
      projection: {
        projection: 'albersUsa' // ... projection method
      }
    }
  }
};

Styling

The styling of the new element GeoFeature is based on Bar Element with some additional options for the outline and graticule.

see https://github.com/sgratzl/chartjs-chart-geo/blob/main/src/elements/GeoFeature.ts#L41

Legend and Color Scale

The coloring of the nodes will be done with a special color scale. The scale itself is based on a linear scale.

see

Bubble Map

A Bubble Map (chart type: bubbleMap) aka Proportional Symbol is used to render maps with dots that are scaled according to some numerical value. It is based on a regular bubble chart where the positioning is done using latitude and longitude with an additional sizeScale to create a legend for the different radi.

Bubble Map

Open in CodePen

Data Structure

see Bubble Chart. Alternatively to x and y, the following structure can be used:

interface IBubbleMapPoint {
  longitude: number;
  latitude: number;
  value: number;
}

Note: instead of using the r attribute as in a regular bubble chart, the value attribute is used, which is picked up by the sizeScale to convert it to an actual pixel radius value.

Styling

A regular point is used and thus supports the Point Element styling options. In addition, the outline* and graticule* are supported.

Legend

Similar to the choropleth chart a new sizeScale is used to map the values to symbol radius size. The scale itself is based on a linear scale.

see

Scales

A new scale projection is registered and used by default by Choropleth and BubbleMap. The available methods are the one from https://github.com/d3/d3-geo#projections. Just remove the geo prefix. Alternatively, the projection method instance can be directly given.

see https://github.com/sgratzl/chartjs-chart-geo/blob/main/src/scales/ProjectionScale.ts#L76

ESM and Tree Shaking

The ESM build of the library supports tree shaking thus having no side effects. As a consequence the chart.js library won't be automatically manipulated nor new controllers automatically registered. One has to manually import and register them.

Variant A:

import { Chart } from 'chart.js';
import { ChoroplethController, GeoFeature, ColorScale, ProjectionScale } from 'chartjs-chart-geo';

// register controller in chart.js and ensure the defaults are set
Chart.register(ChoroplethController, GeoFeature, ColorScale, ProjectionScale);

const chart = new Chart(document.getElementById('canvas').getContext('2d'), {
  type: 'choropleth',
  data: {
    // ...
  },
});

Variant B:

import { ChoroplethChart } from 'chartjs-chart-geo';

const chart = new ChoroplethChart(document.getElementById('canvas').getContext('2d'), {
  data: {
    //...
  },
});

Development Environment

npm i -g yarn
yarn install
yarn sdks vscode

Common commands

yarn compile
yarn test
yarn lint
yarn fix
yarn build
yarn docs
chartjs-chart-geo's People

Contributors

choromanski avatar dependabot[bot] avatar jackstruck avatar jhoelzl avatar sgratzl avatar shotamatsuda avatar stockinail avatar

Stargazers

 avatar  avatar  avatar  avatar  avatar  avatar  avatar  avatar  avatar  avatar  avatar  avatar  avatar  avatar  avatar  avatar  avatar  avatar  avatar  avatar  avatar  avatar  avatar  avatar  avatar  avatar  avatar  avatar  avatar  avatar  avatar  avatar  avatar  avatar  avatar  avatar  avatar  avatar  avatar  avatar  avatar  avatar  avatar  avatar  avatar  avatar  avatar  avatar  avatar  avatar  avatar  avatar  avatar  avatar  avatar  avatar  avatar  avatar  avatar  avatar  avatar  avatar  avatar  avatar  avatar  avatar  avatar  avatar  avatar  avatar  avatar  avatar  avatar  avatar  avatar  avatar  avatar  avatar  avatar  avatar  avatar  avatar  avatar  avatar  avatar  avatar  avatar  avatar  avatar  avatar  avatar  avatar  avatar  avatar  avatar  avatar  avatar  avatar  avatar  avatar

Watchers

 avatar  avatar  avatar  avatar

chartjs-chart-geo's Issues

Legend & quantize step

Hi,

I can't get how the max value of the values is calculated for the legend:

I have value between 0 and 71 with a quantitize of 4, so I expect the steps to be 18 or at worst 20 but I get 25.. O_o

If I can't parametrized it, how can I override the function that calculate the min/max value? I tried to extend the scale function to provide my personal whole value without any effect.

How can I draw all the step value in the legend? Should I set its with higher?

Last question, why have you set up a 1000 const value for the the FitWidth function? why did you choose this value?

Thanks,

How to center my GeoChart

Good afternoon!

I'm writing because I tried to implement the geochart in my app, following the germany codepen you have in one of the old open issues. It works totally fine but i find that it always stays on the left side of the canvas area. Would you know maybe how to solve something like this?

5mar1

5Mar2

Map outline

I've started using this library to load dynamic data from an API on a choropleth map.

However, it seems as if I have to load 2 geo files to render the map as I want.

First I load the region file. In this case it for Ireland NUTS 3. Then I have to load the outline geo file which is all the countries in Europe and I find the feature for Ireland.

See my code here https://codepen.io/damienderoiste/pen/rNxqRJE

For my application to work, I need to only load the regional geo file which is retrieved from my API. Having to also load the appropriate outline file is a problem.

Can you suggest any workaround?

Thanks
Damien

Setting the graticule/ outline colour moves it in front of the colour scale

Great plugin thanks.

Assuming I'm setting it correctly, I'm having a small issue when setting the outlineBorderColor and graticuleBorderColor. It's causing the colour scale to sit behind them, making it hard to read.

To Reproduce

this.chart = new window['Chart'](context, {
            type: 'choropleth',
            data: {
                labels: this.labels,
                datasets: {
                   label: 'Countries',
                   data: Countries.map((d) => ({
                     feature: d,
                     value: this.data[d.properties.name],
                   })),
                   outlineBorderColor: this.theme === 'light' ? LightThemeColor2 : DarkThemeColor2,
                   graticuleBorderColor: this.theme === 'light' ? LightThemeColor2 : DarkThemeColor2,
                },
            },
            options: this.options,
        });

Expected behavior

For the graticule & outline to sit behind the colour scale.

Screenshot

Screenshot 2020-12-18 at 15 26 15

Context

  • Version: "^2.1.0"
  • Browser: Chrome

About using other countries other than the Germany example

I'm trying to use a map of the regions of Indonesia, but I know the that the topoJSON file is a bit different than the Germany example. So I tried using a different country than Germany just as practice, and I cant even get that to work.

Below is my attempt at integrating a map of the philippines. I dont quite understand why this one doesnt work because it should be the same as the Germany example for the topoJSON file should be formatted the same.

      const country = fetch(
        'https://raw.githubusercontent.com/deldersveld/topojson/master/continents/asia.json'
      ).then((r) => r.json());
      const states = fetch(
        'https://raw.githubusercontent.com/deldersveld/topojson/master/countries/philippines/philippines-provinces.json'
      ).then((r) => r.json());

      Promise.all([states, country]).then((data) => {
        const regions = ChartGeo.topojson
          .feature(data[0], data[0].objects.layer)
          .features.filter((item) => item.properties.NAME_0 === 'Philippines');
        const countries = ChartGeo.topojson.feature(data[1], data[1].objects.continent_Asia_subunits).features;
        const Philippines = countries.find((d) => d.properties.geounit === 'Philippines');

        const chart = new Chart(document.getElementById('myChart_Geo').getContext('2d'), {
          type: 'choropleth',
          data: {
            labels: regions.map((d) => d.properties.NAME_0),
            datasets: [
              {
                label: 'Countries',
                outline: Philippines,
                data: regions.map((d) => ({
                  feature: d,
                  value: Math.random(),
                })),
              },
            ],
          },
          options: {
            showOutline: false,
            showGraticule: false,
            legend: {
              display: false,
            },
            scale: {
              projection: 'equalEarth',
            },
            geo: {
              colorScale: {
                display: true,
              },
            },
          },
        });
      });

Why doesnt this one work?

Ultimately I want to actually use a map of Indonesia.
idn.topo.txt

Although this is converted to a .txt file, this is the Indonesia topoJSON file im trying to use. I also could not get this one to work.
Im more concerned about the Indonesia project, but knowing why the Philippines map isnt working would be nice too.

Thanks!

Map border blurry

Hi,

I run the same topojson with the same data with D3 and with your plugin and the only difference I have is on the borders that are blurry.

In the plugin:
image

With D3:
image

Do you know what can cause this?

I tried the border with option but it is not that. It seems that the "state" border are rendered twice and that may cause it to be blurry.

Thanks,

Publish 1.1.3

Can't be found on npm ATM. Any reason to not publish the latest version?

Get "Object Object" on map result... why ?

Hi,

I get [object Object] on all countries of the map.
I do not know why I get these...

Here the code I used :


fetch('https://unpkg.com/world-atlas/countries-110m.json').then((r) => r.json()).then((data) => {
      
	  const countries = ChartGeo.topojson.feature(data, data.objects.countries).features.filter((f) => f.properties.name !== 'Antarctica');
  const chart = new Chart(document.getElementById("canvas").getContext("2d"), {
    type: 'choropleth',
    data: {
      labels: countries.map((d) => d.properties.name),
      datasets: [{
        label: 'Countries',
		backgroundColor: (context) => {
			
          if (context.dataIndex == null) {
                return '#fff;';
          }
          const value = context.dataset.data[context.dataIndex].value;
		  if (value==0){
			return new Color('steelblue').lightness(1* 100).rgbString();  
		  }
		  console.log(value);	
          return new Color('steelblue').lightness(value * 5).rgbString();
		},
        data: countries.map((d) => ({feature: d, value: getRndInteger(0,100)}) ),
      }]
    },
    options: {
		layout: {
            padding: {
                left: 0,
                right: 0,
                top: 0,
                bottom: 0
            }
        },
		aspectRatio:1,
      showOutline: true,
      showGraticule: false,
      legend: {
        display: false,
		labels: {
			display:false
		}
      },
	  label:{
		display:false  
	  },
	   plugins: {
         datalabels: {
           align: 'center',
           formatter: (v) => {
			   //console.log(v);
             return v.description;
           }
         }
       },
      scale: {
        projection: 'mercator'
      },
      geo: {
        colorScale: {
          display: true,
        },
      },
    }
  });
});

Typescript Typings addition

It would be great if there would be possibility to utilize the Typescript types and interfaces.
In Readme you define some of them already.

Thank in advance.

Problem with Dataset

Hello, i am using the Europe map and your example to have a dataset with random values for all countries which works fine: https://codepen.io/sgratzl/pen/mdyENoX

However, when i want to define values on my own, the map gets empty. I just replace the line

 data: countries.map((d) => ({feature: d, value: Math.random()})),

by

data: [
        { value: 0.4, feature: Germany },
        { value: 0.3, feature: Austria }
      ]

as written in section "Data Structure" in the README.md (https://github.com/sgratzl/chartjs-chart-geo).

Question: Bundling map with the package

Hey! Another quick one for you, are we able to use this package without having to make any external API calls? Ala fetch('https://unpkg.com/world-atlas/countries-50m.json').then((r) => r.json())

Or is my only solution to manually inline this JSON into my Javascript (in my case into a Vue component)?

Buble map cuts off bubbles at edge

Describe the bug
When using bubbleMap and a bubble appears on a point close to the edge, the bubble is cut off

Expected behavior
I would expect that one of two things happen:

  1. The map would resize so that the bubble is not cut off (less ideal)
  2. the bubble would extend outside of the canvas (probably not possible)

Screenshots
image

Legend Units

Hi and thank you for the very helpful library and documentation. It took me a while to get working with React w/ Hooks, but it does work perfectly!

One thing I do not see documented and was not able to figure out is how to change the units of the legend. If working in large dollar amounts, it would be nice to see $0-$1,000,000, where without commas it could be difficult to tell a difference between 1000000 and 10000000. My guess was options.geo.legend.callbacks, but that did not have any impact on the units/display of the values.

Thanks for any help or direction you're able to provide.
Jon

Map rendering as a straight line

Hi

I am trying to create a map of counties of Ireland. I have a topojson file based on x,y coordinates.

When rendering the map, because it is x,y based I used a projection of 'equirectangular'

However, the map renders as a straight line. Maybe some problem with the width???

Here is my code https://codepen.io/damienderoiste/pen/vYGQdrg

If you hover over the line you can see it is picking up the regions and values.

If you could offer any advice as to why this is happening I'd appreciate it.

Thanks
Damien

Problem with colorscale

I'm having a problem with the colorscale. The colorscale doesn't show. I used it like this:

const chart = new Chart(document.getElementById("map").getContext("2d"), {
        type: 'choropleth',
        data: {
          labels: distritosPT.map((d) => d.properties.name),
          datasets: [{
            label: 'Distritos',
            outline: distritos2,
            backgroundColor: (context) => {
              if (context.dataIndex == null) {
                return null;
              }

              const value = context.dataset.data[context.dataIndex];
              return new Color('#78C2AD').blackness(value.value * 100).rgbString();
            },
              //data: distritos2.map((d) => ({feature: d, value: dict[d.properties.name]})),
              data: distritosPT.map((d) => ({feature: d, value: orgValues(d.properties.name)})),
          }]
        },
        options: {
          showOutline: true,
          legend: {
            display: false
          },
          scale: {
            projection: 'mercator'
          },
          **geo: {
            colorScale: {
              display: true,
              position: 'top',
              quantize: 10,
              legend: {
                position: 'top-right',
              },
            },
          },**
          tooltips: {
            callbacks: {
                afterLabel: function(tooltipItem, data) {
                  var distrito = data['labels'][tooltipItem['index']];
                  return "Union Organizations: " + dict[distrito];
                }
            }
          }
        }
      });

Hope you can help me.

Thank you.
map

Map rendering not right

I'm trying to create a map from a topojson file I generated from shape files using mapshaper.org

Shape file got from got from here http://data-osi.opendata.arcgis.com/datasets/364949f58e65474e8018ebf27d78e55e_0.zip?outSR={%22latestWkid%22:2157,%22wkid%22:2157}

When I get my json and try and plot my data against it, it doesn't display correctly
See my codepen here https://codepen.io/damienderoiste/pen/rNxqRJE

I would appreciate it if you could take a look and see any issues.

Thanks

'ChartGeo' is not defined

Hello, I am using this Package in my React Project, I have already used chart.js in my project, but to use Bubble Maps I am using this.

I have downloaded a Topojson File and suppling it to the code locally(using import).

I have also imported chartjs-chart-geo as import 'chartjs-chart-geo'

But when i try to run the Project it throws an error -> 'ChartGeo' is not defined.

Can you please help me around this error.
Thanks in Advance.

Screenshots / Sketches
Screenshot 2020-09-23 at 5 06 18 PM

Context

  • Version:
    chart.js: "^2.9.3"
    chartjs-chart-geo: "^2.1.0"

  • Browser: Chrome

Tooltips don't work with 2.9.x

Describe the bug
Tooltips don't work with 2.9.x of chart.js

To Reproduce
Use 2.8.0 chart.js, implement a tooltip, then upgrade to 2.9 and they no longer work.

Expected behavior
Tooltips should work on all versions of chart.js

Desktop (please complete the following information):

  • OS: MacOS
  • Browser: Chrome

Additional context
Seems to be a known issue as it was referenced in the closed issue regarding the compatibility of 2.9.x. This is how I found that downgrading chart.js to 2.8.0 got tooltips to work again.

Do D3 Projection functions (like center) work with this?

Hi!

I've started using ChartJs Geo recently because I need to render a map of the earth to represent some data but the map is being cut off at the top. To fix this, I wanted to the D3 Projection function "projection.center" but when I call it, absolutely nothing seems to be happening.

I've done some testing and I've also found that scale, translate and a few others don't work either (but clipAngle and rotation do work).

Could you help me figure out how to offset my map on the y axis please?

The code I'm using to try and offset the map is as follows
d3.geoPatterson().center([0,-50])

I've also tried many other projections with the exact same result.

How to create a map from an existing database

I have a JSON data loaded from the server
data looks like this:
[array]
- country name
- count (value )
How do I display this into the map with other counties (not included in the array) value to be zero and countries present in the array with the count value?

How to show the state names inside the above graph without using a data label plugin?

https://codepen.io/sgratzl/pen/GRKLQBw
How to show the state names inside the above graph without using a data label plugin? I saw that you have used chartjs-plugin-datalabels plugin one one of your graphs. I have multiple charts on my screen. When I install chartjs-plugin-datalabels plugin it will cause errors.How to do that state name inside a graph without plugin? Is there any default option?
Please take a look on the attached image i need something like that
Screenshot from 2020-07-08 12-27-14

Choropleth onClick not firing the correct country (sometimes)

Describe the bug
Choropleth onClick not firing the correct country (sometimes)

To Reproduce
Steps to reproduce the behavior:

  1. Go to https://codepen.io/theianjohnson/pen/eYmmZVw?editors=0010
  2. Open Chrome's console
  3. Hover over Greenland
  4. See Russia is highlighted
  5. Click on Greenland
  6. See Russia is logged in the console

This also happens with Chile and Argentina (they register as New Zealand)

Expected behavior
The country that is hovered/clicked on should have the correct item in the onClick event handler

(The United States works correctly)

Desktop (please complete the following information):

  • OS: MacOS Mojave
  • Browser Chrome
  • Version 78

Is there any way to pass the origin value to the color interpolation method?

Hi,

I'm new to chartjs so I'm not sure if this is related to the scale settings of chartjs itself.

About the color scales in https://github.com/sgratzl/chartjs-chart-geo/blob/main/src/scales/color.ts#L187, by default when the value reaches the interpolate() function at color.ts#L200 it passes through the _getNormalizedValue() function, so a set of [1, 2] becomes [0, 1].

Is there a way to make the value go directly to the A function without normalizing it?

How to find the source in JS ?

Hi,
I do not find how to get the final version of Chart.Geo.min.js and Chart.Geo.js here, or anywhere...
I would like to use the beta version, but I find nowhere the way to download these files.
All files in zip that we get here, do not get this compile file ended.

Thanks for your answer,
Regards

FR: Support Natural Earth TopoJSON files

Would it be possible to support the use of Natural Earth TopoJSON files for Country/State level so we have a consistent way to work with the "world"
eg drive from
https://github.com/mtraynham/natural-earth-topo/blob/master/topojson/ne_10m_admin_1_states_provinces.json and allow filtering/outline at a specific country or continent level?

User story
my specific use-case has been trying to get this working with Australian States

Additional context
having a consistent, global, solution would make this a much more useful package... I love the US capabilities and (tested) data, but struggling to get it working consistently for non-US target

The position of color scale

Hi!

I have made Europe map using outline from World map data.
But, the color scale is right bottom of the map and hidden under several countries.
I cannot find the way to change the position of color scale or bring the scale to front.
Are there any methods for that?

Thank you.

Mercator projection?

Do you support multiple types of projections for the world map? And are there projections without, for example, lat/long lines?

Tooltip positioning for Mercator Projection

Hi,

I was wondering if you had any idea on how to control the tooltip positioning for Mercator projection. Currently, the tooltip for USA is placed, I guess, at the center of a rectangle and therefore a little off the main polygon. See example below:

image

Appreciate your feedback.

Europe map

Hello, can you please tell me how to visualize a map of all European countries? Thank you!

Color interpolate function not working in v3.0.0-rc.0

The scales.color.interpolate property that can take either a function (number => string) or string interpolation name works correctly with string names, but when providing a function, it fallbacks to default "blues".

To Reproduce

Create choropleth chart with options:

{
        scales: {
            color: {
                interpolate: n => n === 0 ? '#000' : '#f00',
            }
        },
}

Expected behavior

Should show a map with black and red regions. Instead, it uses default "blues" scale, like the interpolate option would not be provided at all.

Moreover, when providing a function created with color-interpolate I get an error "Cannot read property 'map' of undefined" which makes me suspect that the number is not passed to the interpolate function at all.

Context

  • Version: 3.0.0-rc.0
  • Browser: Chrome 89.0.4389.90

Color transition

Hi,

I am using your script very conveniently.
I present time course using this map.
In graphs created by chart.js, value update changes its color gradually.
Is it possible such color transition in this script?

Masashi Idogawa

Datalabels plugin not working with latest version

When I include the latest datalabels plugin available for ChartJS v3.0 or later, which I had to do manually (see chartjs/chartjs-plugin-datalabels#213) it doesn't seem to be doing anything. No labels load, no errors log, etc.

To Reproduce

  1. Build latest chartjs-plugin-datalabels from chartjs-next branch.
  2. Include the plugin in browser tag next to chartjs and this plugin.
  3. Include a minimal configuration in the options of the chart.
  4. Run the result.

Expected behavior

Datalabels working so we can display things like state names in the map.

Cheers.

Custom color pallete for highlighting the countries in the choropleth instead of interpolate

It would be great if we can specify custom colors in the colorScale
I am trying to highlight just 5 countries in the geoMap. Right now, am using:

geo: {
        colorScale: {
            display: true,
            interpolate: 'blues',
            missing: 'white',
            legend: {
                display: 'true',
                position: 'bottom-right'
            }
        }
    }

What I wanted is to specify my own colors for highlighting the 5 countries in the geo Map. I would be great to have that feature

Zooming in my cloropleth Geo Chart

Hi! I am currently developing an app which renders a cloropleth map. However, as you can see in the image below the areas in the map can be pretty tiny so I am trying to implement a way to zoom in the map. I tried to use the plugin "chartjs-plugin-zoom" but I couldn't make it work at any kind. Would you have an example or know how could I get this feature to be added to my geo chart?

Thanks a lot.
Javier.

image

Image Export of Chart

I want to run this chart in backend and export this as image, is there any way to do it?

Empty map

Hi, I'm having trouble to get this library to work with a specific API.

Here is the relevant codepen reproducing the problem.

  • Version: 2.1.0.
  • Browser: Mozilla Firefox 78.0.2.

I tried to see if it wasn't some small issue but I couldn't find the problem. I tried different projections but still nothing shows up. Also, this particular API does not include a .transform property in the response. I plugged some values in it, with no result.

Could this be a bug or am I missing something? Thanks in advance.

Canada + Provinces

Thanks for the awesome plugin!

I am struggling to get a map of just Canada + Provinces.

I have some code that looks like this:

<template>
  <canvas id="canvas"></canvas>
</template>

<script>
import 'chart.js';
import 'chartjs-chart-geo';

import countriesTopoJson from "world-atlas/countries-50m.json";

const countries = ChartGeo.topojson.feature(
  countriesTopoJson,
  countriesTopoJson.objects.countries,
).features;

// console.log(countries);

export default {
  name: 'CATest',
  mounted() {
    const Canada = countries.find((d) => d.properties.name === 'Canada');

    const chart = new Chart(document.getElementById('canvas').getContext('2d'), { // eslint-disable-line
      type: 'choropleth',
      data: {
        labels: countries.map((d) => d.properties.name),
        datasets: [{
          label: 'States',
          outline: [Canada],
          backgroundColor: (context) => {
            if (context.dataIndex == null) {
              return null;
            }
            const value = context.dataset.data[context.dataIndex];
            return new Color('steelblue').lightness(value.value * 100).rgbString();
          },
          data: countries.map((d) => ({ feature: d, value: Math.random() })),
        }]
      },
      options: {
        legend: {
          display: false
        },
        scale: {
          projection: 'mercator'
        }
      }
    });
  },
}
</script>

<style scoped>
#canvas {
  width: 100vw;
  height: 100vh;
}
</style>

Which results in:

Screen Shot 2020-03-31 at 2 44 46 PM

How can I strip all countries that are not Canada, and also highlight all the provinces?

How to use custom projection?

Hi,

I spent many hours trying to create a projection that works out of the one you provided.

I wanted to use: https://github.com/seeschloss/francedom but I think it was made for an old version of D3.

So I found this one that can serve as a example: https://github.com/rveciana/d3-composite-projections

If I use this package, set the projection to geoAlbersUSA in your sample, I can't get it work.
It claims that "fitwidth" is not a function.

I hope you can help me to use your plug-in.
Thanks,

choropleth and bubbleMap at the same time?

Hi,
It seems that it will not be possible to have choropleth and bubbles at the same time as both are represented by its own chart type, right?
Is there something I'm missing?
Is this something you plan to add for the future?
Many thanks!

Tooltips not showing value in choropleth

Hi!

I was checking out the choropleth example you have in sandbox:

https://codepen.io/sgratzl/pen/GRKLQBw

Because I realized I found the same problem in my code, as the tooltips that appear when you hover on each region in this case show the color and the label but not the value. This doesn't happen in the bubble one and I cannot understand what is the reason for that.

Thanks for everything in advance.

chart-geo with angular

Hi!

Is possible to use chart-geo with angular and I really to triying create this example with Brazil map, is possible to share with me?

thanks a lot

Recommend Projects

  • React photo React

    A declarative, efficient, and flexible JavaScript library for building user interfaces.

  • Vue.js photo Vue.js

    ๐Ÿ–– Vue.js is a progressive, incrementally-adoptable JavaScript framework for building UI on the web.

  • Typescript photo Typescript

    TypeScript is a superset of JavaScript that compiles to clean JavaScript output.

  • TensorFlow photo TensorFlow

    An Open Source Machine Learning Framework for Everyone

  • Django photo Django

    The Web framework for perfectionists with deadlines.

  • D3 photo D3

    Bring data to life with SVG, Canvas and HTML. ๐Ÿ“Š๐Ÿ“ˆ๐ŸŽ‰

Recommend Topics

  • javascript

    JavaScript (JS) is a lightweight interpreted programming language with first-class functions.

  • web

    Some thing interesting about web. New door for the world.

  • server

    A server is a program made to process requests and deliver data to clients.

  • Machine learning

    Machine learning is a way of modeling and interpreting data that allows a piece of software to respond intelligently.

  • Game

    Some thing interesting about game, make everyone happy.

Recommend Org

  • Facebook photo Facebook

    We are working to build community through open source technology. NB: members must have two-factor auth.

  • Microsoft photo Microsoft

    Open source projects and samples from Microsoft.

  • Google photo Google

    Google โค๏ธ Open Source for everyone.

  • D3 photo D3

    Data-Driven Documents codes.